Nernst effect in the phase-fluctuating superconductor InOx
Abstract
We present a study of the Nernst effect in amorphous 2D superconductor InOx, whose low carrier density implies low phase rigidity and strong superconducting phase fluctuations. Instead of presenting the abrupt jump expected at a BCS transition, the Nernst signal evolves continuously through the superconducting transition as previously observed in underdoped cuprates. This contrasts with the case of Nb0.15Si0.85, where the Nernst signal due to vortices below Tc and by Gaussian fluctuations above are clearly distinct. The behavior of the ghost critical field in InOx points to a correlation length which does not diverge at , a temperature below which the amplitude fluctuations freeze, but phase fluctuations survive.
pacs:
74.81.Bd,72.15.Jf,74.25.FyThose past years have witnessed the emergence of the Nernst effect as an important probe of Superconducting Fluctuations (SF), following the observation of an anomalous Nernst signal above Tc in cuprates Wang et al. (2006). In amorphous superconducting thin films of Nb0.15Si0.85, a Nernst signal produced by Cooper-pair fluctuations could be detected in a wide temperature and field range Pourret et al. (2006, 2007). Close to , the magnitude of the Nernst coefficient found in this experiment was in very good agreement with the predictions of a theory by Ussishkin, Sondhi and Huse (USH) for the transverse thermoelectric response of the Gaussian fluctuations of the Superconducting Order Parameter(SOP) Ussishkin et al. (2002). This is not the case of underdoped cuprates, where the Nernst signal does not follow the predictions of the USH theoryUssishkin et al. (2002) and phase fluctuations of the SOP are believed to play a major role.
To address this issue, new theories have been proposed addressing cases where the Nernst signal is only generated by phase fluctuations of the SOP Podolsky et al. (2007) or by quantum fluctuations near a Superconductor-Insulator Transition (SIT) Hartnoll et al. (2007). On the experimental side, recent measurements on organic quasi-2D superconductors Nam et al. (2007) detected a finite Nernst signal above Tc in a temperature range widening with the approach of the Mott insulator as in the case of cuprates Wang et al. (2006). However, since the Nernst response of normal electrons scales with their mobility Behnia et al. (2007), the normal-state Nernst response is not negligible in either cuprate or organic superconductors. This complicates any quantitative comparison of the measured Nernst signal with theoretical predictions.
In this Letter, we report on the case of InOx. Several factors make thin films of this system an appealing candidate for the study of the Nernst signal generated by superconducting phase fluctuations. First of all, due to its low carrier density, a poor superfluid stiffness and, consequently, strong phase fluctuations are expected Emery and Kivelson (1995). Moreover, the normal state is a simple dirty metal, with a negligible Nernst response. This system is also believed to host a Kosterlitz-Thouless-Berezinskii (KTB) transition Crane et al. (2007). Finally, due to its large sheet resistance, quantum fluctuations of the phase of the SOP are expected to give rise to a SIT at zero-temperature.
According to our findings, the Nernst effect in this system shares common features with cuprates. In contrast with Nb0.15Si0.85, its temperature dependence does not follow the predictions of USH theory. Moreover, both the field and temperature dependence of the Nernst signal in InOx indicate that the blurred transition reflects a regime of superconducting fluctuations whose Correlation Length(CL) does not diverge. Our analysis is based on the previous study of the Nernst data in Nb0.15Si0.85 Pourret et al. (2006, 2007), which established the link between the Nernst signal and the CL Pourret et al. (2007).
The 300 Å-thick amorphous InOx film used in this study is deposited on a glass substrate by -gun evaporation of In2O3 in oxygen atmosphere Ovadyahu (1993). Using a one-heater-two-thermometers setup, four point resistance, Hall effect and thermoelectric measurements are measured in a single cool-down. The as-prepared film is insulating down to the lowest measured temperature of 60 mK. After thermal annealing at C under vacuum as described elsewhere Ovadyahu (1986), the sheet resistance decreases by about 30 % and a superconducting state appears. According to optical absorption experiments, this drop of resistivity is the consequence of the volume shrinkage of the sample during annealing Ovadyahu (1993). During all measurements, the film has been kept below liquid nitrogen temperature to avoid aging effects.
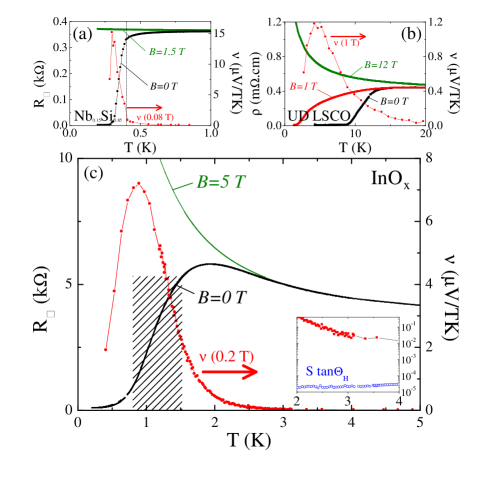
Fig. 1 compares the behavior of the Nernst signal , measured in the low field limit, in the vicinity of the superconducting transition in three different systems. In the case of Nb0.15Si0.85 Pourret et al. (2006), increases abruptly at the BCS superconducting transition. It was shown Pourret et al. (2006, 2007) that above , the Nernst signal is generated by Cooper pairs fluctuations, and below , by well defined vortices. In contrast, in La1.94Sr0.06CuO4 Capan et al. (2003), as seen in Fig. 1b, no distinct anomaly in is visible at any temperature separating these two regimes. As seen in Fig. 1c, the same is true for InOx: The Nernst signal evolves continuously across the superconducting transition. As seen in the inset of the same figure, the signal is at least times larger than the product of the Seebeck coefficient and the Hall angle. Since the latter () sets the order of magnitude of the normal-state response, the observed Nernst signal is almost entirely due to SF.
A low carrier density is one fundamental feature shared by InOx and La1.94Sr0.06CuO4. The Hall coefficient measured in our film ( m3.C-1) is close to the one found in La1-xSrxCuO4 (LSCO) at x=0.05 Hwang et al. (1994) and yields a carrier density of cm-3. On the other hand, the Hall coefficient in Nb0.15Si0.85 is 80 times lower Pourret et al. (2006), implying a much higher carrier density. Since the superfluid stiffness is proportional to the superfluid density, superconductors such as InOx and La1.94Sr0.06CuO4 are expected to display strong phase-fluctuations Emery and Kivelson (1995). This is the most plausible source of this peculiar Nernst response in the vicinity of the superconducting transition.
Since ,the Nernst and resistivity data suffice to determine the transverse Peltier response as presented in Figure 2. Above , for short-lived Cooper pairs described as Gaussian fluctuations of the SOP, this coefficient is simply related to the superconducting CL, at 2D Ussishkin et al. (2002). The inset of Figure 2 shows that in Nb0.15Si0.85 cooling leads to a steep increase in at , indicating the divergence of the CL. In contrast, for InOx, evolves continuously and no abrupt change is observed on the whole temperature range of measurements; i.e; 0.6 K to 4.5 K. This suggests that there is no diverging CL and therefore, no true phase transition at , the temperature corresponding to the formation of Cooper pairs, expected to be located in the K range and represented by shaded regions in figures 1 and 2.
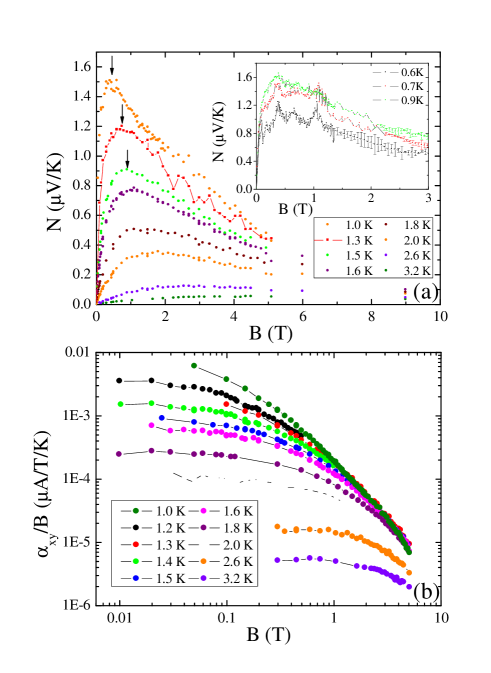
We now proceed to an analysis of the field dependence of the Nernst data, which leads to the same conclusion. Fig. 3a shows that, for each temperature, the Nernst signal peaks with a maximum at a temperature-dependent magnetic field scale . This peak can be clearly observed in down to a temperature of 0.9 K. As discussed in previous studies on Nb0.15Si0.85 Pourret et al. (2006, 2007), at any temperature and magnetic field, depends only on the size of SF. At zero magnetic field, this size is set by the CL. At high field, this size is set by the magnetic length when it becomes shorter than the zero-field CL. Thus, this coefficient acquires a characteristic field-temperature dependence that is observed in Nb0.15Si0.85 Pourret et al. (2007) and in InOx as shown Fig. 3b. is field-independent at low magnetic field, however, at high magnetic field, all the data evolve toward a single curve weakly dependent on temperature. This crossover is responsible for the peak observed at in the field dependence of the Nernst signal (see arrows in Fig. 3a).
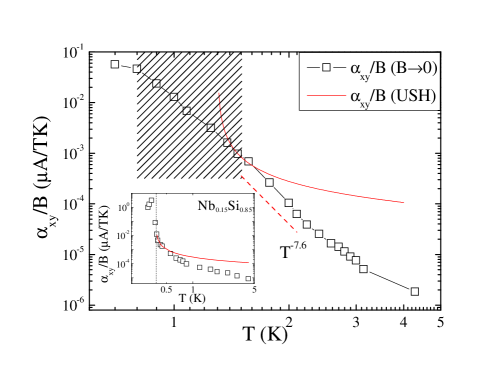
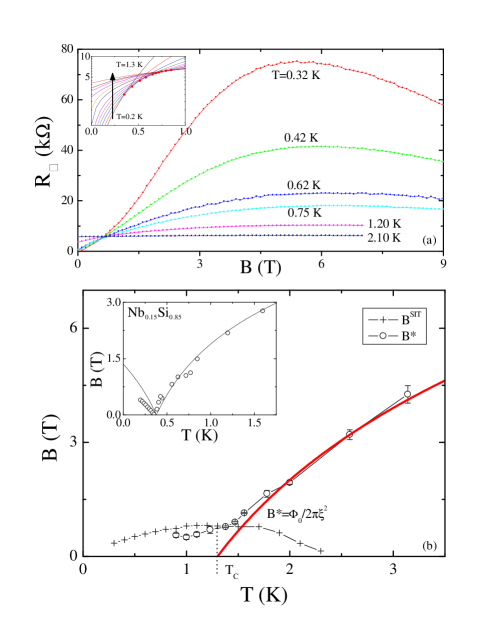
The temperature dependence of is presented in fig. 4b for InOx (main panel) and for Nb0.15Si0.85 Pourret et al. (2007) (inset). In both systems, above , as expected for the Ghost Critical Field (GCF), , set by the BCS CL, where . In the case of Nb0.15Si0.85 , and could be independently determined and compared with the GCF determined from the Nernst data. For InOx, on the other hand, we set and such that the GCF line fits . The thick line Fig. 4 is a fit using nm and K. This value of corresponds to the mid-point of the resistive transition, as seen Figure 1. A similar conclusion on the position of was drawn by a recent study on InOxCrane et al. (2007).
With the temperature dependence of the CL just determined, we find that USH formulaUssishkin et al. (2002), when :
| (1) |
is close to the measured , as seen Fig. 2. However, decreases with temperature as fast as , much faster than predicted by the USH theory. One possibility is that the CL is too short for the applicability of the USH theory on a large temperature range. Indeed, in Nb0.15Si0.85, where is larger, was found to deviate from USH theory for , see inset of Fig.2. Since is shorter in InOx, the deviation from theory is expected to occur closer to Tc. Another possibility is a deep difference in the nature of fluctuations in the two systems. A recent model of phase-only fluctuations Podolsky et al. (2007) predicts a faster decrease of the Nernst signal above compared to what is expected in the Gaussian picture in the temperature range above , in qualitative agreement with what is seen here. However, if the fast decrease of the Nernst signal observed up to 4 K is due to fluctuations with frozen amplitude, it would imply to be above 4 K, which is unlikely.
While we find difficult to draw conclusions from temperature dependence of the Nernst data, the interpretation of the field position of the Nernst peak as the GCF appears straightforward. According to our analysis, this field scale reflects the CL, no matter the precise nature of SF, Gaussian or phase-only. This recently received some theoretical support. Functional forms for the field dependence compatible with a maximum at the GCF have been predicted by a theory expanding the USH theory to finite field Larkin and Varlamov (2007) and by a recent theory of the Nernst effect in the vicinity of a SIT Hartnoll et al. (2007).
In Nb0.15Si0.85 (see inset of Fig. 4b) the GCF vanishes and at Tc (reflecting the divergence of the CL) mirrors the behavior of the Hc2(T) below Tc. One striking observation of this work is the breakdown of this picture in InOx . As seen in Fig. 3a, keeps decreasing down to K, well below our estimate of K. This indicates that the CL does not diverge and that no true phase transition occurs at , the temperature associated with the formation of Cooper pairs. An identical conclusion was drawn from the temperature dependence of where no abrupt change is observed upon crossing . This leads us to conclude that the wide superconducting transition is not simply the consequence of a large critical region, or sample inhomogeneity, but reflects the presence of an intermediate fluctuation region between , where amplitude fluctuations freeze, and a lower temperature, , where phase coherence should be established. Such a region of phase-only fluctuations in InOx was recently inferred from high-frequency conductivity measurements Crane et al. (2007).
Upon cooling, phase fluctuations are expected to disappear at KTB transition where the vortex and anti-vortex bind together. Since the vortices are a major source of the Nernst signal, the latter should be strongly affected by KTB transition. Below 0.9 K, the overall magnitude of the Nernst signal decreases and the field dependence displays a broad maximum with complicated but reproducible substructures. The reduced amplitude points to a reduced vortex mobility below 0.9 K, a possible signature of the KTB transition. The multiple peaks observed in are reminiscent of what was also observed in the field dependence of the Nernst signal in hole-doped cuprates at low temperatures and tentatively attributed to a plastic flow of vortices Wang et al. (2006).
This behavior may also be related to the SIT and Bose insulating properties of this system. As previously observed in InOx Gantmakher et al. (2000); Shahar and Ovadyahu (1992), at low temperature, the magnetoresistance increases steeply following the magnetic-field induced SIT, (see Fig. 4a). According to the dirty-boson model Fisher (1990), the insulating side is formed of Cooper pairs localized by the quantum melting of the vortex system. Within this framework, the negative magnetoresistance observed at high field is due to the pair-breaking effect of the magnetic field when . Using our previous estimation of the CL, we find , which is about the position of the maximum of the magnetoresistance curves, thus providing support to this interpretation of the negative magnetoresistance.
In contrast to the SIT observed in Nb0.15Si0.85 Aubin et al. (2006), MoGe Yazdani and Kapitulnik (1995), or Bi Marković et al. (1999) thin films, the crossing-point , reported Fig. 4, is temperature dependent. This behavior has been discussed previously for this compound Gantmakher and Golubkov (2001) and remains yet to be understood.
To summarize, measuring Nernst signal and resistivity in InOx, we found that the transverse Peltier coefficient evolves continuously across the superconducting transition. Furthermore, we find that the GCF keeps decreasing on the temperature range where the Cooper pair formation is expected to occur. This indicates that no true phase transition occurs at and implies the existence of a regime of phase-only fluctuations of the SOP. The similarity between the temperature dependence of the Nernst signal measured in and the underdoped cuprates is additional support for the existence of a regime of phase-only fluctuations in the latter system.
We are grateful to Z. Ovadyahu for the realization of InOx samples and C. Capan for the Nernst data on LSCO. The authors are also grateful to M. Feigelman, M. Mueller, A. Vishwanath, S. Sachdev, M. Skvortsov and A. Varlamov for discussions.
References
- Wang et al. (2006) Y. Wang, L. Li, and N. P. Ong, Phys. Rev. B 73, 024510 (2006).
- Pourret et al. (2006) A. Pourret, H. Aubin, J. Lesueur, C. A. Marrache-Kikuchi, L. Berge, L. Dumoulin, and K. Behnia, Nature Physics 2, 683 (2006).
- Pourret et al. (2007) A. Pourret, H. Aubin, J. Lesueur, C. A. Marrache-Kikuchi, L. Berge, L. Dumoulin, and K. Behnia, Phys. Rev. B 76, 214504 (2007).
- Ussishkin et al. (2002) I. Ussishkin, S. L. Sondhi, and D. A. Huse, Phys. Rev. Lett. 89, 287001 (2002).
- Podolsky et al. (2007) D. Podolsky, S. Raghu, and A. Vishwanath, Physical Review Letters 99, 117004 (2007).
- Hartnoll et al. (2007) S. A. Hartnoll, P. K. Kovtun, M. Mueller, and S. Sachdev, Phys. Rev. B 76, 144502 (2007).
- Nam et al. (2007) M. S. Nam, A. Ardavan, S. J. Blundell, and J. A. Schlueter, Nature 449, 584 (2007).
- Behnia et al. (2007) K. Behnia, M.-A. Méasson, and Y. Kopelevich, Phys. Rev. Lett. 98, 076603 (2007).
- Capan et al. (2003) C. Capan, K. Behnia, Z. Z. Li, H. Raffy, and C. Marin, Phys. Rev. B 67, 100507 (2003).
- Emery and Kivelson (1995) V. Emery and S. Kivelson, Nature 374, 434 (1995).
- Crane et al. (2007) R. W. Crane, N. P. Armitage, A. Johansson, G. Sambandamurthy, D. Shahar, and G. Grüner, Phys. Rev. B 75, 094506 (2007).
- Ovadyahu (1993) Z. Ovadyahu, Phys. Rev. B 47, 6161 (1993).
- Ovadyahu (1986) Z. Ovadyahu, Journal of Physics C: Solid State Physics 19, 5187 (1986).
- Hwang et al. (1994) H. Y. Hwang, B. Batlogg, H. Takagi, H. L. Kao, J. Kwo, R. J. Cava, J. J. Krajewski, and W. F. Peck, Phys. Rev. Lett. 72, 2636 (1994).
- Larkin and Varlamov (2007) A. Larkin and A. Varlamov, Theory of fluctuations in superconductors (russian language version) (2007).
- Gantmakher et al. (2000) V. F. Gantmakher, M. V. Golubkov, V. T. Dolgopolov, G. E. Tsydynzhapov, and A. A. Shashkin, JETP Lett. 71, 160 (2000).
- Shahar and Ovadyahu (1992) D. Shahar and Z. Ovadyahu, Phys. Rev. B 46, 10917 (1992).
- Fisher (1990) M. P. A. Fisher, Phys. Rev. Lett. 65, 923 (1990).
- Aubin et al. (2006) H. Aubin, C. A. Marrache-Kikuchi, A. Pourret, K. Behnia, L. Berge, L. Dumoulin, and J. Lesueur, Phys. Rev. B 73, 094521 (2006).
- Yazdani and Kapitulnik (1995) A. Yazdani and A. Kapitulnik, Phys. Rev. Lett. 74, 3037 (1995).
- Marković et al. (1999) N. Marković, C. Christiansen, A. M. Mack, W. H. Huber, and A. M. Goldman, Phys. Rev. B 60, 4320 (1999).
- Gantmakher and Golubkov (2001) V. F. Gantmakher and M. V. Golubkov, JETP Lett. 73, 131 (2001).