Go Long, Go Deep: Finding Optical Jet Breaks for Swift-Era GRBs with the LBT11affiliation: Based on data acquired using the Large Binocular Telescope (LBT). The LBT is an international collaboration among institutions in the United States, Italy and Germany. LBT Corporation partners are: The University of Arizona on behalf of the Arizona university system; Istituto Nazionale di Astrofisica, Italy; LBT Beteiligungsgesellschaft, Germany, representing the Max-Planck Society, the Astrophysical Institute Potsdam, and Heidelberg University; The Ohio State University, and The Research Corporation, on behalf of The University of Notre Dame, University of Minnesota and University of Virginia.
Abstract
Using the 8.4m Large Binocular Telescope, we observed six GRB afterglows from 2.8 hours to 30.8 days after the burst triggers to systematically probe the late time behaviors of afterglows including jet breaks, flares, and supernova bumps. We detected five afterglows with Sloan ’ magnitudes ranging from 23.0–26.3 mag. The depth of our observations allows us to extend the temporal baseline for measuring jet breaks by another decade in time scale. We detected two jet breaks and a third candidate, all of which are not detectable without deep, late time optical observations. In the other three cases, we do not detect the jet breaks either because of contamination from the host galaxy light, the presence of a supernova bump, or the intrinsic faintness of the optical afterglow. This suggests that the basic picture that GRBs are collimated is still valid and that the apparent lack of Swift jet breaks is due to poorly sampled afterglow light curves, particularly at late times.
1 Introduction
It is a basic ingredient in GRB models that GRBs are collimated in jets (e.g., Rhoads 1999). This assumption affects the estimates of both the total energy of GRBs and the rate of GRBs. Depending on the GRB jet model, a beaming correction of – is needed to obtain the intrinsic rate of GRBs (e.g., Frail et al. 2001; Granot et al. 2002; Zhang et al. 2004; Yamazaki et al. 2004; Dai & Zhang 2005), and uncertainties in this correction need to be resolved before we can fully understand GRBs and their progenitors. Before the launch of Swift, jet breaks had been observed in many optical light curves (see Zeh et al. 2006 for a collection of pre-Swift jet breaks) and several bursts had achromatic breaks across the optical bands (e.g., GRB 990510, Stanek et al. 1999), consistent with the predictions of the jet model. After the launch of Swift (Gehrels et al. 2004), with its rapid localization of GRBs and the dedicated on-board XRT instrument, the number of GRBs with jet breaks was expected to increase significantly. Instead, the afterglow light curves were found to be more complicated, especially in the X-ray band, where multiple breaks or giant X-ray flares are present in more than half of the Swift-XRT light curves (Nousek et al. 2006; O’Brien et al. 2006). The optical afterglow light curves also show complicated decay patterns both in pre-Swift bursts (e.g. Bersier et al. 2003) and Swift bursts (e.g., Stanek et al. 2007). With these complications in the afterglow light curves, it can be difficult to identify a jet break. As a result, the number of jet breaks detected in the Swift era is rather small (e.g., GRB 050525A, Blustin et al. 2006, GRB 060206, Stanek et al. 2007, and GRB 060526, Dai et al. 2007, and see Liang et al. 2007 for a comprehensive analysis). Indeed, the absence of late time X-ray breaks can be interpreted as a challenge to the basic beaming model (e.g., Burrows & Racusin 2007a) or the fireball model (Dado et al. 2007).
While the flares are complications, the biggest problem for identifying jet breaks is the need for well-sampled, long term light curves. While almost all Swift bursts have good signal-to-noise ratio (S/N) X-ray light curves at early decay times, most of the jet breaks occur at late times when the uncertainties in the XRT light curves increase significantly. In these cases, the claim that the data are consistent with the single power-law decay does not distinguish between models, because the error-bars are so large that the data are also consistent with the broken power-law of a jet break — jet breaks are “hidden” in low S/N light curves or “masked” by additional sources of emission (Curran et al. 2007; Ghirlanda et al. 2007; Sato et al. 2007). Shao et al. (2007) have also proposed that jet breaks are hidden by X-ray light echos from dust scattering. In the optical bands, the afterglow monitoring is generally sparse, in part because of the large number of bursts detected. However, the late-time afterglow can be measured accurately using large optical telescopes. In fact, all the Swift bursts where jet breaks have been detected have well-sampled optical light curves (e.g., Dai et al. 2007).
Given the need for deep, late-time monitoring of GRBs, we initiated an observing program using the newly built 8.4 meter Large Binocular Telescope (LBT, Hill et al. 2006). With 20–30 minute exposures, we are able to reach a flux limit of – mag in the Sloan band. This allows us to extend the temporal baselines of optical afterglow monitoring by roughly an order of magnitude, and systematically search for the jet breaks and other emission components in the optical light curves.
2 Observations and Data Reduction
We observed 6 GRBs, GRB 070125 (Hurley et al. 2007), GRB 070311 (Mereghetti et al. 2007), GRB 070411 (Moretti et al. 2007), GRB070412 (Romano et al. 2007), GRB070419A (Stamatikos et al. 2007), GRB070518 (Guidorzi et al. 2007), with the 8.4 LBT (Hill et al. 2006) using the Large Binocular Camera (LBC) Blue CCD camera (Ragazzoni et al. 2006) during the LBT/LBC Science Demonstration Time period in January–November 2007. A journal of the LBT observations is presented in Table 1. We took 5–25 dithered, 200 s exposures for each epoch using the SDSS -band filter. All the images from a given epoch were registered to a common astrometric grid and co-added. We ran DAOPHOT/ALLSTAR (Stetson 1992) on the deep, co-added images to obtain instrumental magnitudes of all the detected point-sources. The magnitudes of the GRBs were calibrated relative to bright stars, either a single star from the USNO-B catalog or several stars with SDSS photometric data. We gathered other or bands data for these bursts from GCN circulars and the literature to complete the optical light curves. While that there are slight differences between , , and Sloan filters, this has little consequence for our analysis.
We also reduced the Swift-XRT light curves for the sample.
We started from the XRT level 2 event files for the photon counting (PC) mode, where events were filtered to be in the 0.2-10 keV energy band and restricted to grades 0–12.
We extracted the XRT-PC spectra and light-curves with the software tool xselect.
We used the rmf files from the standard XRT calibration distribution, generated the arf files with the Swift-XRT software tool
and fit the X-ray spectra with XSPEC (Arnaud 1996).
3 The Afterglow Light Curves
3.1 GRB 070125
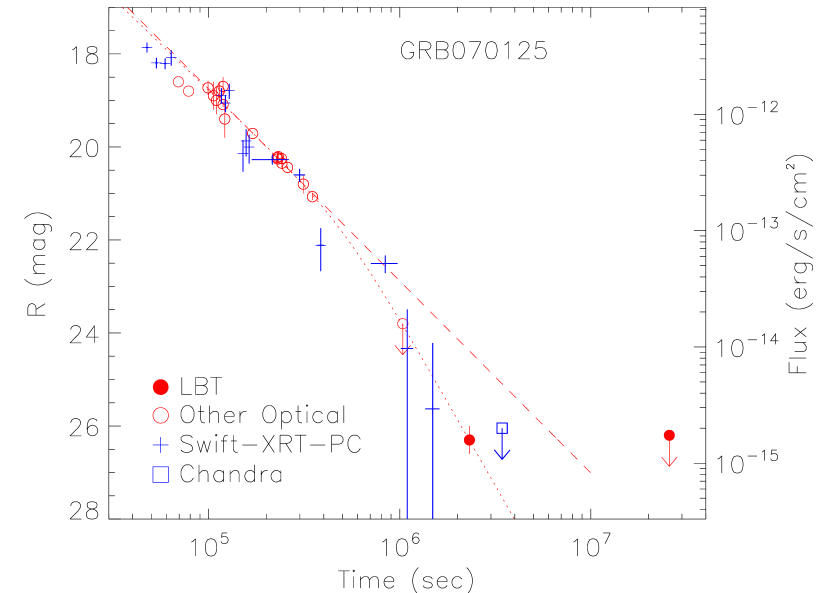
GRB 070125111An independent analysis of GRB 070125 is provided by Updike et al. (2008) (, Fox et al. 2007) was relatively well observed in the optical bands, and GCN data sample between and s after the burst trigger. The optical data from to s can be well fit by a power-law model (dashed line in Figure 1) with a slope of (). The first LBT data point ( mag at 26.8 days) deviates by from the single power-law fits. The non-detection of the second LBT observation ( mag at 298 days) indicates that the first LBT detection is mostly from the afterglow emission with little host galaxy contamination. The data suggests an optical break between the LBT observations and the early data taken before s, which is also supported by the upper limit of mag at s from MDM (Mirabal et al. 2007). We fit the optical data with a broken power-law as where we fixed the smoothness parameter to , and obtained , , and s with .
GRB 070125 was also observed by Swift and Chandra. We compared the X-ray light curve to the optical light curve, and found that they are broadly consistent with each other. We fit the X-ray data before s with a power-law to obtain a decay index of –1.7 depending on whether we include the X-ray data before s. Although the X-ray decay index has a considerable range, even for the extreme case of , the extrapolation of the single power-law (erg cm-2 s-1) is inconsistent with Chandra upper limit of erg cm-2 s-1at s (Cenko et al. 2007), strongly suggesting the existence of a break in the X-ray light curve.
We tested the standard afterglow/jet models (e.g., Sari et al. 1997; Rhoads 1999 and see Zhang & Mészáros 2004 for a review) using our temporal decay indices and the spectral index of that we derived from the X-ray data (consistent with the estimate from Burrows & Racusin 2007b). The pre-break spectral and temporal decay indices follow the relation , suggesting that the afterglow is at the evolutionary stage of where and are the typical frequency of the synchrotron radiation and the cooling frequency, respectively. At this stage, the standard models for a constant ISM density predict a post-decay index between and depending on whether or not sideways expansion of the jet is included. Our post-decay index of is closest to the value expected with maximal sideways expansion.
Thus, GRB 070125 shows a “textbook jet break”. Although the optical light curve provides much tighter constraints on the pre and post-break decay slopes, the break is independently seen in both optical and X-ray light curves, and the consistency of the optical and X-ray light curves suggests that the break is achromatic. Furthermore, the spectral and temporal decay indices before and after the break satisfy the predictions from the standard jet models.
3.2 GRB 070311
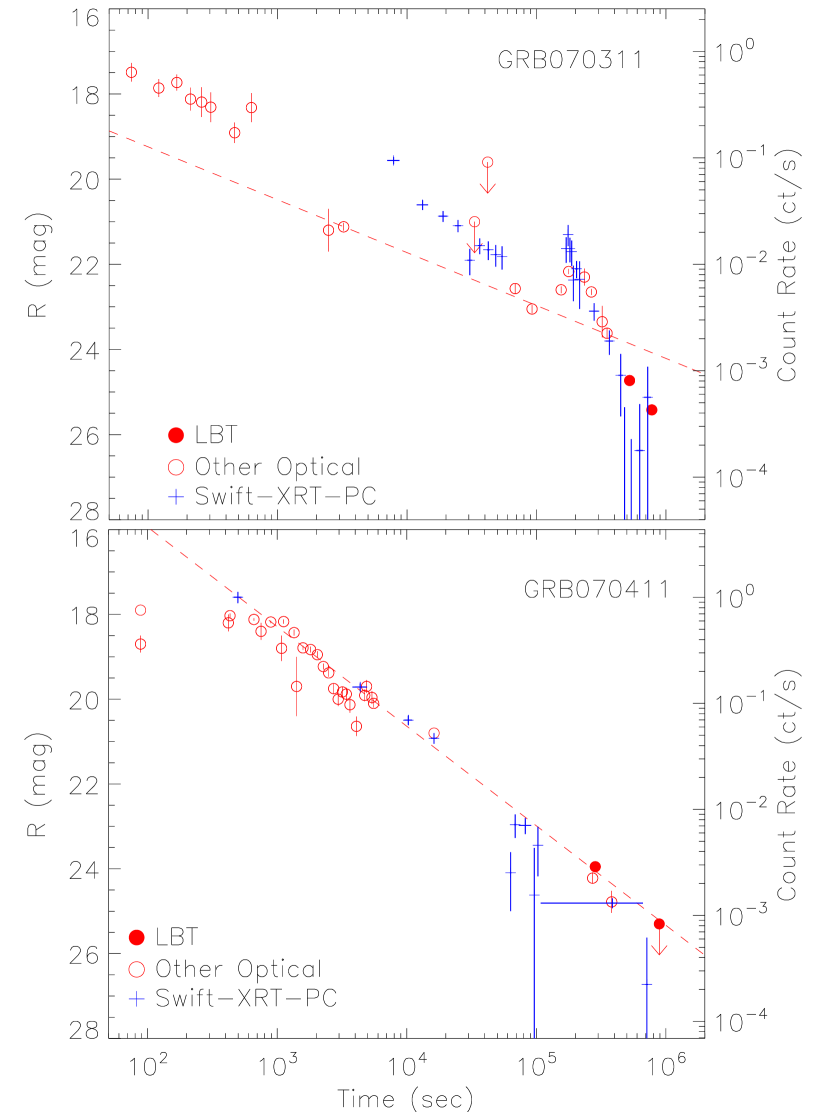
The late-time optical light curve of GRB 070311 contains a significant flare at s, which is immediately followed by a steep decay during the period from to s with a decay slope of with (Figure 2 upper panel). A detailed analysis of this flare is provided by Guidorzi et al. (2007b). Before the flare, the four optical data points (– s) set a decay slope of (). After the flare, the two LBT data points are significantly below the extrapolation of the power-law decay before the flare, and have a decay slope of (). This indicates a break in the optical light curve, with the break occurring during the flare from s to s. The post-break decay slope also suggests a relatively low electron index of . The XRT X-ray light curve also shows a flare very close to the optical flare, and it follows a similar steep post-flare decay slope (). The X-ray and optical light curves after the flare and the break are mutually consistent. However, it is difficult to determine whether the decay slope for the last few X-ray data points has flattened to match our LBT data given the S/N of the X-ray light curve. It is also obvious that the optical-to-X-ray flux ratio has changed before and after the flare/break, suggesting that the early X-ray light curve has a significant flux contribution from additional emission components.
3.3 GRB 070411
GRB 070411 (Figure 2 lower panel) at (Jakobsson et al. 2007) has a well-sampled optical light curve at early times (before s) and the early light curve shows complicated decay patterns that are also present in many other bursts (e.g., GRB 060206, Stanek et al. 2007). The late time optical light curve (after s), however, is not well sampled. We fit the optical light curve after s with a single power-law and obtained a decay index of (). Although this power-law fit cannot fully represent the complicated early afterglow decay, it is consistent with the late time optical light curve, where fitting the data after s yields with improved fits with . However, our 3 upper limit from LBT at 10.3 days is slightly below the extrapolation of the single power-law determined from the early epochs of optical data. We also tested fitting the power-law decay to a longer time baseline that included the early optical data before s, and we obtained slightly flatter slopes which will lead to larger deviations from the LBT limit at 10.3 days. The X-ray light curve has a slightly steeper slope for the single power-law fit ( with ) than the optical slope. Since the last two X-ray data points show possible deviations from the single power-law decay, we also tried a broken power-law fit, and obtained a comparable fit with ). The optical and X-ray data set a lower limit for the jet break s. A break between s and s is consistent with the optical and X-ray data; however, the late time data are still not deep enough to exclude the single power-law model.
3.4 GRB 070412, GRB 070419A, and GRB 070518
GRB 070412 appears optically dark. We observed GRB 070412 twice with the LBT at 2.8 hours and 8.2 days after the burst respectively. We place upper limits of for both observations. Most of the other optical observations of GRB 070412 also only yield upper limits. Therefore, we are unable to search for the jet break in GRB 070412. The late time optical light curves for both GRB 070419A and GRB 070518 flattened compared to the early optical observations taken before the LBT data, indicating other emission components besides the afterglow. In GRB 070518, the extra optical flux contribution may come from the host galaxy because the LBT images show that the source is extended. GRB 070419A is more interesting, since there is a late time bump in the optical light curve, consistent with a supernova bump. The details will be discussed in companion papers (Garnavich et al. 2008, in preparation; McClelland et al. 2008 in preparation). In both cases, we are unable to search for a late time optical jet break.
4 Discussion
We observed six GRBs afterglows using the 8.4m LBT from 2.8 hours to 30.8 days after the burst triggers. With 20–30 minute exposures, we are able to reach a flux limit of – mag in the Sloan band. These observations systematically probe the late time decay of the afterglows. In particular, these observations enable us to extend the temporal baseline for measuring the jet breaks by another decade in a logarithmic time scale.
In three of the six bursts, we are unable to detected the optical jet break because of the nature of the afterglow. GRB 070412 is optically dark and the late-time optical light curves of GRB 070419A and GRB 070518 contain other emission components from the host galaxy or a supernova which will mask a jet break. In the other three cases, we clearly detected jet breaks in GRB 070125 and GRB 070311, and a break is probably required for GRB 070411. The optical jet breaks in all three cases occur at late-times, when the afterglows have faded to be fainter than mag. Such faint breaks are not detectable without deep, late-time imaging of the afterglow. This strongly suggests that most failures to detect jet breaks are due to the lack of well-sampled afterglows either in the rate of sampling or the temporal baselines. Several other well-sampled Swift bursts (e.g., GRB 060206, Stanek et al. 2007 and GRB 060526, Dai et al. 2007) also clearly show jet breaks.
The XRT light curves suffer from similar problems. Although the XRT light curves have good S/N at early times, the S/N decreases significantly for the time scales on which the jet breaks frequently occur. The problem is particularly severe for the last few XRT data points, where the count rate is affected by the choice of source region, background region, binning, and other effects such as flares either in the GRB itself or in background sources. Thus, conclusions about the existence of jet breaks with typical data are heavily dependent on the prior for fitting either a single power-law or broken power-law. This is also reflected in our sample. For example, in GRB 070125, the XRT data points can be fit with both single or broken power-laws. This problem is also present in several other bursts (e.g., GRB 060526, Dai et al. 2007), where the optical data require a break while the X-ray data are only consistent with a break. In the case of GRB 070125, an upper limit from a deep Chandra observation (Cenko et al. 2007) is below the extrapolation from the single power-law decay, independently confirming the existence of of a break.
Analyses of jet breaks are also affected by the complicated decay patterns. When extra emission processes, such as energy injection or flares, are important in the light curve, it is difficult to determine the forward shock emission decay slope. This may explain the case of GRB 070311, where extra emission components in both the optical and X-ray light curves may affect the slopes of the afterglows.
Given these problems, and the fact that almost all well-sampled bursts in the optical bands show a significant break, we argue that the basic picture that GRBs are collimated is still valid. Invalidating the jet model requires examples without jet breaks even at late times rather than a failure to find a break at early times. More well-sampled bursts are still needed to securely measure a large sample of jet breaks, to constrain the jet models and determine the beaming correction for GRBs. Accurate estimates of the beaming corrections are needed to determine the intrinsic rate of GRBs and to match those rates to possible progenitor populations.
References
- Arnaud (1996) Arnaud, K.A., 1996, ASP Conf. Ser. 101: Astronomical Data Analysis Software and Systems V, ed. Jacoby G. & Barnes J., 17
- Berger et al. (2007) Berger, E., et al. 2007, GCN, 6278, 1
- Bersier et al. (2003) Bersier, D., et al. 2003, ApJ, 584, L43
- Blustin et al. (2006) Blustin, A. J., et al. 2006, ApJ, 637, 901
- Burrows & Racusin (2007a) Burrows, D. N., & Racusin, J. 2007a, arXiv:astro-ph/0702633
- Burrows & Racusin (2007b) Burrows, D. N., & Racusin, J. 2007b, GCN 6181
- Cenko et al. (2007) Cenko, S. B., et al. 2007, GCN 6186
- Cenko & Fox (2007) Cenko, S. B., & Fox, D. B. 2007a, GCN, 6028, 1
- Curran et al. (2007) Curran, P. A., et al. 2007, ArXiv e-prints, 710, arXiv:0710.5285
- Dado et al. (2007) Dado, S., et al. 2007, ArXiv e-prints, 712, arXiv:0712.1527
- Dai & Zhang (2005) Dai, X., & Zhang, B. 2005, ApJ, 621, 875
- Dai et al. (2007) Dai, X., et al. 2007, ApJ, 658, 509
- Ferrero et al. (2007) Ferrero, P., et al. 2007, GCN, 6319, 1
- (14) Fox, D. B., et al. 2007, GCN 6071
- Frail et al. (2001) Frail, D. A., et al. 2001, ApJ, 562, L55
- Gehrels et al. (2004) Gehrels, N., et al. 2004, ApJ, 611, 1005
- Ghirlanda et al. (2007) Ghirlanda, G., et al. 2007, A&A, 466, 127
- Gomboc et al. (2007) Gomboc, A., et al. 2007, GCN, 6271, 1
- Granot et al. (2002) Granot, J., Panaitescu, A., Kumar, P., & Woosley, S. E. 2002, ApJ, 570, L61
- Greco et al. (2007) Greco, G., et al. 2007a, GCN, 6047, 1
- Greco et al. (2007) Greco, G., et al. 2007b, GCN, 6204, 1
- Guidorzi et al. (2007) Guidorzi, C., et al. 2007a, GCN 6415
- Guidorzi et al. (2007) Guidorzi, C., et al. 2007b, A&A, 474, 793
- Haislip et al. (2007) Haislip, J., et al. 2007, GCN, 6044, 1
- Halpern & Armstrong (2007) Halpern, J. P., & Armstrong, E. 2007a, GCN, 6195, 1
- Halpern & Armstrong (2007) Halpern, J. P., & Armstrong, E. 2007b, GCN, 6199, 1
- Halpern & Armstrong (2007) Halpern, J. P., & Armstrong, E. 2007c, GCN, 6203, 1
- Halpern & Armstrong (2007) Halpern, J. P., & Armstrong, E. 2007d, GCN, 6208, 1
- Hill et al. (2006) Hill, J. M., Green, R. F., & Slagle, J. H. 2006, Proc. SPIE, 6267, 62670Y
- Hurley et al. (2007) Hurley, K., et al. 2007, GCN 6024
- Jakobsson et al. (2007) Jakobsson, P., et al. 2007, GCN, 6283, 1
- Jelinek et al. (2007) Jelinek, et al. 2007a, GCN, 6197, 1
- Jelinek et al. (2007) Jelinek, et al. 2007b, GRB Coordinates Network, 6272, 1
- Kann et al. (2007) Kann, D. A., et al. 2007a, GCN, 6206, 1
- Kann et al. (2007) Kann, D. A., et al. 2007b, GCN, 6295, 1
- Liang et al. (2007) Liang, E.-W., et al. 2007, ArXiv e-prints, 708, arXiv:0708.2942
- Mereghetti et al. (2007) Mereghetti, S., et al. 2007, GCN 6189
- Mikuz et al. (2007) Mikuz, H., et al. 2007a, GCN, 6270, 1
- Mikuz et al. (2007) Mikuz, H., et al. 2007b, GCN, 6288, 1
- Mirabal et al. (2007) Mirabal, N., et al. 2007, GCN, 6096, 1
- Moretti et al. (2007) Moretti, A., et al. 2007, GCN 6267
- Nousek et al. (2006) Nousek, J. A., et al. 2006, ApJ, 642, 389
- O’Brien et al. (2006) O’Brien, P. T., et al. 2006, ApJ, 647, 1213
- Perley et al. (2007) Perley, D. A., et al. 2007, GCN, 6350, 1
- Ragazzoni et al. (2006) Ragazzoni, R., et al. 2006, Proc. SPIE, 6267, 626710
- Rhoads (1999) Rhoads, J. E. 1999, ApJ, 525, 737
- Romano et al. (2007) Romano, P., et al. 2007, GCN 6273
- Sari (1997) Sari, R. 1997, ApJ, 489, L37
- Sato et al. (2007) Sato, G., et al. 2007, ApJ, 657, 359
- Shao et al. (2007) Shao, L., et al. 2007, ApJ, in press (arXiv:0711.3800v1)
- Stamatikos et al. (2007) Stamatikos, M., et al. 2007, GCN 6302
- Stanek et al. (2006) Stanek, K. Z., et al. 2007, ApJ, 654, L21
- Stanek et al. (1999) Stanek, K. Z., Garnavich, P. M., et al. 1999, ApJ, 522, L39
- Stetson (1992) Stetson, P. B. 1992, JRASC. 86, 71
- Terra et al. (2007) Terra, F., et al. 2007a, GCN, 6064, 1
- Uemura et al. (2007) Uemura, M., Arai, A., & Uehara, T. 2007, GCN, 6039, 1
- Updike et al. (2007) Updike, A. C., et al. 2007a, GCN, 6201, 1
- Updike et al. (2008) Updike, A. C., et al. 2008, ApJ, in press, arXiv:0805.1094
- Xing et al. (2007) Xing, L. P., et al. 2007, GCN, 6035, 1
- Yamazaki et al. (2004) Yamazaki, R., Ioka, K., & Nakamura, T. 2004, ApJ, 607, L103
- Yoshida et al. (2007) Yoshida, M., et al. 2007a, GCN, 6050, 1
- Yoshida et al. (2007) Yoshida, M., et al. 2007b, GCN, 6193, 1
- Zeh et al. (2006) Zeh, A., Klose, S., & Kann, D. A. 2006, ApJ, 637, 889
- Zhang et al. (2004) Zhang, B., et al. 2004, ApJ, 601, L119
- Zhang & Mészáros (2004) Zhang, B. & Mészáros, P. 2004, International Journal of Modern Physics A, 19, 2385
| Burst | Observation | Days | Filter | Exposures | Mag |
|---|---|---|---|---|---|
| Time | After | (sec) | |||
| (UT) | Trigger | ||||
| GRB 070125 | 2007-02-21.10 | 26.80 | |||
| 2007-11-19.50 | 298.2 | ||||
| GRB 070311 | 2007-03-17.14 | 6.13 | |||
| 2007-03-20.13 | 9.05 | ||||
| GRB 070411 | 2007-04-15.15 | 3.30 | |||
| 2007-04-22.14 | 10.30 | ||||
| GRB 070412 | 2007-04-12.18 | 0.12 | |||
| 2007-04-20.31 | 8.20 | ||||
| GRB 070419A | 2007-04-23.15 | 3.70 | |||
| 2007-05-10.18 | 20.80 | ||||
| 2007-05-20.22 | 30.80 | ||||
| GRB 070518 | 2007-05-19.32 | 0.72 | |||
| 2007-05-20.31 | 1.71 | ||||
| 2007-05-22.21 | 3.60 |