Stellar contents and star formation in the young open cluster Stock 8
Abstract
We present CCD photometry of the young open cluster Stock 8 with the aim of studying its basic properties such as the amount of interstellar extinction, distance, age, stellar contents and initial mass function (IMF). We also studied the star formation scenario in this region. From optical data, the radius of the cluster is found to be ( pc) and the reddening within the cluster region varies from to 0.60 mag. The cluster is located at a distance of kpc. Using H slitless spectroscopy and 2MASS NIR data we identified H emission and NIR excess young stellar objects (YSOs), respectively. From their locations in the colour-magnitude diagrams, majority of them seem to have ages between 1 to 5 Myr. The spread in their ages indicate a possible non-coeval star formation in the cluster. Massive stars in the cluster region reveal an average age of 2 Myr. In the cluster region () the slope of the mass function (MF), , in the mass range can be represented by a power law having a slope of , which agrees well with Salpeter value (-1.35). In the mass range , the MF is also found to follow a power law with a shallower slope of indicating a break in the slope of the IMF at . The slope of the -band luminosity function for the cluster () is found to be , which is smaller than the average value ( 0.4) obtained for embedded star clusters.
A significant number of YSOs are distributed along a Nebulous Stream towards the east side of the cluster. A small cluster is embedded in the Nebulous Stream. The YSOs lying in the Nebulous Stream and in the embedded cluster are found to be younger than the stars in the cluster Stock 8. The radio continuum, MSX, IRAS mid- and far-infrared maps and the ratio of [S II]/H intensities indicate that the eastern region of Stock 8 is ionization bounded whereas the western region is density bounded. The morphology seems to indicate that the ionization/ shock front caused by the ionizing sources located in the Stock 8 region and westwards of Stock 8 has not reached the Nebulous Stream. It appears that star formation activity in the Nebulous Stream and embedded cluster may be independent from that of Stock 8.
keywords:
stars: formation stars: luminosity function, mass function stars: premainsequence open clusters and associations: individual: Stock 8.1 Introduction
The study of star formation process and stellar evolution constitute one of the basic problems in astrophysics. Since most of the stars tend to form in clusters or groups, star clusters are useful objects to study the star formation process. The initial mass function (IMF), defined as the distribution of stellar masses at the time of birth is one of the basic tools for understanding the formation and evolution of stellar systems. Star forming regions (SFRs) and young star clusters have proven to be the ideal laboratories for studying the form of IMF and its variation through space and time. Since the young clusters (age 10 Myr) are assumed to be less affected by dynamical evolution, their mass function (MF) can be considered as the IMF. However, a recent study by Kroupa (2007) argues that even in the youngest clusters, it is difficult to trace the IMF, as clusters evolve rapidly and therefore eject a fraction of their members even at a very young age.
There are many unsolved issues concerning the universality of the stellar IMF. The theoretical expectation is that the IMF of a cluster should depend on the location, size, metallicity, density of the star forming environment and other conditions such as temperature or pressure (Zinnecker 1986; Larson 1992; Price Podsiadlowski 1995). But, convincing evidence for variation in the stellar IMF has not yet been found observationally (Scalo 1998; Kroupa 2001, 2002). Massey et al. (1995) concluded that the slope of the IMF at the higher mass range is universal, with a value of = irrespective of the variations in metallicity. Luhman et al. (2000) also found no systematic variations in IMF of the nearby SFRs (such as Oph, IC 348, Trapezium) although there is a large difference in stellar densities. On the other hand Hillenbrand (1997) found a few SFRs with unusual IMFs.
The lack of strong evidence for IMF variations suggests that its fundamental form may be universal. Consequently, local conditions may not play any significant role in the star formation process. However, the influence of star formation history of young clusters on the form of IMF is still an open issue. High-mass stars have strong influence on their surroundings and can significantly affect the formation of low mass stars. Recently, a relatively large number of low mass stars have been detected in a few OB associations, e.g. Upper Scorpio, the and Ori regions (Preibisch & Zinnecker 1999, Dolan & Mathieu 2002). Since this realization, surveys have demonstrated that the IMFs must essentially be the same in all star forming regions. The apparent difference is due mainly to the inherent low percentage of high mass stars and the incomplete survey of low mass stars in high-mass star forming regions (e.g. Preibisch & Zinneker 1999, Hillenbrand 1997, Massey et al. 1995). Recently Parker & Goodwin (2007) have studied the origin of O-stars and their effect on low-mass star formation. Advancement in detectors along with various surveys such as the 2MASS, DENIS and available archived data from ISO and Spitzer space telescopes have permitted detailed studies of low-mass stellar population in regions of high mass star formation.
With the aim of understanding the star formation process and IMF in and around young star cluster regions containing OB stars, we selected young cluster Stock 8 located within the HII region of IC 417 (Sh2-234) in the Auriga constellation of the Perseus arm. No CCD photometric observations have been carried out for this region so far. Mayer & Macak (1971) have carried out photoelectric photometry of 11 bright stars in the region and reported a distance of 2.96 kpc for the cluster. Using the photographic study of stars brighter than V = 16 mag, Malysheva (1990) found cluster age as 12 Myr with an angular diameter of and a distance of 1.9 kpc.
The present study is an attempt to understand the structure, star formation history, pre-main-sequence (PMS) population and the form of IMF of Stock 8 using the CCD photometry data. In Sections 2 and 3, we describe the observations, data reductions and archived data used in the present work. Sections 4 to 8 describe various results. The star formation scenario in the IC 417 (Sh2-234) region is described in Sections 9 to 12. The results are summarized in Section 13.
2 OBSERVATIONS AND DATA REDUCTIONS
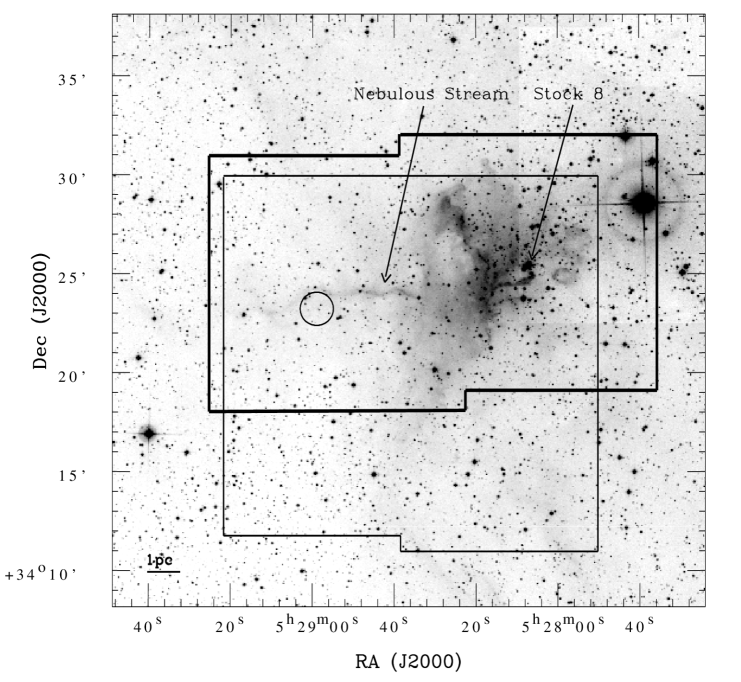
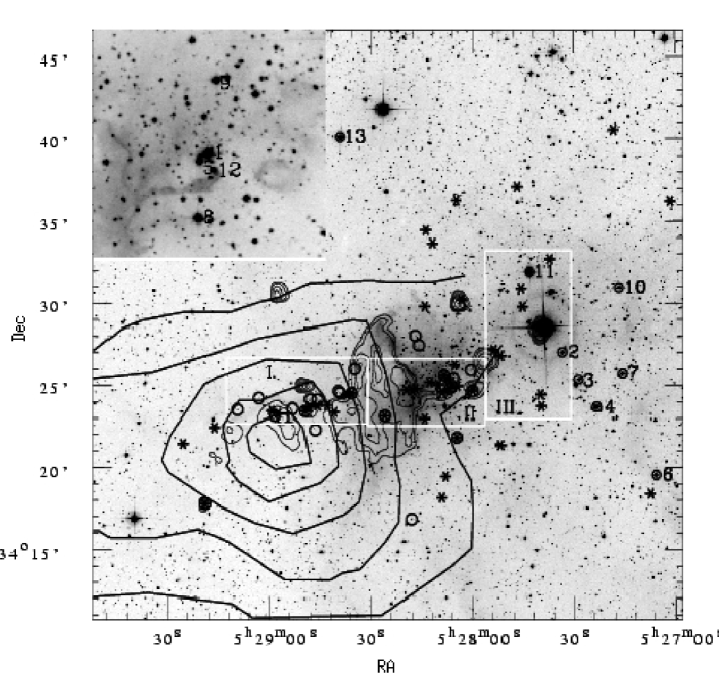
The arcmin2 ( pc2) area containing the central region of Stock 8, reproduced from the DSS2-R band image, is shown in Fig. 1. As evident from the figure, Stock 8 is embedded in an HII region. To the west of it, there are several OB stars which appear to form an OB association. To the east of Stock 8, we find a very peculiar chord-like nebulosity which we term as Nebulous Stream. A small cluster is also embedded within the Nebulous Stream. The small embedded cluster and the Nebulous Stream are discussed in Sections 9 and 11, respectively. We describe below the observations made to carry out a detailed study of the region.
2.1 Optical CCD Photometry
The CCD observations were carried out using the 2048 2048 pixel2 CCD camera on the 105-cm Schmidt telescope of the KISO Observatory, Japan on November 4, 2004. At the Schmidt focus (f/3.1) each pixel of 25 m corresponds to 1.5 arcsec and the entire chip covers a field of arcmin2 on the sky. The read-out noise and gain of the CCD are 23.2 and 3.4 , respectively. The FWHM of the star images was 3 arcsec. A number of bias and dome flat frames were also taken during the observing runs. We took short and long exposures in all the filters to avoid saturation of bright stars. SA 92 field of Landolt (1992) was observed to standardize the field on the same night. The log of observations is tabulated in Table 1.
| Date of | Filter | Exp. time | ||
|---|---|---|---|---|
| (h:m:s) | (d:m:s) | observation | (sec)no. of frames | |
| Kiso1 | ||||
| 05:28:07 | +34:25:42 | 2004.11.04 | 603, 1804 | |
| 05:28:07 | +34:25:42 | 2004.11.04 | 204, 604 | |
| 05:28:07 | +34:25:42 | 2004.11.04 | 104, 604 | |
| 05:28:07 | +34:25:42 | 2004.11.04 | 104, 604 | |
| ST2 | ||||
| 05:28:07 | +34:25:35 | 2006.09.29 | 52, 3003, 6004 | |
| 05:28:07 | +34:25:35 | 2006.09.29 | 53, 1205 | |
| 05:28:54 | +34:24:32 | 2006.09.29 | 52, 3003, 6004 | |
| 05:28:54 | +34:24:32 | 2006.09.29 | 53, 1205 | |
| 05:29:42 | +34:42:13 | 2006.09.29 | 52, 3003, 6004 | |
| 05:29:42 | +34:42:13 | 2006.09.29 | 53, 1205 | |
| HCT3 | ||||
| 05:28:14 | +34:24:52 | 2005.09.26 | H-Br | 602 |
| 05:28:14 | +34:24:52 | 2005.09.26 | Gr5/H-Br | 4203 |
| 05:28:14 | +34:15:55 | 2005.09.27 | H-Br | 603 |
| 05:28:14 | +34:15:55 | 2005.09.27 | Gr5/H-Br | 4203 |
| 05:28:56 | +34:16:43 | 2005.10.10 | H-Br | 603 |
| 05:28:56 | +34:16:43 | 2005.10.10 | Gr5/H-Br | 4203 |
| 05:28:32 | +34:29:55 | 2005.10.10 | H-Br | 603 |
| 05:28:32 | +34:29:55 | 2005.10.10 | Gr5/H-Br | 4203 |
| 05:28:07 | +34:25:35 | 2006.09.24 | H-Br | 4501 |
| 05:28:07 | +34:25:35 | 2006.09.24 | [S II] | 4501 |
| 05:28:07 | +34:25:35 | 2006.09.24 | 4501 | |
| 05:28:47 | +34:25:35 | 2006.09.24 | H-Br | 4501 |
| 05:28:47 | +34:25:35 | 2006.09.24 | [S II] | 4501 |
| 05:28:47 | +34:25:35 | 2006.09.24 | 4501 |
1 105-cm Schmidt Telescope, Kiso, Japan
2 104-cm Sampurnanand Telescope, ARIES, Naini Tal
3 2-m Himalayan Chandra Telescope, IAO, Hanle
The CCD frames were bias-subtracted and flat-field corrected in the
standard manner using various tasks available under IRAF111IRAF
is distributed by National Optical Astronomy Observatories,
USA. Aperture photometry was done for the standard stars of SA 92
field to estimate the atmospheric extinction and to calibrate the
field. Following calibration equations are derived using a
least-square linear regression:
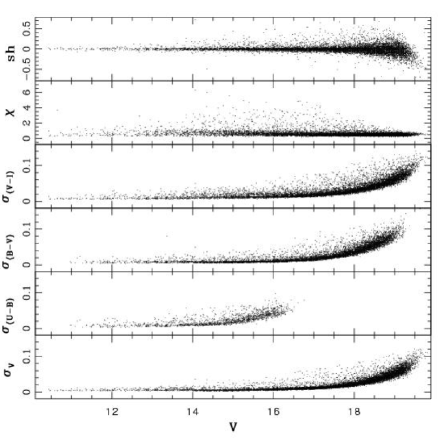
where are the instrument magnitudes corrected for the atmospheric extinctions and are the standard magnitudes. Fig. 2 shows the standardization residuals, , between standard and transformed magnitudes, , and colours of standard stars as a function of mag. The standard deviations in and are 0.021, 0.045, 0.023, 0.015 mag, respectively.
Different frames of cluster region of same exposure time and filters were averaged. Photometry of cleaned frames was carried out using the DAOPHOT-II (Stetson 1987) profile fitting software. The magnitudes of bright stars were taken from short exposure frames whereas that of faint stars were taken from deep exposures. Profile-fitting photometry gives the error in magnitude determination, the goodness of the fit parameter, , which is a measure of the average rms deviation to the PSF fit normalized to the expected errors. It also gives a shape parameter, Sharpness, which measures how well the PSF fits the object. The photometric errors in magnitude, colours and image parameters as a function of magnitude are shown in Fig. 3. These parameters were used to reject poor measurements.

Deep images of two central regions of the cluster and a nearby field ( = ; = ) were also obtained in and filters on September 29, 2006 using a 1024 1024 pixel2 CCD camera mounted at the f/13 Cassegrain focus of the 104-cm Sampurnanand Telescope (ST) of the Aryabhatta Research Institute of Observational sciencES (ARIES), Naini Tal, India. Log of the observations is given in Table 1. In this set up, each pixel of the CCD corresponds to arcsec and the entire chip covers a field of arcmin2 on the sky. To improve the signal to noise ratio, the observations were carried out in binning mode of pixels. The FWHM of the star images was arcsec. The observed region is marked by thick lines in Fig. 1. The secondary standards from the KISO observations were used to calibrate the data taken at ARIES. The typical DAOPHOT photometric errors at brighter end ( 15) are of the order of 0.01 mag, whereas the errors increase towards the fainter end ( 0.05 at 21). The combined photometric data of KISO Schmidt telescope and ST in an area of along with positions of the stars are given in a table, which is only available in electronic form as part of the online material from http://www.blackwell-synergy.com. Format of the table is shown in Table 2.
| star | ||||||
|---|---|---|---|---|---|---|
| no | (h:m:s) | (d:m:s) | ||||
| 1 | 05:27:48.31 | +34:21:26.6 | 11.210 | 0.032 | 0.746 | 0.724 |
| 2 | 05:28:01.22 | +34:27:00.7 | 11.498 | 0.129 | 0.174 | 0.281 |
| 3 | 05:27:43.61 | +34:21:24.8 | 11.271 | -0.481 | 0.417 | 0.617 |
| 4 | 05:28:50.26 | +34:19:23.2 | 11.507 | 0.015 | 0.174 | 0.298 |
| 5 | 05:28:04.46 | +34:29:20.8 | 11.710 | -0.474 | 0.298 | 0.494 |
To study the luminosity function (LF)/ MF it is necessary to take into account the incompleteness in the observed data that may occur for various reasons (e.g. crowding of the stars). A quantitative evaluation of the completeness of the photometric data with respect to the brightness and the position on a given frame is necessary to convert the observed luminosity function (LF) to a true LF. We used the ADDSTAR routine of DAOPHOT II to determine the completeness factor (CF). The procedure has been outlined in detail in our earlier work (Pandey et al. 2001). Briefly, we randomly added artificial stars to both and images in such a way that they have similar geometrical locations but differ in I brightness according to mean colour () of the data sample. The luminosity distribution of artificial stars is chosen in such a way that more stars are inserted towards the fainter magnitude bins. The frames are reduced using the same procedure used for the original frame. The ratio of the number of stars recovered to those added in each magnitude interval gives the CF as a function of magnitude. The minimum value of the CF of the pair (i.e. and band observations) for the two sub-regions, given in Table 3, is used to correct the data for incompleteness. The incompleteness of the data increases with increasing magnitude as expected, however it does not depend on the area significantly.
| V range | Stock8 | Field region | |
|---|---|---|---|
| (mag) | |||
| 10 - 11 | 1.00 | 1.00 | 1.00 |
| 11 - 12 | 1.00 | 1.00 | 1.00 |
| 13 - 14 | 1.00 | 1.00 | 1.00 |
| 14 - 15 | 1.00 | 1.00 | 1.00 |
| 15 - 16 | 1.00 | 1.00 | 1.00 |
| 16 - 17 | 0.98 | 0.97 | 0.98 |
| 17 - 18 | 0.95 | 0.95 | 0.97 |
| 18 - 19 | 0.93 | 0.93 | 0.96 |
| 19 - 20 | 0.88 | 0.90 | 0.92 |
| 20 - 21 | 0.88 | 0.86 | 0.86 |
| 21 - 22 | 0.74 | 0.75 | 0.76 |
2.2 Slitless Spectroscopy, H and [S II] imaging
The cluster was observed in slitless mode with grism as the dispersing element using the Himalaya Faint Object Spectrograph Camera (HFOSC) on the 2-m Himalayan Chandra Telescope (HCT) of Indian Astronomical Observatory (IAO), Hanle, India. The central pixels of CCD were used for data acquisition. The pixel size is 15 m with an image scale of .296/pixel and it covers an area of 1010 arcmin2 on the sky. A combination of H broad-band filter (H-Br; 6100 - 6740 Å) and Grism 5 were used without any slit. The resolution of Grism 5 is 870. The regions where slitless spectroscopic observations were carried out are identified with thin lines in Fig. 1. Emission-line stars with enhancement over the continuum at H wavelength are visually identified. Multiple frames were taken to confirm the presence of H emitting sources. Positions of the H emission stars are given in Table 4. H-Br and [S II] ( = 6724 Å, 100 Å) images of two central regions of the cluster were also acquired on September 24, 2006 using the HFOSC at the 2-m HCT. Log of the observations is given in Table 1.
| ID | V | ||||
|---|---|---|---|---|---|
| (h:m:s) | (d:m:s) | (mag) | (mag) | (mag) | |
| 1 | 05:28:04.65 | +34:21:51.0 | 15.642 | 0.961 | 1.205 |
| 2 | 05:28:00.00 | +34:24:40.5 | 19.522 | - | 1.728 |
| 3 | 05:28:00.45 | +34:25:57.8 | 18.493 | 1.594 | 2.030 |
| 4 | 05:28:06.09 | +34:24:55.4 | 18.084 | - | 1.460 |
| 5 | 05:28:06.90 | +34:24:49.6 | 14.800 | 0.970 | 1.285 |
| 6 | 05:28:05.72 | +34:25:28.1 | 17.108 | - | 1.778 |
| 7 | 05:28:08.65 | +34:25:38.9 | 16.700 | 1.218 | 1.812 |
| 8 | 05:28:16.07 | +34:27:28.8 | 18.284 | 1.379 | 2.125 |
| 9 | 05:28:17.12 | +34:28:04.1 | 15.565 | 1.249 | 1.568 |
| 10 | 05:28:25.90 | +34:23:10.2 | 16.467 | 0.852 | 1.161 |
| 11 | 05:28:35.83 | +34:24:32.8 | 15.267 | 1.256 | 1.694 |
| 12 | 05:28:18.22 | +34:16:52.7 | 16.486 | 1.144 | 1.337 |
| 13 | 05:28:34.91 | +34:26:01.9 | 20.352 | - | 2.240 |
| 14 | 05:28:39.38 | +34:24:33.2 | 18.892 | - | 1.980 |
| 15 | 05:28:39.85 | +34:24:39.3 | 19.423 | - | 1.848 |
| 16 | 05:28:46.04 | +34:24:07.5 | 21.147 | - | 2.419 |
| 17 | 05:28:48.08 | +34:24:09.6 | 17.777 | - | 1.423 |
| 18 | 05:28:46.68 | +34:22:18.9 | 19.751 | - | 1.828 |
| 19 | 05:28:49.55 | +34:23:26.8 | 17.658 | - | 2.248 |
| 20 | 05:28:53.23 | +34:23:35.2 | 19.581 | - | 2.587 |
| 21 | 05:28:56.05 | +34:23:00.3 | 16.876 | - | 1.955 |
| 22 | 05:28:58.48 | +34:23:10.2 | 18.579 | - | 2.439 |
| 23 | 05:29:03.31 | +34:24:13.6 | 19.792 | - | 2.576 |
| 24 | 05:29:09.69 | +34:23:32.2 | 18.000 | - | 2.287 |
| 25 | 05:29:19.14 | +34:17:47.1 | - | - |
3 archival data
Near-infrared (NIR) data for point sources within a radius of around Stock 8 have been obtained from the Two Micron All Sky Survey (2MASS) Point Source Catalogue (PSC) (Cutri et al. 2003). To improve the photometric accuracy, we used photometric quality flag (phqual = AAA) which gives a S/N 10 and a photometric uncertainty 0.10 mag. This selection criterian ensures best-quality detection in terms of photometry and astrometry (cf. Lee et al. 2005). The data were transformed from 2MASS system to CIT system using the relations given on the 2MASS web site222http://www.astro.caltech.edu/jmc/2mass/v3/transformations/.
The Midcourse Space experiment (MSX) surveyed the Galactic plane in four mid-infrared bands - A (m), C (m), D (m) and E (m) at a spatial resolution of (Price et al. 2001). Two of these bands (A and C) with corresponding to 8.28 m (3.36 m) and 12.13 m (1.71 m) include several polycyclic aromatic hydrocarbons (PAHs) features at 6.2, 7.7, 8.7, 11.3, and 12.7 m. MSX images in these four bands around the cluster region were used to study the emission from the PAHs.
The data from the IRAS survey around the cluster region in the four bands (12, 25, 60, 100 m) were HIRES processed (Aumann et al. 1990) to obtain high angular resolution maps. These maps were used to study the spatial distribution of dust colour temperature and optical depth.
4 Radial stellar surface density and cluster size
The radius of a cluster is one of the important parameters used to study the dynamical state of the cluster. We used star count technique to determine the statistical properties of clusters with respect to the surrounding stellar background, to study the surface density distribution of stars in the cluster region and to derive the radius of the cluster.
To determine the cluster center, we used the stellar density distribution of stars having mag in a 75 pixel wide strip along both X and Y directions around an eye estimated center. The point of maximum density obtained by fitting a Gaussian curve is considered as the center of the cluster. The coordinates of the cluster center are found to be = ; = . The 2MASS NIR data yields the cluster center away southwards of the optical center. However, this difference is within the uncertainty and therefore can be considered identical. Henceforth, we have used the optical center as the center of the cluster.
To investigate the radial structure of the cluster, we derived the radial density profile (RDP) using the Kiso Schmidt observations for stars brighter than = 18 mag by dividing star counts inside the concentric annuli of wide around the cluster center by the respective annulus area. The densities thus obtained are plotted as a function of radius in Fig. 4, where one arcmin at the distance of cluster (2.05 kpc, cf. Sec 6) corresponds to 0.6 pc. The upper and the lower panels show the RDPs obtained from optical and 2MASS NIR data respectively. The error bars are derived assuming that the number of stars in each annulus follows Poisson statistics.
The radius of the cluster is defined as the point where the cluster stellar density merges with the field stellar density. The contribution of the field stars has been estimated by counting stars in the annular region 16′ - 21′ from the cluster center. The horizontal dashed line in Fig. 4 shows the field star density. Optical RDP indicates a dip in stellar counts at .5, whereas this dip is absent in NIR RDP. The NIR RDP indicates an enhancement in stellar density at . To find out the cause of dip in the optical RDP and enhancement in stellar density in the NIR RDP, in Fig. 4, we also show RDPs for the eastern and western regions of Stock 8. The dip in the optical and enhancement in NIR RDP is visible only towards the western region of the cluster. A comparison of the RDPs with spatial distribution of , shown in Fig. 7, indicates that the dip in the optical RDP at .5 may be an artifact of relatively higher extinction around . The NIR observations can probe deeper in the embedded region, hence enhancement in stellar density in NIR RDP around may be due to embedded population. Since star formation activity in the Nebulous Stream, as discussed in Sec. 11, is found to be independent of the star formation activity in the cluster region, we used radius of the cluster as (as obtained from optical data) to study the properties of the cluster.
To parametrize the RDP, we fitted the observed RDP with the empirical model of King (1962) which is given by,
| (1) |
where is the core radius at which surface density becomes half of the central density, . The best fit to the observed RDPs, obtained by a minimization technique, is shown in Fig. 4. The core radii thus estimated from optical and NIR RDPs are and respectively.


5 Reddening in the cluster
The extinction in a star cluster arises due to two distinct sources: (1) the general ISM in the foreground of the cluster [], and (2) the localized cloud associated with the cluster [], where is the reddening of the star embedded in the parent cloud. The former component is characterized by the ratio of the total-to-selective extinction = 3.1 (Wegner 1993; He et al. 1995; Winkler 1997), whereas for the intracluster regions of young clusters embedded in dust and gas cloud the value of may vary significantly (Chini & Wargau 1990; Tapia et al. 1991; Hillenbrand et al. 1993; Pandey et al. 2000).
The ratio of total-to-selective extinction is an important quantity, that must be known, to get the dereddened magnitudes of the stars. Consequently, the value of affects the distance determination significantly. Several studies have already pointed out anomalous reddening law with high values in the vicinity of star forming regions (see. e.g. Neckel & Chini 1981, Chini & Krugel 1983, Chini & Wargau 1990, Hillenbrand et al. 1993, Pandey et al. 2000, Samal et al. 2007). Since the cluster is embedded in the parent molecular cloud, it will be useful to understand the reddening law in and around the Stock 8 region.
To study the nature of the extinction law in the cluster region, we used two - colour diagrams (TCDs) as described by Pandey et al. (2003). The TCDs of the form of () vs. (), where is one of the broad-band filters (), provide an effective method for separating the influence of the normal extinction produced by the diffuse interstellar medium from that of the abnormal extinction arising within regions having a peculiar distribution of dust sizes (cf. Chini & Wargau 1990, Pandey et al. 2000).
The TCDs for the region are shown in Fig. 5. The values in the cluster region are estimated using the procedure as described in Pandey et al. (2003). The slopes of the distributions (cf. Pandey et al. 2003) are found to be for vs. diagrams respectively. Identical values for the slopes are found for the region . The ratio of total-to-selective extinction in the cluster region, , is also derived using the procedure given by Pandey et al. (2003). The ratios yield which indicates a normal reddening law in the cluster region.
In the absence of spectroscopic observations, the interstellar extinction toward the cluster region can be estimated using the colour-colour (CC) diagram. The CC diagram of the cluster region () is presented in Fig. 6. Since the cluster is very young, a variable reddening is expected within the cluster region. The figure also indicates a large amount of contamination due to field stars. The probable foreground stars follow the intrinsic zero-age-main-sequence (ZAMS) by Girardi et al. (2002) reddened by =0.20 mag along a normal reddening vector (i.e., = 0.72). In Fig. 6, the continuous line represents the theoretical ZAMS which is shifted by = 0.40 and 0.60 mag respectively, along the normal reddening vector to match the observations of probable cluster members. Fig. 6 yields a variable reddening with = 0.40 mag to = 0.60 mag in the cluster region. A careful inspection of CC diagram indicates the presence of further reddened population. The theoretical ZAMS, shown by dot-dashed line, is further shifted to match the reddened sequence. This population may belong to blue plume (BP) of Norma-Cygnus arm (cf. Carraro et al. 2005, Pandey et al. 2006). The value for the background population comes out to be 0.70 mag, which is comparable to the value of BP population around (cf. Pandey et al. 2006).
Reddening of individual stars having spectral types earlier than have also been computed by means of the reddening free index (Johnson Morgan 1953). Assuming a normal reddening law we can construct a reddening-free parameter index . For the MS stars, the intrinsic colour and colour-excess can be obtained from the relation (Johnson 1966, Hillenbrand et al. 1993) and , respectively. The distribution of reddening as a function of radial distance from the cluster center is shown in Fig. 7, which indicates a slight enhancement of at . In Fig. 7 we also show variation of reddening towards eastern and western directions of the cluster. From the figure it can be noted that the reddening towards eastern region of the cluster is rather uniform whereas the reddening towards the western region of the cluster shows relatively higher value (although statistically weak) at .


6 Optical Colour Magnitude Diagrams
The optical colour- magnitude diagrams (CMDs) were used to derive the cluster fundamental parameters such as age, distance etc. The and CMDs of stars within radial distance of Stock 8 and CMD for the nearby field region are shown in Fig. 8. The contamination due to background field population is apparent in the CMDs of the cluster region. The CMDs of the cluster region also show a significant number of stars towards the right of the ZAMS. Stars brighter than 11.5 mag observed in B-band using Kiso Schmidt telescope are saturated even in frames with short exposure.

To study the LF/MF, it is necessary to remove field star contamination from the sample of stars in the cluster region. Membership determination is also crucial for assessing the presence of PMS stars because both PMS and dwarf foreground stars occupy similar positions above the ZAMS in the CMDs. In the absence of proper motion study, we used statistical criterion to estimate the number of probable member stars in the cluster region. To remove contamination of field stars from the MS and PMS sample, we statistically subtracted the contribution of field stars from the observed CMD of the cluster region using the following procedure. For any star in the CMD of the field region, the nearest star in the cluster’s CMD within and of the field star was removed. While removing stars from the cluster CMD, necessary corrections for incompleteness of the data sample were taken into account. The statistically cleaned CMD of the cluster region is shown in Fig. 8d which clearly shows a sequence towards red side of the MS. The contamination due to field stars at mag and mag can still be seen in Fig. 8d.


In Fig. 8, using mag and relations ; , we visually fitted theoretical isochrone of log age = 6.3 (2 Myr) and by Girardi et al. (2002) to the blue envelope of the observed MS. We estimated a distance modulus of mag which corresponds to a distance of kpc. Fig. 9 shows dereddened CMD of the stars lying within . The stars having spectral type earlier than were dereddened individually using the method as discussed in Section 5. Because bright stars in our observations got saturated even in short exposure frames, we obtained their B-band data from from Mayer & Macak (1971). The isochrone for 2 Myr by Girardi et al. (2002) are also plotted in the figure. This figure yields an average post-main-sequence age of the massive stars of the cluster as 2 Myr.
In Fig. 10 we have plotted CMD for the young stellar objects (YSOs) i.e. H emission and NIR excess sources (cf. Section 7.1) lying within regions and . The H sources are represented by open and filled triangles and the NIR excess sources by open and filled circles. The PMS isochrones by Siess et al. (2000) for 0.5, 5, 10 Myr (dashed lines) and isochrone for 2 Myr by Girardi et al. 2002 (continuous line) are also shown. Fig. 10 reveals that majority of the YSOs (i.e., H and NIR excess stars) have ages 5 Myr. The age spread may indicate a non-coeval star formation in the cluster. Fig. 10 also indicates a tendency that stars lying at are relatively younger than those in the cluster region.
In Fig. 11 we have shown statistically cleaned CMD along with PMS isochrones for ages 0.5 Myr and 10 Myr by Siess et al. (2000). The 2 Myr isochrone by Girardi et al. (2002) and evolutionary tracks by Siess et al. (2000) for different masses are also shown. A comparison of Figs. 10 and 11 suggests that the stars lying on the right side of the MS in Fig. 11 may be probable PMS stars. The stars lying between the 0.5 - 10 Myr isochrones are considered as PMS stars and this set of data is used for calculation of the IMF (see Sec. 8).
7 Near Infrared colour-colour and colour-magnitude diagrams
The NIR data are very useful to study the nature of young stellar population within the star forming regions. From 2MASS point source catalogue, we obtained data (with photometric errors 0.1 mag in all the three bands) for and NIR sources lying within and respectively. In the following Section, we discuss NIR colour-colour diagram and CMDs.
7.1 Colour-Colour Diagram

The colour-colour diagrams for the cluster region , outside the cluster region , and a nearby field region are shown in Fig. 12. The thin and thick solid lines are the locations of unreddened main-sequence and giant stars (Bessel Brett 1988), respectively. The dotted line represents the locus of T Tauri stars (Meyer et al. 1997). The parallel dashed lines are the reddening vectors for the early MS and giant type stars (drawn from the base and tip of the two branches). The crosses on the dashed lines are separated by an value of 5 mag. The extinction ratios, and , are adopted from Cohen et al. (1981). All the 2MASS magnitudes and colours have been converted into the CIT system. The curves are also in the CIT system.
Presently young stellar objects are classified as an evolutionary sequence spanning a few million years as: Class 0/ Class I - the youngest embedded protostars surrounded by infalling envelopes and growing accretion disk; Class II - PMS stars with less active accretion disks and Class III - PMS stars with no disks or optically thin remnant dust (Adams et al. 1987). Following Ojha et al. (2004a), we classified sources according to their locations in colour-colour diagrams. The ‘F’ sources are those located between the reddening vectors projected from the intrinsic colour of main-sequence and giant. These are considered to be field stars (main-sequence, giants) or Class III /Class II sources with small NIR excesses. The ‘T’ sources are located redward of ‘F’ but blueward of the reddening line projected from the red end of the T Tauri locus of Meyer et al. (1997). These sources are considered to be mostly classical T Tauri stars (Class II objects) with large NIR excesses. There may be an overlap in NIR colours of Herbig Ae/Be stars and T Tauri stars in the ‘T’ region (Hillenbrand et al. 1992). The ‘P’ sources are those located in the region redward of region ‘T’ and are most likely Class I objects (protostellar objects).
In Fig. 12, a significant number of stars show NIR excess indicating that the Stock 8 region is populated by YSOs. A comparison of the colour-colour diagrams of the cluster region with the field region (Fig. 12c) indicates that stars in the cluster region having 0.6 and lying towards the right side of the reddening vector at the boundary of ‘F’ and ‘T’ regions can be safely considered as NIR excess stars. This criterion yields 19 and 17 NIR excess sources in the Stock 8 () and outside the cluster ( ) regions, respectively, which are shown as open and filled circles in Fig. 12. Distribution of H emission stars is also shown as open () and filled ( ) triangles. Fig. 12 indicates that the YSOs located outside the cluster region have relatively higher extinction and NIR excess as compared to those located in the inner region. The distribution of NIR excess, , defined as horizontal displacement from the reddening vector at the boundary of ‘F’ and ‘T’ regions (cf. Fig. 12), for the two regions is shown in Fig. 13 which manifests that YSOs located in the region have relatively higher NIR excess.

7.2 Colour-Magnitude Diagrams
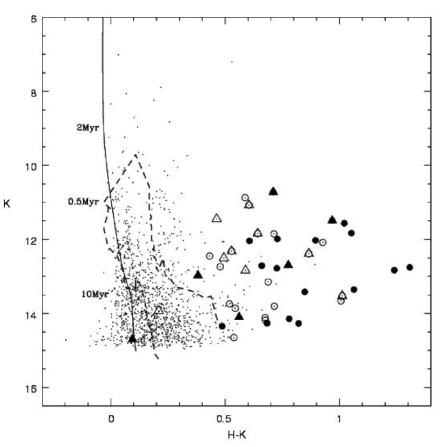

The and CMDs for the NIR excess and H sources detected within region are shown in Figs. 14 and 15. The isochrone for age 2 Myr by Girardi et al. (2002) and PMS isochrones for ages 0.5, 10 Myr by Siess et al. (2000) respectively, have been plotted assuming a distance of 2.05 kpc and an extinction of mag as obtained from the optical data. Fig. 14 also indicates that sources lying outside the cluster region i.e. have relatively higher NIR excess. Therefore, from Figs. 10, 12, 13 and 14, we infer that sources lying in the region may possibly be younger than those located in the cluster region ().
The mass of the probable YSO candidates can be estimated by comparing their locations on the CMD with the evolutionary models of PMS stars. To estimate the stellar masses, the luminosity is recommended rather than that of or , as the band is less affected by the emission from circumstellar material (Bertout et al. 1988). In Fig. 15, the continuous oblique reddening lines denote the positions of PMS stars of 0.5 Myr age having masses 0.1, 1.0 and 3.0 . The YSOs, in general, have masses in the range 0.1 to 3.0 .
8 Initial Mass Function
Young clusters are important tools to study the IMF since their MF can be considered as the IMF as they are too young to loose significant number of members either by dynamical or stellar evolution. To study the IMF of Stock 8 we used the data within .
The mass function (MF) is often expressed by the power law, and the slope of the MF is given as:
where is the number of stars per unit logarithmic mass interval. For the mass range , the classical value derived by Salpeter (1955) for the slope of IMF is .

With the help of statistically cleaned CMD shown in Fig. 11, we can derive the MF using theoretical evolutionary models. Since the post-main-sequence age of the cluster is 2 Myr, stars having mag have been considered to be on the main sequence. For the MS stars LF was converted to MF using the theoretical model by Girardi et al. (2002) (cf. Pandey et al. 2001, 2005). The MF for PMS stars was obtained by counting the number of stars in various mass bins (shown as evolutionary tracks in Fig. 11). Necessary corrections for incompleteness of the data sample were taken into account for each magnitude bin to calculate the MF. The MF of the cluster is plotted in Fig. 16. The slope of the mass function , in the mass range , can be represented by a power law having a slope of = , which agrees well with Salpeter value (-1.35). In the mass range , the mass function also follows a power law but with a shallower slope indicating a break in the slope of the MF at . The break in the power law has already been reported in the case of a few young clusters e.g. Trapezium and IC 348 (Muench et al. 2002, 2003). They showed a flattening in slope of the IMF at . Recently, in the case of young clusters NGC 1893 (Sharma et al. 2007) and Be 59 (Pandey et al. 2007), a break in the power law was reported at and , respectively. However, obtained for Stock 8 below is shallower than that obtained for NGC 1893 () and is steeper than that obtained for Be 59 (approximately flat). In the case of NGC 2362 the MF flattens at (Damiani et al. 2006) which is at a much higher mass than observed in some young clusters. Prinsinzano et al. (2005) found that the MF of young open cluster NGC 6530, in the mass range , can be represented by a power law having slope (). However the MF does not flatten below as in the case of some young clusters e.g. Trapezium, Taurus and IC 348, instead it decreases for masses lower than . Here it is worthwhile to mention that exclusion of the lowest mass bin in Fig. 16 will yield a shallower slope , although with large error, for masses below , which is comparable with the slope obtained by Muench et al. (2002, 2003) for Trapezium and IC 348 clusters. However a deeper photometry is required to study the nature of mass function of Stock 8 below .

The mass segregation, in the sense that massive stars being more centrally concentrated than the lower mass stars, has been reported in several LMC and Milky Way star clusters (see Chen et al. 2007; de Grijs et al. 2002 a, b, c; Fischer et al. 1998; Pandey et al. 1992, 2001, 2005). In the case of intermediate or old clusters, the mass segregation is mainly due to the effect of dynamical evolution. But in the case of young clusters the mass segregation may be the imprint of star formation process. To characterize the degree of mass segregation in Stock 8, we plotted cumulative distribution of stars as a function of distance from the cluster center in two mass groups as shown in Fig. 17. The left panel shows the distribution for mass groups (high mass group) and (low mass group), whereas the right panel shows the distribution for (high mass group) and (low mass group). The Kolmogorov-Smirnov test indicates that the left panel shows mass segregation at a confidence level of , whereas the right panel does not show any mass segregation. This indicates that mass segregation, although weak, is effective only towards the higher mass end. Since variation of reddening within the cluster is not significant (cf. Fig. 7), and incompleteness of the data does not depend on the radial distance (cf. Table 3), we believe that the mass segregation may be the imprint of star formation process.

The -band luminosity function (KLF) is a powerful tool to investigate the IMF of young embedded star clusters. During the last decade several studies have been carried out with the aim of determining the KLF of young open clusters (e.g. Lada & Lada 2003, Ojha et al. 2004b, Sanchawala et al. 2007). We have used 2MASS -band data to study the KLF in Stock 8 region. The completeness of the 2MASS data is obtained by using ADDSTAR routine as discussed in Sec. 2.1. The CFs obtained for two sub-regions are given in Table 5. The KLF in Stock 8 region is studied by using the Besançon Galactic model of stellar population synthesis (Robin et al. 2003) and stars from a nearby reference field to take into account foreground/background field star contamination (cf. Sharma et al. 2007). The reference field, also taken from 2MASS, is located at a radial distance of away from the cluster center. Star counts are predicted using the Besançon model towards the direction of the control field. An advantage of using this model is that we can simulate foreground ( kpc) and the background ( kpc) field star populations separately. The foreground population was simulated using the model with = 1.24 mag ( mag (cf. Section 5) and kpc. The background population ( kpc) was simulated with = 1.86 mag. Thus we determined the fraction of the contaminating stars (foreground + background) over the total model counts. This fraction was used to scale the nearby reference field and subsequently the star counts of the modified control field were subtracted from the KLF of the cluster to obtain the final corrected KLF. The scale factor in different magnitude bins was found to be in the range of 0.8 - 1.0 with a mean value of .
| K range | Stock8 | Field region | |
|---|---|---|---|
| (mag) | |||
| 10.0 - 10.5 | 1.00 | 1.00 | 1.00 |
| 10.5 - 11.0 | 1.00 | 1.00 | 1.00 |
| 11.0 - 11.5 | 1.00 | 1.00 | 0.98 |
| 11.5 - 12.0 | 1.00 | 1.00 | 0.97 |
| 12.0 - 12.5 | 0.95 | 0.96 | 0.91 |
| 12.5 - 13.0 | 0.99 | 1.00 | 0.96 |
| 13.0 - 13.5 | 0.94 | 0.94 | 0.97 |
| 13.5 - 14.0 | 0.96 | 0.96 | 0.97 |
The KLF is expressed by following power-law:
where is the number of stars per 0.5 magnitude bin and is the slope of the power law. The KLF for the cluster region shown in Fig. 18, yields a slope of , which is smaller than the average value of slopes () for young clusters (Lada et al. 1991; Lada & Lada 1995; Lada & Lada 2003). Smaller values of KLF slope () have been reported for various young embedded clusters (Megeath et al. 1996, Chen et al. 1997, Brandl et al. 1999, Ojha et al. 2004b, Leistra et al. 2005, Sanchawala et al. 2007, Pandey et al. 2007).
The KLF of Stock 8 is worth comparing with those of NGC 1893 and Be 59 since all the KLFs are obtained using a similar technique (NGC 1893, Sharma et al. 2007; Be59, Pandey et al. 2007). The slope () obtained for Stock 8 is in agreement with those obtained for NGC 1893 () and Be 59 ().
9 Embedded Cluster in the Nebulous Stream
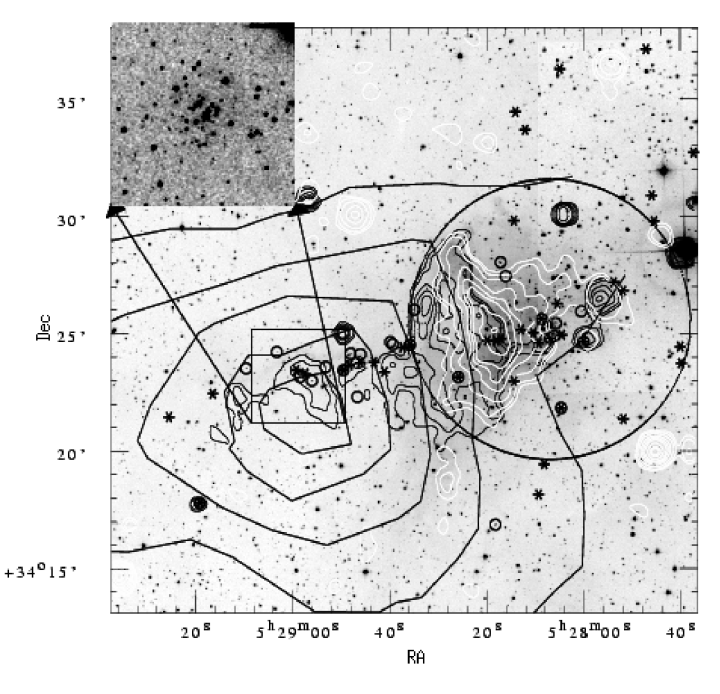
A Nebulous Stream, as identified in Fig. 1, is clearly seen towards the eastern region of the cluster, Stock 8. An embedded cluster, at a radial distance of from the center of Stock 8, can be noticed in the Nebulous Stream at = ; = . Its 2MASS band image together with the distribution of NIR excess stars and H emitters is shown in Fig. 19. Borissova et al. (2003) detected this cluster in their search for 2MASS PSC and designated it as CC 14. Recently, Ivanov et al. (2005) have studied CC 14 using deep NIR observations. They estimated a distance modulus mag, corresponding to a distance of kpc which indicates that CC 14 is not associated with the IC 417 region. However, the distribution of NIR-excess and H emission stars shown in Fig. 19 seems to indicate a physical relationship between CC 14 and the H II region IC 417, which is discussed later. In Fig. 20 we show the RDP for CC 14 obtained from the 2MASS data around the position mentioned above, which indeed manifests a clustering with a radius of .


In Fig. 21a we show colour-colour diagram for stars in CC 14 cluster as well as for the YSOs distributed along the Nebulous Stream. A comparison of Fig. 21a with Fig. 12 indicates that the stars having can be considered as probable YSOs associated with CC 14 and the Nebulous Stream. Assuming that the YSOs have average mass of (i.e. at 1 Myr), mean 18.5 mag and average 2.5 mag (cf. Fig. 21), we estimate a true distance modulus of 11.5, which clearly indicates that CC 14 and YSOs associated with the Nebulous Stream can not be located at the distance ( 21 kpc) suggested by Ivanov et al. (2005).
Of the 23 stars located within CC 14 region, the location of 10 stars (open circles) on the colour-colour diagram indicates that they may be probable field stars. The RDP (Fig. 20) for CC 14 also indicates the presence of 14 field stars in the region. Probable members of CC 14 are shown by filled circles in Fig. 21a. Figures 21b and 21c show and CMDs for the CC 14 region where open and filled circles represent field and probable cluster populations respectively. Comparison of CMD (Fig. 21b) with the field region CMD (Fig. 8c) clearly indicates that the field population (open circles) in the embedded cluster region belongs to the same population as that of the nearby field region. The probable cluster members (filled circles) follow 1 Myr isochrone. In Figs. 21a-c we have also plotted the NIR-excess and H emission stars lying along the Nebulous Stream using crosses and star symbols, respectively. The CMD indicates that the stars lying on the Nebulous Stream also have ages of 1 Myr.
10 Distribution of Gas and Dust around Stock 8
No detailed observations have been made so far, to probe the molecular cloud associated with Stock 8. Only available is the 12CO contour map of IC 417 (Sh2-234) region traced from figure 27c of Leisawitz et al. (1989), which is shown in Fig. 19. Although the resolution is low, a moderate-sized molecular cloud of is found adjacent to the east of Stock 8.
In Fig. 19, NVSS (1.4 GHz) radio contours (white) and MSX A-band MIR contours (black) are overlaid on DSS-2 band image. The radio continuum emission peaks around and and shows a sharp cutoff at indicating an interface between the ionized gas and molecular cloud. The integrated flux density of the radio continuum above level is estimated to be 2.474 Jy. Assuming a spherical symmetry for the ionized region and neglecting absorption of ultraviolet radiation by dust inside the H II region, the above flux density together with assumed distance, allow us to estimate the number of Lyman continuum photons () emitted per second, and hence the spectral type of the exciting star. Using the relation given by Martín-Hernández et al. (2003) and assuming an electron temperature of 8000 K, we estimated log, which corresponds to a MS spectral type of B0 (Panagia 1973; Schaerer & de Koter 1997). This seems to be consistent with the B0/O9.5 star (cf. Table 3, star no. 1), at the center of Stock 8, as the ionizing source of the region. Major uncertainty in the above calculation may arise due to neglect of the absorption of Lyman continuum photons by the dust. We estimated the effect of dust using the following two methods; 1) the dust continuum density was estimated by averaging FIR optical depth (shown in Fig. 25a) over the radio emission region, and 2) attributing the spread in in the cluster region (cf. Sec. 5) to the local dust distribution. In both the cases, we assumed a uniform dust distribution and the dust composition to be an equal mixture of Silicate and Graphite with properties identical to those given by Draine & Lee (1984). The calculation yields log 48.15 (from method 1) and 48.32 (from method 2) implying the ZAMS spectral type of the ionizing star to be O9/O8.5 and O8 from methods 1 and 2, respectively. Keeping in mind the uncertainties in estimating the spectral type of the star and the assumptions made to calculate the total number of Lyman continuum flux, we feel that the above estimates are comparable.
However star no. 1 is located almost at the western edge of the ionized gas, so roughly half of its UV emission may not be used in creating the HII region. The H II region IC 417 contains several OB stars (cf. Mayer & Macak, 1971), whose distribution is shown in Fig. 22. Presumably these stars are the first generation of stars in the IC 417 region. The details of the OB stars are given in Table 3. We suspect that the O8 and O9 stars (star Nos. 2 and 3, respectively), which jointly emit Lyman continuum photons of log = 48.78, also contribute to ionize the IC 417 HII region to a similar extent of that by B0/O9.5 star in Stock 8, although they are located relatively far away.
| Star | Spectral | References | |||
|---|---|---|---|---|---|
| no. | (h:m:s) | (d:m:s) | type | mag | |
| 1 | 05:28:07 | +34:25:27 | O9.5 V | - | Georgelin, et al., 1973 |
| B0 IV | 0.48 | Mayer & Macak, 1971 | |||
| 2 | 05:27:35 | +34:27:00 | O8 V | 1.25 | Mayer & Macak, 1971 |
| 3 | 05:27:29 | +34:25:03 | O9 IV-V | 0.98 | Mayer & Macak, 1971 |
| 4 | 05:27:23 | +34:23:41 | B0 V | 0.55 | Mayer & Macak, 1971 |
| 5 | 05:28:08 | +34:25:14 | B1 V | 0.46 | Mayer & Macak, 1971 |
| 6 | 05:27:06 | +34:19:32 | B0.5 V | 0.44 | Mayer & Macak, 1971 |
| 7 | 05:27:16 | +34:25:44 | B0.5 V | 0.45 | Mayer & Macak, 1971 |
| 8 | 05:28:08 | +34:23:45 | B0.5 V | 0.47 | Mayer & Macak, 1971 |
| 9 | 05:28:06 | +34:27:22 | B1.5 V | 0.52 | Mayer & Macak, 1971 |
| 10 | 05:27:17 | +34:30:57 | B2 V | 0.54 | Mayer & Macak, 1971 |
| 11 | 05:27:43 | +34:31:56 | B0.5 IV | 0.60 | Savage, 1985 |
| 12 | 05:28:06 | +34:25:00 | B1 V | 0.45 | Mayer & Macak, 1971 |
| 13 | 05:28:39 | +34:40:09 | O8 V | 0.57 | Savage, 1985 |
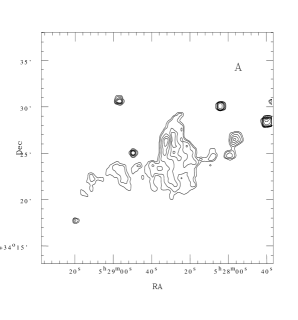
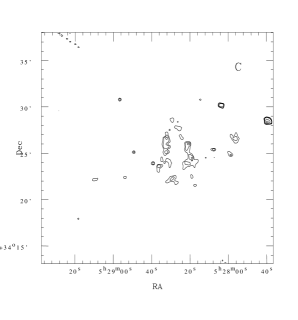

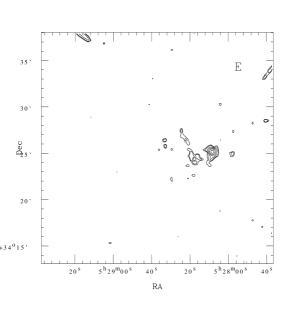
The emission from MSX A-band is completely absent from the inner region () as well as from the western region of Stock 8. It is stronger and more extended towards the eastern side of the cluster and then protrudes further to the east, nicely following the Nebulous Stream and showing a slight enhancement around CC 14. This further supports the physical connection between the H II region and the Nebulous Stream/CC 14. We show the MSX A, C, D and E-band contour maps of the Stock 8 region in Fig. 23. The contours of the MSX A and C-bands show an elliptical ridge around , . The eastward contours seen in A (8 m) and C (12 m) bands lie beyond the ionization front and get diluted as we move towards D (15 m) and E (21 m) bands, whereas the emission towards the west remains present in all the four bands. The emission in the MIR bands traces presence of warm small dust grains. The bands A and C also include several PAH features as described in Sec. 3. The morphology of the emission shown in Fig. 23 suggests that the westward emission may be due to warm small dust grains, whereas eastward emission in A and C bands may be due to PAHs because PAHs cannot survive in ionized regions as the hard radiation field within HII regions destroys them (Cesarsky et al. 1996).
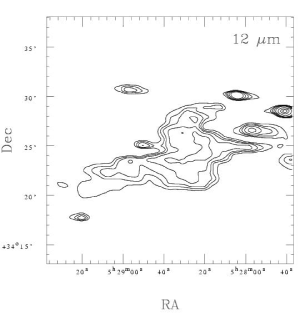
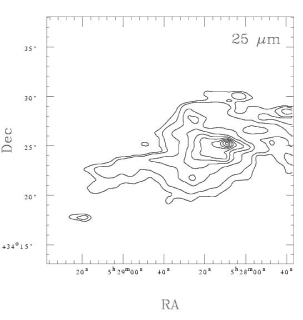
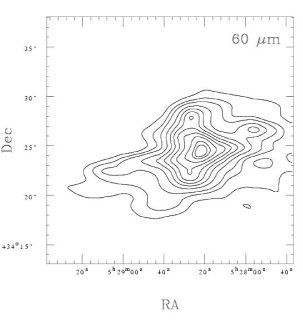
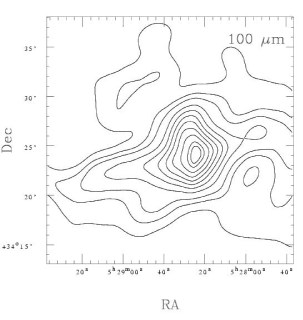
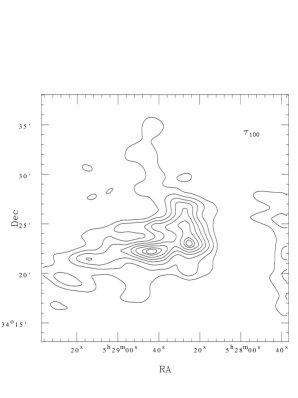
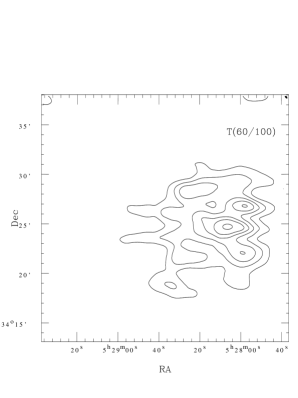
In Fig. 24 we show IRAS-HIRES intensity maps for the cluster region at m, m, m and m. The emission at FIR (m and m) peaks at ; , whereas at MIR (m) the emission peaks at ; . The peaks of FIR and MIR emissions are 2′ away from the peak of the radio continuum emission, which indicates an interaction between the gas and dust around the region. IRAS-HIRES maps at 60 and m were also used to generate the spatial distribution of dust colour temperature (T(60/100)) and optical depth maps at 100 m () using the procedure given by Ghosh et al. (1993). An emissivity law of was assumed to generate the optical depth map. Fig. 25 presents the contour maps of dust colour temperature () and optical depth (). The dust colour temperature varies from 34 to 48 as can be inferred from the map shown in Fig. 25. The relatively high temperature around the cluster may probably be due to the radiation from massive star(s) in the region. The map represents low optical depth around the position of Stock 8, whereas its peak matches well with the CO peak and the position of CC 14.
11 Nature of the Nebulous Stream
What is the nature of the Nebulous Stream? At first impression it appears like a giant Herbig-Haro jet and reminds us of HH 399 in Trifid Nebula (Yusef-Zadeh et al. 2005). However this does not seem to be the case. Fig. 19 reveals that it is closely associated with the distribution of the MSX A-band emission, as well as the distribution of H emission stars and IR-excess stars. The cluster CC 14 is also embedded within the Nebulous Stream. We therefore interpret the Nebulous Stream as a bright rim or an ionization front.


Fig. 26 shows continuum-subtracted H and [S II] images for the region along with contours for MSX A-band emission and radio continuum superimposed on the [S II] image. The gap seen at the middle of Fig. 26 is because the field was observed in two frames without an overlap. The H emission is more extended compared to the [S II] emission. The [S II] emission comes from low-excitation zones and is enhanced close to the ionization fronts (cf. Deharveng et al. 2003). Therefore the spatial distribution of the [S II]/H ratio should give information on the excitation conditions. The variation of the [S II]/H ratio along a .5 wide strip (indicated by black dashed lines in Fig. 26) as a function of radial distance from Stock 8 is shown in Fig. 27. To improve the signal-to-noise ratio and to remove faint stars, the images were median filtered using a 3 3 pixel box. A background was then determined for these smoothed images by calculating the statistics inside a 33 pixel box at various places where the H and [S II] brightness is at a minimum. The average background value was then subtracted from each pixel. As can be seen in Fig. 27 the ratio of [S II]/H is higher eastwards of the cluster Stock 8. Note that the values in the eastern most region are not reliable because the error bars are very large. Mean value of the [S II]/H ratio for the central region of Stock 8 is 0.180.06, which is consistent with the ratio expected for an H II region associated with a late O-B0 type star (Reynolds 1988). Whereas in the region between and 12 ′ the mean value of the ratio is higher, 0.24. This indicates that the Nebulous Stream is a low-excitation object suggestive of its bright-rim/ ionization front nature.
The question then arises; where is(are) the source(s) of its excitation? The O9.5/ B0 stars of Stock 8 or O8/ O9 stars further west do not seem to be the possible source because the morphology of the radio and MSX A-band emissions indicates an interface at and suggests that the ionization front has not reached the Nebulous Stream. UV radiation from the west of the Stream is most probably blocked by the molecular gas located at the interface at . In addition, the Stream runs in the east-west direction, which suggests that the UV photons responsible for the Stream should arrive from the north. In a search towards the north of the Stream, we find an O8 star (star number 13 at , distance 2.06 kpc: Cruz-Gonzalez et al. 1974; 2.7 kpc: Savage, 1985) located at a projected distance of 9 pc from the Nebulous Stream. We suspect that this star could be the possible source of UV photons which excite the Stream.
In order to verify whether this star emits enough UV photons to generate the bright rim, we calculated the flux of Lyman continuum photons which are expected to arrive at the location of the bright rim. The flux associated with an O8 star is taken from Panagia (1973). We assumed in our calculations, that loss of photons due to absorption by interstellar matter between the star and bright rim is negligible. Using a projected distance of 9 pc between the star and the bright rim, the Lyman photon flux at the bright rim is estimated to be . The Lyman photon flux reaching a radial distance of 3.6 pc) from B0 star is . The estimated flux of in the case of O8 star is comparable to the ionizing flux associated with the bright rimmed clouds (see Thompson et al. 2004, Morgan et al. 2004) which supports an O8 star as responsible for the Nebulous Stream.
12 Star formation scenario in the vicinity of Stock 8
The energetic stellar UV radiation and winds from massive stars could disperse nearby clouds and consequently terminate further star formation. Alternatively, they can enhance star formation activity in the region. Elmegreen & Lada (1977) proposed that after formation of massive stars, the expanding ionization fronts play a constructive role in inducing a sequence of star-formation activities in the neighbourhood. The distribution of visible young stars and embedded YSOs and the morphological details of the environment around the cluster containing OB stars can be used to probe the star formation history of the region.

In addition to the 12CO contours and the locations of OB stars, Fig. 22 also shows spatial distribution of NIR-excess sources and H emission stars. In Fig. 28 we plot NIR excess, , for three sub-regions (regions I, II and III) shown in Fig. 22 as a function of radial distance from the center of the cluster Stock 8. Fig. 28 indicates that the stars lying in regions I and III show relatively higher NIR excess. This trend in NIR excess may be an indication of the youth of YSOs located in regions I and III as compared to those located near the center of Stock 8. To verify further the age sequence, we plot and CMDs for the three sub-regions in Fig. 29, which also suggests that the YSOs in regions I and III are relatively younger than those located near the cluster center.


As mentioned earlier, several OB stars are located around the cluster Stock 8. We suspect that these sources belong to the first generation of stars formed in the IC 417 region, although the evidence is rather weak because of their scattered distribution. The age of the early-type stars in Stock 8 is estimated to be 2 Myr, whereas the YSOs in the Stock 8 region indicate an average age of 3 Myr (see Figs. 10 and 29). However these two age estimates probe different physical mechanisms, viz., the former being a nuclear age and the latter a contraction age. So, we conclude that they are practically in agreement. We suspect that the formation of stars in Stock 8 region was triggered by the first-generation stars mentioned above. The UV radiation from the OB stars, in particular the O8/O9 stars (star numbers 2 and 3 of Table 3), seem to have swept the pre-existing molecular cloud towards east of these stars. It formed a compressed gas layer which became unstable against self-gravity and collapsed to form second generation stars in the form of Stock 8 and surrounding YSOs in the region II. The shock/ionization front seems to be moving further to the east into the low density gas and accumulating a denser layer of molecular gas, which we now observe as a hole in the MSX A-band emission region.
The younger age of the YSOs scattered in region III is very strange. We suspect that they recently formed in scattered remnant clouds as seen in the Orion region (Ogura & Sugitani 1998). A hint of the presence of such remnant clouds is noticed in the inset of Fig. 22. In this sense they may well be considered as stars of the third generation in the Stock 8 region.
The narrow strip along the Nebulous Stream appears to be another active region (region I) of recent star formation. Fig. 22 shows that a few NIR-excess sources (11 stars) and H stars (13 stars) are distributed along the Nebulous Stream which also contains the CC 14 cluster. The peaks of 12CO and MSX A-band contours along the Nebulous Stream almost coincide with the location of the embedded cluster. As we have discussed above, these stars show an average age of 1 Myr. The question is whether the star formation here has been triggered by the UV radiation from the O/B star in Stock 8 or from the O stars located further west. This is unlikely, because, as we have discussed in Sec. 10, the action of the UV radiation from these stars does not seem to reach this region. The morphology of the Nebulous Stream as well as the slightly-displaced distribution of the YSOs and CC 14 to the south with respect to the Stream suggest that the pre-existing molecular gas might have been compressed by the shock front associated with the ionization front caused by the O8 star located northwards of the Stream (cf. Section 11). So, the star formation activity along the Nebulous Stream is probably independent of that in the Stock 8 region.
13 Summary
On the basis of a comprehensive multi-wavelength study of the IC 417 (Sh2-234) region we have made an attempt to determine the basic properties of the cluster Stock 8 as well as to study the star formation scenario in the region. Deep optical and narrow-band [S II], H photometric data, slitless spectroscopy along with archival data from the surveys such as 2MASS, MSX, IRAS and NVSS are used to understand the star formation in and around the cluster Stock 8.
Reddening () in the direction of the cluster is found to be varying between 0.40 to 0.60 mag. The post-main-sequence age and distance of the cluster are found to be Myr and 2.05 kpc respectively. Using 2MASS NIR two-colour diagram and grism survey for H emission stars, we identified candidate YSOs. A significant number of YSOs (22 stars) are aligned along a Nebulous Stream eastwards of the cluster and an embedded cluster is located along the Stream at a distance of 13 arcmin (7.8 pc) from the center of Stock 8. The mass of the YSOs lie in the range of 0.1 - 3.0 . The position of YSOs on the CMDs indicates that the majority of these stars in cluster Stock 8 have ages 1 to 5 Myr indicating star formation in the cluster may be non-coeval.
The embedded cluster in the Nebulous Stream is found to be physically connected to the H II region. The YSOs located in the Nebulous Stream, embedded cluster and in the western region of Stock 8 have larger excess in comparison to those located in the central region of Stock 8. The excess, and CMDs indicate that these YSOs are younger than those located in the central region of Stock 8. The radio continuum, MSX, IRAS maps and the ratio of [S II]/H intensities indicate that the eastern region of the cluster is ionization bounded, whereas, the western region of the Stock 8 is density bounded. The morphology of radio emission and MSX A-band emission suggests that ionization/ shock front caused by the central ionization source of Stock 8 and by O type stars located in the western region of Stock 8, has not reached the Nebulous Stream. An O8 star located 9 pc away towards the north of the Nebulous Stream may be a probable source of the bright-rimmed Nebulous Stream.
The slope of the mass function in the mass range can be represented by , which agrees well with Salpeter value (-1.35). In the mass range the mass function is found to be shallower with indicating a break in the slope of the MF at . The slope of the -band luminosity function for the cluster is found to be which is smaller than the average value ( 0.4) obtained for young star clusters (Lada et al. 1991; Lada & Lada 1995; Lada & Lada 2003).
14 Acknowledgments
Authors are thankful to the referee Dr. R. de Grijs for useful comments which improved contents and presentation of the paper. The observations reported in this paper were obtained using the 1.05-m Kiso Schmidt, 2-m HCT at IAO, Hanle, the high altitude station of Indian Institute of Astrophysics, Bangalore and 1.04-m Sampurnanad telescope of ARIES. We are also thankful to the Kiso Observatory, IAO and ARIES for alloting observation time. We thank the staff at Kiso Observatory (Japan), IAO, Hanle and its remote control station at CREST, Hosakote and ARIES (Naini Tal) for their assistance during observations. This publication makes use of data from the Two Micron All Sky Survey, which is a joint project of the University of Massachusetts and the Infrared Processing and Analysis Center/California Institute of Technology, funded by the National Aeronautics and Space Administration and the National Science Foundation. We also used MSX data for which we have used the NASA/IPAC Infrared Science Archive. We thank IPAC Caltech, for providing us the HIRES-processed IRAS maps. This study is a part of the DST (India) sponsored project and JJ is thankful to DST for the support. AKP is thankful to the National Central University, Taiwan and TIFR, Mumbai, India for the financial support during his visit to NCU and TIFR respectively. AKP and KO acknowledge the support given by DST and JSPS (Japan) to carry out the CCD photometry around open clusters.
REFERENCES
Adams F. C., Lada C. J., Shu F. H., 1987, ApJ, 312, 788
Aumann, H. H., Fowler, J. W., & Melnyk, M., 1990, AJ, 99, 1674
Bertout, C., Basri, G., & Bouvier, J., 1988, ApJ, 330, 350
Bessell, M. S., & Brett, J. M., 1988, PASP, 100, 1134
Borissova, J., Pessev, P., Ivanov, V.D., Saviane, I., Kurtev, R., Ivanov G.R., 2003, A&A, 411, 83
Brandl, B., Brandner, W.,& Eisenhauer, F., 1999, A&A, 352, L69
Carraro G., Vzquez R. A., Moitinho A., Baume G., 2005, ApJ, 630, L153
Cesarsky, D., Lequeux, J., Abergel, A., Perault, M., Palazzi, E., et al., 1996, A&A, 315, L305
Chen, H., Tafalla, M., & Greene, T. P., 1997, ApJ, 475, 163
Chen L., de Grijs R., Zhao J. L., 2007, AJ, 134, 1368
Chini, R. & Krugel, 1983, AA, 117, 289
Chini, R., & Wargau, W. F., 1990, A&A, 227, 213
Cohen, J. G., Frogel, J. A., Persson, S. E., & Ellias, J. H., 1981, ApJ, 249, 481
Cruz-González, C., Recillas-Cruz, E., Costero, R., Peimbert, M., & Torres-Peimbeert, S., 1974, RMxAA, 1, 211
Cutri R.M., Skrutskie M.F., Van Dyk S., et al., 2003, 2MASS All-Sky Catalog of Point Sources
Damiani, F., Micela, G., Sciortino, S., Huélamo, N., Moitinho, A., et al.,A&A, 460, 133
de Grijs R., Gilmore G. F., Johnson R. A., Mackey A. D., 2002a, MNRAS, 331, 228
de Grijs, R., Gilmore, G. F., Johnson, R. A., & Mackey, A. D., 2002b, MNRAS, 331, 245
de Grijs R., Gilmore G. F., Mackey A. D., Wilkinson M. I., Beaulieu S. F.,et al., 2002c, MNRAS, 337, 597
Deharveng, L., Zavagno, A., Salas, L., Porras, A., Caplan, J. & Cruz-Gonzalez, I, 2003, A&A, 399, 1135
Dolan, C. J., & Mathieu, R. D., 2002, AJ, 123, 387
Draine, B. T.& Lee, H. M., 1984, ApJ, 285, 89
Elmegreen, B. G. & Lada, C. J., 1977, ApJ, 214, 725
Fischer, P., Pryor, C., Murray, S., Mateo, M. & Richtler, T., 1998, AJ, 115, 592
Ghosh S. K., Verma R. P., Rengarajan T. N., Das B., Saraiya H. T., 1993, ApJS, 86, 401
Girardi, L., Bertelli, G., Bressan, A., Chiosi, C., Groenewegen, M. A. T., et al., 2002, A&A, 391, 195
He, L., Whittet, D. C. B., Kilkenny, D., Spencer Jones, J. H., 1995, ApJS, 101, 335
Hillenbrand, L. A., Strom, S. E., Vrba, F. J. & Keene, J., 1992, ApJ, 397, 613
Hillenbrand, L. A., Massey, P., Strom, S. E., Merrill, K. M., 1993, AJ, 106, 1906
Hillenbrand, L. A., 1997, AJ, 113, 1733
Ivanov, V. D., Borissova, J., Bresolin, F. & Pessev, P., 2005, A&A, 435, 107
Johnson, H. L. & Morgan, W. W., 1953, ApJ, 117, 313
Johnson, H. L., 1966, ARA&A, 4, 193
King, I., 1962, AJ, 67, 471
Kroupa, P., 2001, MNRAS, 322, 231
Kroupa, P., 2002, Science, 295, 82
Kroupa, P., 2007, astro-ph 0708.1164
Lada, E. A., Evans, N. J., Depoy, D. L. & Gatley, I., 1991, ApJ, 371, 171
Lada, E . A . & Lada, C . J., 1995, AJ , 109, 1682
Lada, C. J. & Lada E. A., 2003, ARA&A, 41, 57
Lada, C. J., Muench, A. A., Rathborne, J. M., Alves, J. F., Lombardi, M., 2007, ApJ (in press), astro-ph 0709.1164
Landolt A.U., 1992, AJ, 104, 340
Larson, R. B., 1992, MNRAS, 256, 641
Lee, H. T., Chen, W. P., Zhang, Z. W., Hu, J.Y., 2005, ApJ, 624,808
Leisawitz, D., Bash, F. N. & Thaddeus, P., 1989, ApJS, 70, 731
Leistra, A., Cotera, A. S., Leibert, J., & Burton, M., 2005, AJ, 130, 1719
Luhman, K. L., Rieke, G. H., Young, E. T., Cotera, A. S., Chen, H., et al., 2000, ApJ, 540, 1016
Malysheva, L. K., 1990, Sov.Astron., 34, 122
Martín-Hernández, N. L., van der Hulst, J. M., & Tielens, A. G. G. M. 2003, A&A, 407, 957
Massey, P., Johnson, K. E., & Degio-Eastwood, K., 1995, ApJ, 454, 151
Mayer, P., & Macak, P., 1971, Bull. Astron. Czech., 22, 46
Megeath, S. T., Herter, T., Beichman, C., Gautier, N., Hester, J. J., et al., 1996, A&A, 307, 775
Meyer, M., Calvet, N., & Hillenbrand, L. A., 1997, AJ, 114, 288
Morgan, L. K., Thompson, M. A., Urquhart, J. S., White, G. J., Miao, J., 2004, 426, 535
Muench, A. A., Lada, E. A., & Lada, C. J., et al., 2002, ApJ, 573, 366
Muench, A. A., Lada, E. A., Lada, C. J., et al., 2003, AJ, 125, 2029
Neckel, Th. & Chini, R., 1981, A&AS, 45, 451
Ogura, K., & Sugitani, K., 1998, Publ. Astron. Soc. Australia, 15, 91
Ojha, D. K., Tamura, M., Nakijama, Y., et al., 2004b, ApJ, 608, 797
Ojha, D. K., Tamura, M., Nakajima, Y., et al., 2004b, ApJ, 616, 1042
Panagia, N., 1973, AJ, 78, 929
Pandey, A.K., Mahra H.S., & Sagar R., 1992, BASI, 20, 287
Pandey, A. K., Ogura, K., & Sekiguchi, K., 2000, PASJ, 52, 847
Pandey A.K., Nilakshi, Ogura K., Sagar R., & Tarusawa K., 2001, A&A, 374, 504
Pandey, A. K., Upadhyay, K., Nakada, Y., & Ogura, K., 2003, A&A, 397, 191
Pandey, A. K., Upadhyay, K., Ogura, K., Sagar, R., Mohan, V., et al., 2005, MNRAS, 358, 1290
Pandey A. K., Sharma S., Ogura K., 2006, MNRAS, 373, 255
Pandey, A. K., Sharma, S., Ogura, K., Ojha, D. K., Chen, W. P., et al., 2007, MNRAS, (arXiv:0710.5429)
Parker, R. J. & Goodwin, S. P., 2007, MNRAS (in pres), astro-ph 0707.0605
Preibisch, T., & Zinnecker, H., 1999, AJ, 117, 2381
Price, N. M., & Podsiadlowski, Ph., 1995, MNRAS, 273, 1041
Price, S. D., Egan, M. P., Carey, S. J., Mizuno, D. R., & Kuchar, T. A., 2001, AJ, 121, 2819
Prisinzano, L., Damiani, F., Micela, G., Sciortino, S., 2005, A&A, 430, 941
Reynolds, R. J., 1988, ApJ, 333, 341
Robin, A. C., Reyle, C., Derriere, S., & Picaud, S., 2003, A&A, 409, 523
Salpeter, E.E., 1955, ApJ, 121, 161
Samal, M. R., Pandey, A. K., Ojha, D. K., Ghosh, S. K., Kulkarni, V. K., Bhatt, B. C.,ApJ (in press) astro-ph 0708.4137
Sanchawala, K., Chen, W.P., Ojha, D.K, Ghosh, S.K., Nakajima, Y., et al., 2007, arXiv:0706.1834S
Savage, B. D., Massa, D., Meade, M., & Wesselius, P. R. 1985, ApJS, 59, 397
Scalo, J. 1998, in ASP Conf. Ser. 142, The Stellar Initial Mass Function, ed.
G. Gilmore & D. Howell (San Francisco: ASP), 201
Schaerer, D., & de Koter, A. 1997, A&A, 322, 598
Sharma, S., Pandey, A. K., Ojha, D. K., Chen, W. P., Ghosh, S. K., Bhatt, B. C., Maheswar, G., Sagar, Ram, 2007, MNRAS, 380, 1141
Siess, L., Dufour, E. & Forestini, M., 2000, A&A, 358, 593
Stetson, P. B., 1987, PASP, 99, 191
Tapia, M., Roth, M., Costero, R., Echevarria, J., & Roth, M., 1991, MNRAS, 253, 649
Thompson, M. A., Urquhart, J. S., White, G. J., 2004, A&A, 415, 627
Wegner, W. 1993, A&A, 43, 209
Winkler, H. 1997, MNRAS, 287, 481
Yusef-Zadeh, F., Biretta, J., & Wardle, M. 2005, ApJ, 624, 246
Zinnecker, H., 1986., IMF in starburst regions. In light on Dark Matter, ed. F.P.Israel, ApSS Library Vol. 124, pp.277-278