Band profiles and band strengths in mixed H2O:CO ices
Abstract
Context. Laboratory spectroscopic research plays a key role in the identification and analysis of interstellar ices and their structure. To date, a number of molecules have been positively identified in interstellar ices, either as pure, mixed or layered ice structures.
Aims. Previous laboratory studies on H2O:CO ices have employed a ‘mix and match’ principle and describe qualitatively how absorption bands behave for different physical conditions. The aim of this study is to quantitatively characterize the absorption bands of solid CO and H2O, both pure and in their binary mixtures, as a function of partner concentration and temperature.
Methods. Laboratory measurements based on Fourier transform infrared transmission spectroscopy are performed on binary mixtures of H2O and CO ranging from 1:4 to 4:1.
Results. A quantitative analysis of the band profiles and band strengths of H2O in CO ice, and vice versa, is presented and interpreted in terms of two models. The results show that a mutual interaction takes place between the two species in the solid, which alters the band positions and band strengths. It is found that the band strengths of the H2O bulk stretch, bending and libration vibrational bands decrease linearly by a factor of up to 2 when the CO concentration is increased from 0 to 80%. By contrast, the band strength of the free OH stretch increases linearly. The results are compared to a recently performed quantitative study on H2O:CO2 ice mixtures. It is shown that for mixing ratios of 1:0.5 H2O:X and higher, the H2O bending mode offers a good tracer to distinguish between CO2 or CO in H2O ice. Additionally, it is found that the band strength of the CO fundamental remains constant when the water concentration is increased in the ice. The integrated absorbance of the 2152 cm-1 CO feature, with respect to the total integrated CO absorption feature, is found to be a good indicator of the degree of mixing of CO in the H2O:CO laboratory ice system. From the change in the H2O absorption band strength in laboratory ices upon mixing we conclude that astronomical water ice column densities on various lines of sight can be underestimated by up to 25% if significant amounts of CO and CO2 are mixed in.
Key Words.:
Astrochemistry, Line: profiles, Molecular data, Molecular processes, Methods: laboratory infrared, ISM: molecules, Infrared: Band strength, ISM, Spectroscopy: Solid State1 Introduction
Water and carbon monoxide are common constituents in vast regions of space, both in the gas phase and in ices. Interstellar water ice was first identified in 1973 via a strong band at 3.05 m and unambiguously assigned to water ice following comprehensive laboratory work (Merrill et al. 1976; Léger et al. 1979; Hagen et al. 1979). Meanwhile, it has become clear that H2O ice is the most abundant ice in space. The OH stretching mode at 3.05 m and the H2O bending mode at 6.0 m are detected in many lines of sight (e.g. Willner et al. 1982; Tanaka et al. 1990; Murakawa et al. 2000; Boogert et al. 2000; Keane et al. 2001; Gibb et al. 2004; Knez et al. 2005) and in many different environments, ranging from quiescent dark clouds to dense star forming regions and protoplanetary disks (Whittet et al. 1988; Tanaka et al. 1994). It has been a long-standing problem that the intensity ratio of these two water bands in astrophysical observations is substantially different from values derived from laboratory spectra of pure H2O ice. In recent years it has been proposed that this discrepancy may be due to contributions of other species, in particular more complex organic ices, to the overall intensity of the 6 m band (Gibb & Whittet 2002). An alternative explanation is that the band strengths change due to interaction of H2O molecules with other constituents in the ice. In both high-mass and low-mass star forming regions, CO is - together with CO2 - the most dominant species that could mix with H2O. In a recent study on H2O:CO2 ices, Öberg et al. (2007) showed indeed significant band strength differences between pure and mixed H2O ices. The present study extends this work to CO containing water ice.
CO accretes onto dust grains around 20 K (Sandford et al. 1988; Acharyya et al. 2007) and plays a key role in solid state astrochemical processes, e.g., as a starting point in hydrogenation reactions that result in the formation of formaldehyde and methanol (Watanabe & Kouchi 2002; Hiraoka et al. 2002; Watanabe et al. 2004; Fuchs et al. 2007). A strong absorption centered around 2139 cm-1 was assigned to solid CO by Soifer et al. (1979), again following thorough laboratory infrared work. Further efforts in the laboratory have shown that CO molecules can be intimately mixed, either with molecules that possess the ability to form hydrogen bonds, such as H2O, NH3 and CH3OH - often referred to as “polar” ices - or with molecules that can only participate in a van der Waals type of bond, such as CO itself, CO2 and possibly N2 and O2 - so-called “non-polar” ices. In laboratory mixtures with H2O and CO, the two forms are distinguished spectroscopically; the double Gaussian peak structure for the CO stretch fundamental can be decomposed in Gaussian profiles at 4.647 m (2152 cm-1) and 4.675 m (2139 cm-1), attributed to the polar and non-polar component, respectively (Sandford et al. 1988; Jenniskens et al. 1995). On the contrary, pure CO measured in the laboratory exhibits a single Lorentzian band, which is located around 2139 cm-1. This Lorentzian absorption profile can be further decomposed into three Lorentzian components centered around 2138.7, 2139.7 and 2141.5 cm-1 (Fraser et al. 2007).
In astronomical spectra, the 2139 cm-1 feature has been considered as an indicator of CO in H2O poor ice, and the 2136 cm-1 feature as CO in H2O rich environments (Tielens et al. 1991). More recently it was found that the astronomical CO profiles can be decomposed into three components at 2136.5 cm-1, 2139.9 cm-1 and 2143.7 cm-1, with the 2139.9 cm-1 feature ascribed to pure CO ice, and the 2143.7 cm-1 feature ascribed to the longitudinal optical (LO) component of the vibrational transition in pure crystalline CO (Pontoppidan et al. 2003). Boogert et al. (2002) proposed that the astronomically observed peak at 2143 cm-1 can originate from CO:CO2 mixtures, but this identification is still controversial (van Broekhuizen et al. 2006). The assignment of the 2136.5 cm-1 feature in these phenomenological fits remains unclear. It should be noted that laboratory and astronomical data differ slightly in peak position, largely due to the fact that grain shape effects play a role for abundant ice molecules like CO and H2O.
Recently, elaborate laboratory work and ab initio calculations on mixtures of CO and H2O have shown that the absorption around 2152 cm-1 results from CO being bound to the dangling OH site in H2O ice (Al-Halabi et al. 2004). Surprisingly enough, this absorption has never been observed in the interstellar medium (e.g. Pontoppidan et al. 2003). The non-detection of this feature has been explained by other molecules blocking the dangling OH site, which is therefore unavailable to CO. An extension of this explanation is that the binding sites are originally populated by CO, but that this has been processed to other molecules, such as CO2 or methanol (Fraser et al. 2004). Furthermore, it has been shown that the number of dangling OH sites decreases upon ion irradiation, which in turn results in a reduction of the integrated intensity of the 2152 cm-1 feature (Palumbo 2006, and references therein). The 2136-2139 cm-1 feature is ascribed to CO bound to fully hydrogen bonded water molecules (Al-Halabi et al. 2004).
Since CO and H2O are among the most abundant molecules in the interstellar medium, mixed CO and H2O ices have been subject to many experimental and theoretical studies (e.g. Jiang et al. 1975; Hagen & Tielens 1981; Hagen et al. 1983; Al-Halabi et al. 2004; Fraser et al. 2005). For example, the behavior of the 2136-2139 cm-1 CO stretching band has been quantitatively studied as a function of temperature and its band width and position have been studied as a function of H2O concentration in binary mixtures, but containing only up to 25% of CO (Schmitt et al. 1989a, b). Furthermore, water clusters have been studied in a matrix of CO molecules with a ratio of 1:200 H2O:CO. This has resulted in a tentative assignment of H2O monomers and dimers and the conclusion that H2O forms a bifurcated dimer structure in CO (Hagen & Tielens 1981). Other studies have focussed on Temperature Programmed Desorption (TPD) combined with Reflection Absorption Infrared Spectroscopy (RAIRS) of mixed and layered CO/H2O systems, enhancing greatly our knowledge on their structures and phase transitions (Collings et al. 2003a, b). Nevertheless, a full quantitative and systematic study on the behavior of H2O in CO ice, and vice versa, with straight applications to astronomical spectra, is lacking in the literature. This is the topic of the present work.
The desorption temperatures of CO and H2O differ by as much as 145 K under laboratory conditions. However, H2O/CO ices are expected to play a role in astronomical environments at temperatures not only well below the desorption temperature of CO at 20 K (Fuchs et al. 2007), but also well above the desorption temperature of pure CO ice, since CO can be trapped in the pores of H2O ice (Collings et al. 2003a). Thus far, both species have been observed together in lines of sight. It is often concluded from the non-detection of the 2152 cm-1 feature that H2O and CO are not intimately mixed in interstellar ices. On the other hand, in some lines of sight CO is trapped in pores of a host matrix, as evidenced by the detection of the 2136 cm-1 CO feature (Pontoppidan et al. 2003). It is plausible that this trapping results from heating of a mixture of CO and a host molecule. Accordingly, we have also performed some experiments as a function of temperature.
In this work, the effect of CO on the H2O vibrational fundamentals is compared to the effect of CO2 on these modes, as studied recently by Öberg et al. (2007). A comparison between the H2O bending mode characteristics in CO and CO2 containing ices illustrates the sensitivity of this mode to the molecular environment. In addition, this work provides a unique laboratory tool for investigating the amount of CO mixed with water.
The outline of this manuscript is as follows. In Sect. 2 the experimental setup is described and the data analysis is explained. Section 3 is dedicated to the influence of CO on the water vibrational modes, as well as the influence of water on the CO bands. In Sect. 4, the astrophysical relevance is discussed and the conclusions are summarized in Sect. 5.
2 Experiment and data analysis
The experimental setup used for the measurements has been described in detail in Gerakines et al. (1995). It consists of a high vacuum setup ( Torr) in which ices are grown on a CsI window at a temperature of 15 K. The window is cooled down by a closed cycle He refrigerator and the sample temperature is controlled by resistive heating. A Fourier Transform InfraRed (FTIR) spectrometer is used to record ice spectra in transmission mode from 4000 to 400 cm-1 (2.5-25 m) with a resolution of 1 cm-1.
The sample gas mixtures are prepared in glass bulbs, using a glass vacuum manifold. The bulbs are filled to a total pressure of 10 mbar, which is well below the water vapor pressure. The base pressure of the manifold is better than 10-4 mbar, resulting in negligible contamination levels. A sample of CO (Praxair 99,999%) is used without further purification. Deionized water, further purified by three freeze pump thaw cycles, is used for the H2O:CO mixtures. Mixtures with different ratios H2O:CO are prepared in the vacuum manifold and the resulting depositions are listed in Table 1. The growth rate onto the ice is determined by setting the exposure to 1016 molecules cm-2 s-1. Assuming a monolayer surface coverage of 1015 moleculescm-2 and a sticking probability of 1, this results in a growth rate of 10 Ls-1 (L = Langmuir). In the experiments where the effect of CO on the water ice vibrational modes is investigated, the water exposure has been kept constant with about 3000 L of water ice for the different mixtures to facilitate a one-on-one comparison between all samples. In the experiments where the effect of the H2O on the CO modes has been investigated, the total amount of deposited CO is kept constant at 3000 L (Table 1).
Three independent measurements are performed for 1:1 H2O:CO mixtures. These measurements allow for an estimate of the error in the experiment due to mixing of the gas, deposition of the sample and other errors that may occur. A conservative error of 10% on the mixing ratios is deduced from these experiments. Additionally, two test measurements are performed for samples of 1000 and 10000 L, to check for layer thickness dependencies (Table 1).
The infrared transmission spectra are taken using a Biorad FTS40 spectrometer. A total of 256 spectra are acquired and averaged for each sample measurement. Background measurements are performed prior to each of the measurements and are subtracted to reduce the noise level. The spectra are further processed using IDL (Interactive Data Language) in order to flatten the baseline. This is done by fitting a second order polynomial through a set of five points, which are visually chosen well away from absorption features. The data reduction does not lead to a distortion of the absorption profiles.
| Composition | A (L1111 L (Langmuir) = 1 10-6 Torr s 1 monolayer of molecules) | B (L) | Total (L) |
|---|---|---|---|
| pure H2O | 3000 | 0 | 3000 |
| pure CO | 0 | 3000 | 3000 |
| H2O:CO 1:0.25 | 3000 | 750 | 3750 |
| H2O:CO 1:0.5 | 3000 | 1500 | 4500 |
| H2O:CO 1:1 | 3000 | 3000 | 6000 |
| H2O:CO 1:2 | 3000 | 6000 | 9000 |
| H2O:CO 1:4 | 3000 | 12000 | 15000 |
| H2O:CO 1:1 | 10000 | 10000 | 20000 |
| H2O:CO 1:1 | 1000 | 1000 | 2000 |
| CO:H2O 1:0.25 | 3000 | 750 | 3750 |
| CO:H2O 1:0.5 | 3000 | 1500 | 4500 |
| CO:H2O 1:1 | 3000 | 3000 | 6000 |
| CO:H2O 1:2 | 3000 | 6000 | 9000 |
| CO:H2O 1:4 | 3000 | 12000 | 15000 |
| CO:H2O 1:1 | 10000 | 10000 | 20000 |
| CO:H2O 1:1 | 1000 | 1000 | 2000 |

The absorption band strengths for the three modes of pure water ice at 15 K are well known from literature (Gerakines et al. 1995). The adopted values are 210-16, 1.210-17 and 3.110-17 cm molecule-1 for the stretching (=3279 cm-1 or 3.05 m), bending (=1655 cm-1 or 6.04 m) and libration mode (=780 cm-1 or 12.8 m), respectively (see Fig.1). Calculating the integrated absorption bands over the intervals listed in Table 2 for the mixtures and scaling them to the integrated band strength for pure water ice, allows for a deduction of the band strengths for the water ice bands in the mixture via:
| (1) |
where is the calculated band strength for the vibrational water mode in the 1:x mixture, its integrated area, the band strengths for the water modes as available from literature and the integrated area under the vibrational mode for the pure water sample. The free OH stretching mode, ‘the fourth band’, is scaled to the stretching mode for pure water since this absorption is absent in the spectrum of pure H2O ice.
Integration limits used throughout the experiment are listed in Table 2. Integrated areas relative to the integrated area of the pure water stretching mode, pure H2O stretch, are investigated as a function of CO concentration. For the sample with the most mixed in CO, i.e., the 1:4 H2O:CO mixture, an analysis in terms of cluster formation is given. In addition, the influence of temperature on the water stretching mode is studied. The measured spectra for the H2O:CO mixtures are available online at the Leiden ice database: http://www.strw.leidenuniv.nl/lab/databases.
| Integration bounds | ||||
| Species | Assignment | Peak | Lower | Upper |
| H2O | 780 (12.8) | 500 (20.0) | 1100 (9.09) | |
| 1655 (6.04) | 1100 (9.09) | 1900 (5.26) | ||
| 3279 (3.05) | 3000 (3.33) | 3600 (2.78) | ||
| 3655 (2.73) | 3600 (2.78) | 3730 (2.68) | ||
| CO 222The integrations for the two CO bands are performed using Gaussian fits. | 2139 (4.68) | 2120 (4.72) | 2170 (4.61) | |
| 2152 (4.65) | 2120 (4.72) | 2170 (4.61) | ||
3 Results
3.1 Influence of CO on water bands

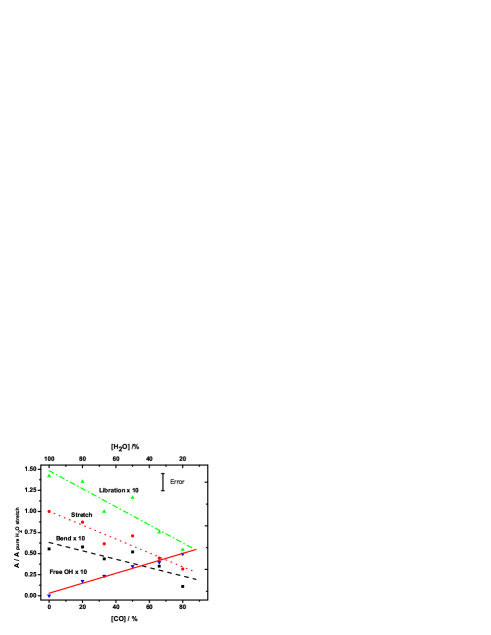
In Fig. 2, the four H2O ice fundamentals are shown for different compositions. Similar to CO2 (Öberg et al. 2007), CO has a clear influence on the water ice absorption bands compared to the pure H2O ice. This effect is different for each of the four bands. The bulk stretch mode is most strongly affected; the band strength for this mode decreases by more than a factor of 2 when the CO fraction is raised from 0% to 80%. The band strength of the free OH stretch, which is absent when no CO is mixed in, is greatly enhanced with concentration. The libration mode gradually looses intensity when the amount of CO in the ice is increased and the peak of the absorption band shifts to lower energy. The integrated areas of the four water modes are scaled to the pure water stretching mode and plotted versus the CO concentration in Fig. 3. A linear function is fitted through the data points of the four water modes. The a coefficient indicates the strength of increase/decrease of the band strength, and the b coefficient indicates the band strength of water relative to the pure stretching mode when no impurities are mixed in. There exists some deviation between the data points and the fit function, which is most probably due to the deposition accuracy, but this deviation is within the experimental error of 10%. A clear trend in all four modes is observed. In Table 3, the linear fit coefficients are listed for the H2O:CO binary mixtures. The linear coefficient for the H2O stretching mode is highest and negative, indicating the strongest decrease in band strength. The free OH stretching mode has a positive linear coefficient indicating that this is the only mode to increase in intensity upon CO increase. A comparison with recently obtained data for H2O:CO2 ices shows the same trend. Apart from the bending mode, all effects are more pronounced in the CO2 mixtures, i.e., the absolute values of the a coefficient are larger by a factor of 1.3 - 2. This is related to the actual interactions in the ice and work is in progress to study such effects in more detail for a large number of species from a chemical physics perspective.
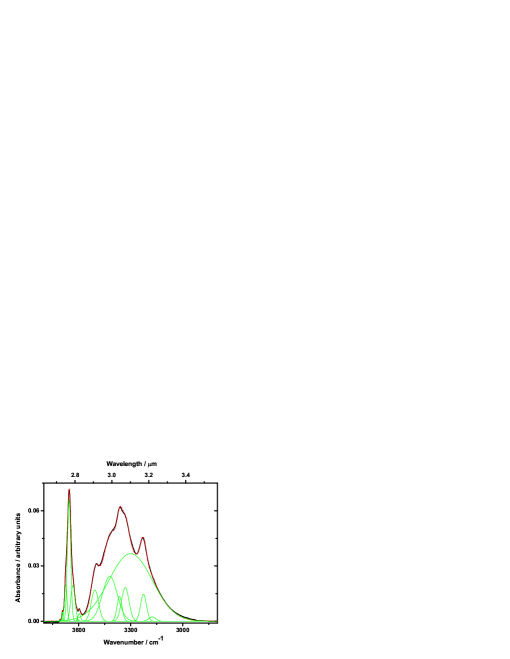
The free OH mode, the water stretching mode and the water bending mode start showing substructure superposed onto the bulk absorption profile upon increase of the fraction of CO in the ice mixture (Fig. 4). The absorptions of the bulk modes are still clearly apparent beneath the substructure. For the stretching mode this absorption shifts from 3279 cm-1 to a higher wavenumber of 3300 cm-1. The peak absorption for the bulk bending mode shifts from 1655 cm-1 for pure H2O to 1635 cm-1 for the 1:4 H2O:CO mixture. The libration mode is also red-shifted upon CO concentration increase. For the pure H2O ice spectrum this mode is located at 780 cm-1, while for the highest partner concentration it appears at 705 cm-1. The free OH stretch gradually increases in frequency. The peak absorption shifts from 3636 cm-1 for the 1:0.25 to 3655 cm-1 for the 1:4 H2O:CO mixture, which corresponds to a blue shift of 19 cm-1.
| Linear Coefficients | ||||
| mixture | H2O mode | constant (b ) | slope (a ) | |
| [10-16 cm molecule-1] | [10-19 cm molecule-1] | |||
| H2O:CO | 0.300.02 | 2.10.4 | 0.93 | |
| 0.130.02 | 1.00.3 | 0.84 | ||
| 2.00.1 | 163 | 0.95 | ||
| 0 | 1.20.1 | 0.99 | ||
| H2O:CO2 a | 0.320.02 | 3.20.4 | 0.99 | |
| 0.140.01 | 0.50.2 | 0.81 | ||
| 2.10.1 | 222 | 0.99 | ||
| 0 | 1.620.07 | 0.99 | ||
| a From Öberg et al. (2007) | ||||
The substructure, which is superimposed on the bulk stretching mode around 3300 cm-1, has been previously assigned to (H2O)n water clusters in the ice. These assignments are based on matrix spectroscopic data of H2O in a matrix of N2 + O2 (75:25) (Ohno et al. 2005). Comparable data for H2O in a matrix of CO are not available. Nevertheless, in Fig. 4 it is shown that an excellent fit is obtained when peak positions from matrix spectroscopic data are used, assuming that the peak positions are shifted, which is indicative for the difference in interaction between H2O and CO compared to H2O and N2 + O2. For each of the contributions, the peak position, bandwidths (Full-Width-at-Half-Maximum, FWHM) and integrated area, are summarized in Table 4 and compared to previous results obtained by Ohno et al. (2005). Some absorptions are red-shifted and other absorptions are blue-shifted compared to absorptions of H2O clusters in a N2 + O2 matrix. Note that the relative H2O concentrations in the present work are substantially higher than in the matrix experiments by Ohno et al. (2005). As a consequence, larger H2O clusters are more pronounced in our spectra.
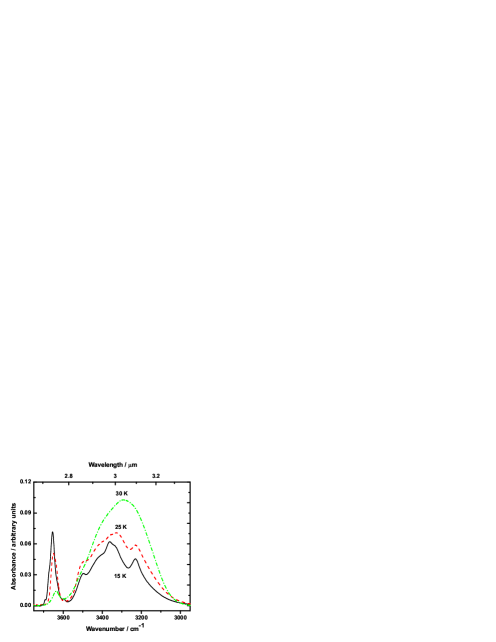
Additionally, the temperature of the sample plays a role on the band strengths. A clear effect is encountered when the temperature is slightly increased, i.e., from 15 to 25 K, close to the desorption temperature of CO. At this temperature, the CO molecules in the matrix start gaining enough energy to become mobile. The mobility in the matrix allows water clusters to find partners for hydrogen bindings and to reorganize themselves to form a stronger bulk hydrogen bonded network, as indicated by the increased bulk stretch mode band strength and decreasing intensity of the substructure. Figure 5 nicely shows the transition from H2O clusters embedded in a matrix of CO to the formation of a bulk hydrogen bonded network.
| Mode | Positiona | Positionb | Positionb | FWHMb | Areab |
| (cm-1) | (cm-1) | (cm-1) | (cm-1) | (a.u. cm-1) | |
| Free OH (ring) cyclic-pentamer, cyclic-trimer free OH, clusters hexamer | 3688 | 3674 | 15 | 15 | 0.371 |
| Asymmetric stretch H-acceptor dimer | 3715 | 3693 | 22 | 7 | 0.040 |
| Asymmetric stretch monomer | 3715 | 3706 | 9 | 5 | 0.043 |
| Symmetric stretch monomer | 3635 | 3608 | 27 | 5 | 0.074 |
| Symmetric stretch H-acceptor dimer | 3629 | 3596 | 33 | 15 | 0.078 |
| Bulk free OH stretch | —– | 3655 | —– | 19 | 1.57 |
| Bulk free OH stretch | —– | 3633 | —– | 25 | 0.609 |
| H-bonded OH stretch ”chair” hexamer | 3330 | 3331 | -1 | 43 | 0.987 |
| H-bonded OH stretch ”cage” hexamer | 3224 | 3226 | -2 | 34 | 0.626 |
| H-bonded OH stretch ”prism” hexamer | 3161 | 3175 | -14 | 40 | 0.119 |
| H-bonded OH stretch pentamer | 3368 | 3364 | 4 | 29 | 0.491 |
| H-bonded OH stretch ”book1, cage” hexamer | 3450 | 3420 | 30 | 86 | 2.62 |
| Bulk stretching mode | —– | 3300 | —– | 250 | 11.5 |
| H-bonded OH stretch ring cyclic trimer | 3507 | 3506 | 1 | 42 | 0.894 |
| a Ohno et al. (2005), b This work. |
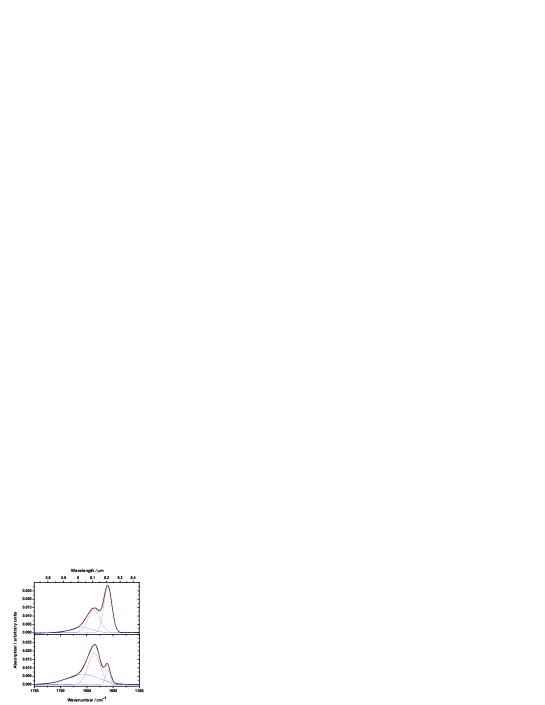
Figure 6 shows the different effect of CO and CO2 on the H2O bending mode in ice for the 1:4 H2O:CO2 and 1:4 H2O:CO mixtures. The intensity ratio of the main peaks is actually reversed in the two mixtures. The differences between the two mixtures start showing up from a mixing ratio of 1:0.5 H2O:X and become more pronounced for higher CO and CO2 concentrations. In addition, the CO mixtures exhibit a stronger broad underlying feature, which is visualized by the Gaussian fit in Fig. 6. In other words, a detailed study of the H2O bending and stretching modes may provide additional information on whether CO or CO2 dominates in the ice. The free OH stretching mode is also affected differently by the two molecules. In the H2O:CO2 mixtures, the mode is more shifted to higher wavenumbers. For the 1:1 H2O:CO2 mixture the peak position is 3661 cm-1, compared to 3635 cm-1 for the H2O:CO mixtures.
Thicker and thinner layers of the mixtures have been measured to check for thickness dependence. We conclude that within our experimental error limit, ice thickness does not play a significant role in the behavior of the relative band strengths. This conclusion is supported by the observation that identical mixing ratios in the two measurement series (H2O/CO and CO/H2O) show the same (scaled) spectroscopic behavior for different total ice thicknesses (Table 1).
3.2 Influence on the CO band
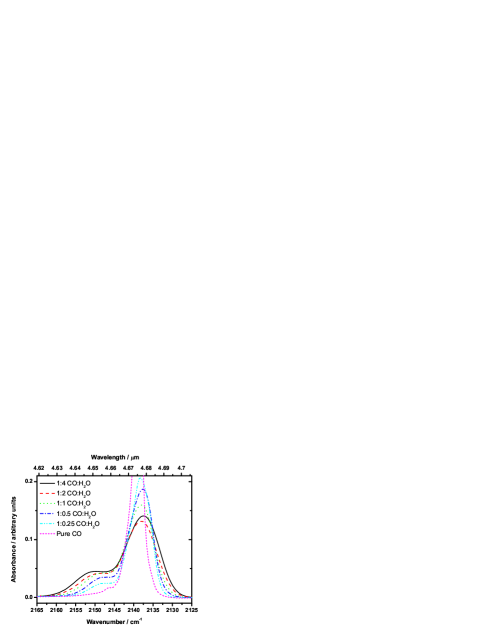
Section 3.1 shows that mixing CO into a water mixture affects the band strengths of the water vibrational modes. Reciprocally, the CO stretch mode is also altered when water is added to CO ice. This is seen in the experiments where the amount of deposited CO is kept constant (Table 1). When water is mixed into the CO ice, the absorption changes from a Lorentzian profile to a Gaussian profile. Furthermore, the second CO absorption at 2152 cm-1, ascribed to CO bound to the H2O dangling OH sites (Fraser et al. 2004), manifests itself as a Gaussian profile and increases in integrated intensity upon increase of water concentration. The transition from the pure CO Lorentzian shaped profile to two Gaussian shaped profiles for the mixed CO:H2O ices is illustrated in Fig. 7. We have not further decomposed the 2139 cm-1 component. More information is available from Fraser et al. (2007).
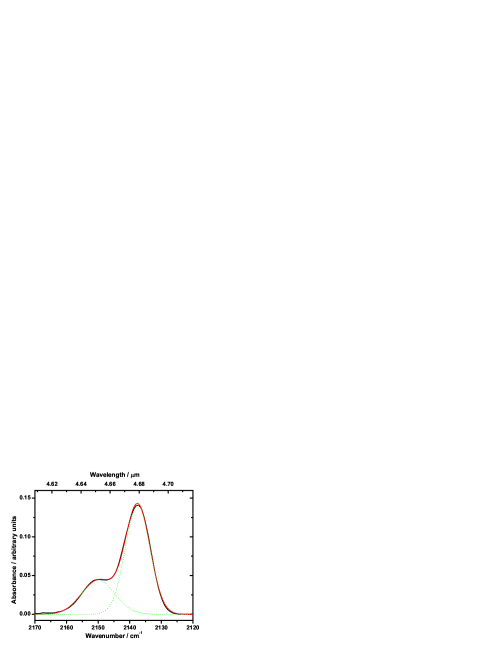
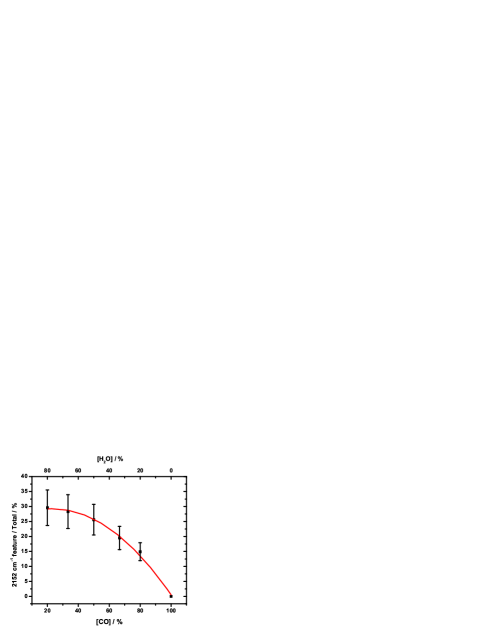
Gaussian fits for both CO absorption components are made for the range of mixtures as listed in Table 1 at a temperature of 15 K. One typical fit is shown in Fig. 8. With this example, it is demonstrated that excellent fits are obtained by using the fit parameters as listed in Table 5. The behavior of the integrated area of the 2152 cm-1 component compared with the total integrated CO absorption is plotted as a function of CO and H2O concentration in Fig. 10. The integrated area for the 2152 cm-1 component decreases with increasing CO content, and it is undetectable for a pure CO ice. A second order polynomial describes how the polar component behaves with respect to the CO concentration or water concentration in the ice over the interval spanning from 20% CO up to a pure CO ice. Note that the total amount of deposited CO is kept constant. The coefficients of the second order polynomial of the form are a=0.005, b=0.23 and c=26.6. For a decreasing amount of water in the sample, the peak position of the 2152 cm-1 absorption feature is most strongly affected and decreases gradually to lower wavenumbers, until it reaches 2148 cm-1 for the 1:0.25 CO:H2O mixture. The FWHM of this band is also affected. It starts at a width of 10.5 cm-1 for the 1:4 CO:H2O mixture and decreases to 7.5 cm-1 for the 1:0.25 CO:H2O mixture. The position of the main absorption feature at 2139 cm-1 is only slightly affected by increasing the amount of water in the sample and decreases by 1.3 cm-1 when going from pure CO ice to the 1:4 CO:H2O mixture, i.e., a shift towards the 2136 cm-1 feature is observed upon dilution (see Fig. 9). Its position is expected to shift even more, to 2136 cm-1, for H2O concentrations above 80%. The FWHM of this absorption feature decreases from 8 cm-1 for the 1:4 CO:H2O to 5 cm-1 for the 1:0.25 CO:H2O sample. The Lorentzian peak profile of the pure CO absorption exhibits an even smaller FWHM of 2 cm-1. An overview of the changes in peak position, FWHM and integrated intensity is given in Table 5.
The position of the 2139 cm-1 absorption feature is also strongly dependent on the temperature of the ice, as illustrated in Fig. 9. The majority of the CO will desorb as the ice is heated above the CO desorption temperature. The remaining CO shows an absorption that is shifted toward 2135 cm-1. Thus, a shift from 2139 to 2136 cm-1 occurs both by mixing with significant amounts of H2O and by heating of CO:H2O above 40 K, even for mixtures with modest amounts of H2O. From Fig. 9, it becomes clear that the latter effect (i.e. heating) is the more critical one. One should note that the laboratory data presented here cannot be compared one-to-one with the observational data because of shifts caused by grain shape effects.

| Composition | Position | FWHM | Area |
|---|---|---|---|
| (cm-1) | (cm-1) | (a.u. cm-1) | |
| Pure CO 333Lorentzian profile | 2138.8 | 2.2 | 1.9 |
| 1:0.25 CO:H2O | 2138.2 | 5.0 | 1.31 |
| 2147.5 | 7.5 | 0.23 | |
| 1:0.5 CO:H2O | 2138.0 | 5.8 | 1.40 |
| 2148.1 | 7.8 | 0.34 | |
| 1:1 CO:H2O | 2138.2 | 6.5 | 1.28 |
| 2148.3 | 9.0 | 0.44 | |
| 1:2 CO:H2O | 2137.9 | 7.6 | 1.24 |
| 2149.5 | 9.8 | 0.49 | |
| 1:4 CO:H2O | 2137.5 | 7.9 | 1.38 |
| 2150 | 10.5 | 0.58 |
4 Discussion
CO and H2O ice abundances are often derived using the well known constants from the literature. The experimental work presented here shows that band strengths deduced from pure ices cannot be used to derive column densities in interstellar ices without further knowledge on the environmental conditions in the ice. Concentrations of CO and CO2 ice as high as 15 and 21%, respectively, relative to H2O, have been reported towards GL7009S (Keane et al. 2001). If we assume a polar fraction of 75%, as reported towards W33A, and that the polar fraction of both CO and CO2 ice are in close contact with the water, the band strength for the H2O bending mode is reduced by a factor of 1.25. In other words, the band strength for H2O will be smaller and hence the column density of H2O will be underestimated if the laboratory data from pure H2O ice are adopted from the literature.
Vice versa, for deriving the column density of CO ice one should also consider the influence of other molecules in its vicinity. The integrated absorbance of CO, however, is less strongly influenced by the presence of H2O. The CO absorption decreases in absolute intensity when water is mixed in, but the total integrated band strength is compensated by a broadening of the absorption and the appearance of the 2152 cm-1 component, at least in the laboratory spectra. Upon heating, the CO molecules become trapped into pores, as indicated by the 2136 cm-1 feature. The absorption strength of this band is very sensitive to temperature (Schmitt et al. 1989a). The CO absorption profile is indicative of the amount of water that is mixed. The percentage of CO mixed into the H2O ice is derived in the laboratory from the ratio between the 2152 cm-1 feature and the total CO absorption (Fig. 10). This allows the derivation of the effective band strength A for H2O in a mixture with CO using the linear model proposed in Sect. 3.1, and thus an estimate of the column density for H2O via the equation (Sandford et al. 1988):
| (2) |
Temperature also affects the band strength as shown in Fig. 5. The applications of the model presented in Fig. 10 are restricted to deduction of column densities for ices with a temperature of about 15 K, which have not been thermally processed. It should also be noted, as recently demonstrated by Bisschop et al. (2007), that in addition to binary mixtures, tertiary mixtures also have to be taken into account to compare laboratory data with astronomical spectra.
5 Conclusions
Based on the experiments described in this manuscript and in recent work on H2O:CO2 mixed ices, we draw the following conclusions regarding the interaction between H2O and CO in a solid environment:
-
1.
The general trend on the band strengths of the four vibrational modes in water ices is similar for H2O:CO and H2O:CO2 mixtures with increasing CO or CO2 concentration. However, quantitative differences exist, reflecting differences in the strength of the interaction, which allow us to distinguish between CO and CO2 in H2O ice, explicitly assuming that the main constituents of the ice are H2O, CO2 and CO.
-
2.
The position of the water free OH stretching mode is particularly indicative of the molecule that is interacting in the matrix (CO vs CO2), again under the assumption that we only consider H2O/CO2/CO ices. The peak position of this mode is 26 cm-1 red-shifted for a 1:1 H2O:CO ice mixture compared to a 1:1 H2O:CO2 ice mixture.
-
3.
In addition, the water bending mode is indicative of the molecule, i.e., CO or CO2, that is interacting with the water ice. The relative integrated intensity of the Gaussian components reveals whether CO2 or CO is mixed into the H2O ice. The same restriction mentioned in conclusions 1 and 2 also applies here.
-
4.
Upon increasing the relative amount of CO in the mixture, a clear substructure begins to reveal itself in the bending, free OH stretch and bulk stretching mode. The arising substructure indicates the onset of H2O cluster formation in the H2O:CO ice. An assignment of the clusters was possible following matrix isolation spectroscopy.
-
5.
The substructure on the stretching mode quickly gives way to the bulk water mode when the temperature is increased close to the desorption temperature of CO. This can easily be depicted by CO molecules becoming mobile and hence allowing single water molecules and larger water clusters to find partners for bulk hydrogen bonding.
-
6.
The ratio 2152 cm-1 / total integrated CO absorption intensity is a tracer of the amount of CO that is mixed into the laboratory water ice, or vice versa. In astronomical spectra this band has not been observed.
-
7.
H2O column densities derived from astronomical spectra can easily be underestimated by as much as 25% when environmental influences, i.e., CO or CO2 presence, are not taken into account.
The present systematic study of CO:H2O ice, together with recent work on CO2:H2O ice, provide the tools with which to estimate the mixing ratios of the three most abundant molecules in interstellar ices.
Acknowledgements.
This work is part of the research programme of the ’Stichting voor Fundamenteel Onderzoek der Materie (FOM)’, which is financially supported by the ’Nederlandse Organisatie voor Wetenschappelijk Onderzoek (NWO)’. Additionally, financial support by the ’Greenberg Foundation’ and by ’the Netherlands Research School for Astronomy (NOVA)’ are gratefully acknowledged.References
- Acharyya et al. (2007) Acharyya, K., Fuchs, G. W., Fraser, H. J., van Dishoeck, E. F., & Linnartz, H. 2007, A&A, 466, 1005
- Al-Halabi et al. (2004) Al-Halabi, A., Fraser, H. J., Kroes, G. J., & van Dishoeck, E. F. 2004, A&A, 422, 777
- Bisschop et al. (2007) Bisschop, S. E., Fuchs, G. W., Boogert, A. C. A., van Dishoeck, E. F., & Linnartz, H. 2007, A&A, 470, 749
- Boogert et al. (2002) Boogert, A. C. A., Hogerheijde, M. R., & Blake, G. A. 2002, ApJ, 568, 761
- Boogert et al. (2000) Boogert, A. C. A., Tielens, A. G. G. M., Ceccarelli, C., et al. 2000, A&A, 360, 683
- Collings et al. (2003a) Collings, M. P., Dever, J. W., Fraser, H. J., & McCoustra, M. R. S. 2003a, Ap&SS, 285, 633
- Collings et al. (2003b) Collings, M. P., Dever, J. W., Fraser, H. J., McCoustra, M. R. S., & Williams, D. A. 2003b, ApJ, 583, 1058
- Fraser et al. (2007) Fraser, H. J., Bisschop, S. E., Alsindi, W. S., & van Dishoeck, E. F. 2007, A&A, submitted.
- Fraser et al. (2005) Fraser, H. J., Bisschop, S. E., Pontoppidan, K. M., Tielens, A. G. G. M., & van Dishoeck, E. F. 2005, MNRAS, 356, 1283
- Fraser et al. (2004) Fraser, H. J., Collings, M. P., Dever, J. W., & McCoustra, M. R. S. 2004, MNRAS, 353, 59
- Fuchs et al. (2007) Fuchs, G. W., Ioppolo, S., Bisschop, S. E., van Dishoeck, E. F., & Linnartz, H. 2007, A&A, in prep.
- Gerakines et al. (1995) Gerakines, P. A., Schutte, W. A., Greenberg, J. M., & van Dishoeck, E. F. 1995, A&A, 296, 810
- Gibb & Whittet (2002) Gibb, E. L. & Whittet, D. C. B. 2002, ApJ, 566, L113
- Gibb et al. (2004) Gibb, E. L., Whittet, D. C. B., Boogert, A. C. A., & Tielens, A. G. G. M. 2004, ApJS, 151, 35
- Hagen et al. (1979) Hagen, W., Allamandola, L. J., & Greenberg, J. M. 1979, Ap&SS, 65, 215
- Hagen & Tielens (1981) Hagen, W. & Tielens, A. G. G. M. 1981, J. Chem. Phys, 75, 4198
- Hagen et al. (1983) Hagen, W., Tielens, A. G. G. M., & Greenberg, J. M. 1983, A&AS, 51, 389
- Hiraoka et al. (2002) Hiraoka, K., Sato, T., Sato, S., et al. 2002, ApJ, 577, 265
- Jenniskens et al. (1995) Jenniskens, P., Blake, D. F., Wilson, M. A., & Pohorille, A. 1995, ApJ, 455, 389
- Jiang et al. (1975) Jiang, G. J., Person, W. B., & Brown, K. G. 1975, J. Chem. Phys, 62, 1201
- Keane et al. (2001) Keane, J. V., Tielens, A. G. G. M., Boogert, A. C. A., Schutte, W. A., & Whittet, D. C. B. 2001, A&A, 376, 254
- Knez et al. (2005) Knez, C., Boogert, A. C. A., Pontoppidan, K. M., et al. 2005, ApJ, 635, L145
- Léger et al. (1979) Léger, A., Klein, J., de Cheveigne, S., et al. 1979, A&A, 79, 256
- Merrill et al. (1976) Merrill, K. M., Russell, R. W., & Soifer, B. T. 1976, ApJ, 207, 763
- Murakawa et al. (2000) Murakawa, K., Tamura, M., & Nagata, T. 2000, ApJS, 128, 603
- Öberg et al. (2007) Öberg, K. I., Fraser, H. J., Boogert, A. C. A., et al. 2007, A&A, 462, 1187
- Ohno et al. (2005) Ohno, K., Okimura, M., Akai, N., & Katsumoto, Y. 2005, Phys. Chem. Chem. Phys., 7, 3005
- Palumbo (2006) Palumbo, M. E. 2006, A&A, 453, 903
- Pontoppidan et al. (2003) Pontoppidan, K. M., Fraser, H. J., Dartois, E., et al. 2003, A&A, 408, 981
- Sandford et al. (1988) Sandford, S. A., Allamandola, L. J., Tielens, A. G. G. M., & Valero, G. J. 1988, ApJ, 329, 498
- Schmitt et al. (1989a) Schmitt, B., Greenberg, J. M., & Grim, R. J. A. 1989a, ApJ, 340, L33
- Schmitt et al. (1989b) Schmitt, B., Grim, R., & Greenberg, M. 1989b, Spectroscopy and physico-chemistry of CO:H2O and CO2:H2O ices (Infrared Spectroscopy in Astronomy, Proceedings of the 22nd Eslab Symposium held in Salamanca, Spain, 7-9 December, 1988. Edited by B.H. Kaldeich. ESA SP-290. European Space Agency, 1989., p.213), 213–+
- Soifer et al. (1979) Soifer, B. T., Puetter, R. C., Russell, R. W., et al. 1979, ApJ, 232, L53
- Tanaka et al. (1994) Tanaka, M., Nagata, T., Sato, S., & Yamamoto, T. 1994, ApJ, 430, 779
- Tanaka et al. (1990) Tanaka, M., Sato, S., Nagata, T., & Yamamoto, T. 1990, ApJ, 352, 724
- Tielens et al. (1991) Tielens, A. G. G. M., Tokunaga, A. T., Geballe, T. R., & Baas, F. 1991, ApJ, 381, 181
- van Broekhuizen et al. (2006) van Broekhuizen, F. A., Groot, I. M. N., Fraser, H. J., van Dishoeck, E. F., & Schlemmer, S. 2006, A&A, 451, 723
- Watanabe & Kouchi (2002) Watanabe, N. & Kouchi, A. 2002, ApJ, 571, L173
- Watanabe et al. (2004) Watanabe, N., Nagaoka, A., Shiraki, T., & Kouchi, A. 2004, ApJ, 616, 638
- Whittet et al. (1988) Whittet, D. C. B., Bode, M. F., Longmore, A. J., et al. 1988, MNRAS, 233, 321
- Willner et al. (1982) Willner, S. P., Gillett, F. C., Herter, T. L., et al. 1982, ApJ, 253, 174