Atmospheric and Long Baseline experiments
Giorgio Giacomelli
Dept of Physics, Univ. of Bologna, and INFN,
V.le C. Berti Pichat 6/2, Bologna, I-40127, Italy
E-mail: giacomelli@bo.infn.it
Invited Lecture at the Carpatian Summer School of Physics 2007, Sinaia, Romania, August 2007
Abstract
The results obtained by several experiments on atmospheric neutrino oscillations are summarized and discussed. Then the results obtained by different long baseline neutrino experiments are considered. Finally conclusions and perspectives are made.
1 Introduction
Atmospheric neutrinos are well suited for the study of neutrino oscillations, since they have energies from a fraction of GeV up to more than 100 GeV and they may travel distances from few tens of km up to 13000 km; thus ranges from 1 km/GeV to km/GeV. Atmospheric neutrinos may study oscillations for small .
The early water Cherenkov detectors IMB [1] and Kamiokande [2] reported anomalies in the ratio of muon to electron neutrinos, while the tracking calorimeters NUSEX [3] and Frejus [4], and the Baksan [5] scintillator detector did not find any. In 1995 MACRO found a deficit for upthrougoing muons [6]. Then the Soudan 2 experiment [7] confirmed the ratio anomaly. In 1998 Soudan 2 [8], MACRO [9] and SuperKamiokande (SK) [10] reported deficits in the fluxes with respect to Monte Carlo (MC) predictions and angular distribution distortions; instead the distributions were in agreement with non oscillated MCs. These features may be explained in terms of oscillations.
The atmospheric neutrino flux was computed by many authors in the mid 1990s [11] and in the early 2000s [12]. The last had improvements, but also a new scale uncertainty.
Several long baseline beams were and are operational: KEK to Kamioka (K2K) (250 km), NuMi from Fermilab to the Soudan mine (730 km) and CERN to Gran Sasso(GS) (CNGS) (730 km). The K2K [13] and MINOS [14] experiments obtained results in agreement with the atmospheric results. The CNGS beam is under tests: some events were recorded in OPERA [15] and LVD [16] at GS.
Most experiments are disappearance experiments; OPERA is an appearance experiment, searching for in a pure beam.
Long baseline experiments will give an increasing contribution to neutrino physics.
2 Atmospheric neutrino oscillations
A high energy primary cosmic ray (CR), proton or nucleus, interacts in the upper atmosphere producing a large number of charged pions and kaons, which decay yielding muons and ’s; also the muons decay yielding and . The ratio of the numbers of to is 2 and . Atmospheric neutrinos are produced at 10-20 km above ground, and they proceed towards the earth.
If ’s have non-zero masses, one considers the weak flavour eigenstates and the mass eigenstates . Flavour eigenstates are linear combinations of mass eigenstates. For 2 flavour () and 2 mass eigenstates one writes
| (1) |
where is the mixing angle. The survival probability of the “beam” is
| (2) |
where and is the distance from production to detection.
The simple formula Eq. 2 is modified by additional flavours and by matter effects.
3 Results from atmospheric neutrino experiments
After the early indications of an anomaly in atmospheric ’s [1-7], in 1998 Soudan 2, MACRO and SK provided strong indications in favour of oscillations [8-10] [17]. Confirming results were presented by long baseline experiments [13] [14].
Soudan 2 used a modular fine grained tracking and showering calorimeter of t located underground in the Soudan Gold mine in Minnesota. The detector was made of 1m1m2.5m modules, surrounded by an anticoincidence shield. The bulk of the mass was 1.6 mm thick corrugated steel sheets interleaved with drift tubes [8]. The Soudan 2 double ratio for the zenith angle range is , consistent with oscillations.
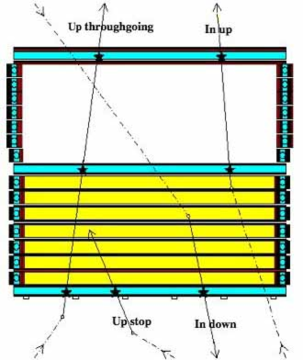
MACRO detected upgoing ’s via CC interactions ; upgoing muons were identified with streamer tubes (for tracking) and scintillators (for time-of-flight measurements), points and rectangles in Fig. 1a [18]. Events were classified as:
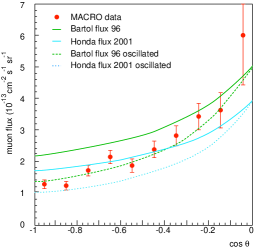
Upthroughgoing muons from interactions in the rock below the detector of with GeV. Data were compared with the predictions of the Bartol96 [11], FLUKA, HKKM01 [12] MCs, Fig. 2a. The shape of the angular distribution and the absolute value favoured oscillations with eV2 and maximum mixing.
The absolute value of the muons is higher than FLUKA and HKKM01 MC predictions . The difference between new and old MC predictions is due to new fits of CR data [21].
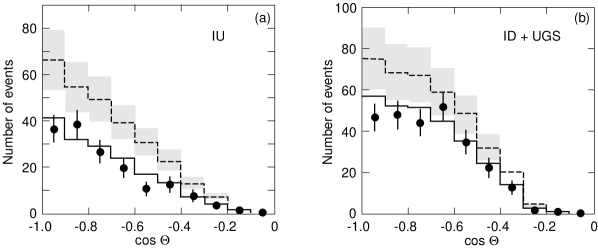
Low energy events. Semicontained upgoing muons (IU) come from interactions inside the lower apparatus. Up stopping muons (UGS) are due to external interactions yielding upgoing muons stopping in the detector; the semicontained downgoing muons (ID) are due to downgoing ’s interacting in the lower detector; the lack of time information prevents to distinguish between the two samples. An equal number of UGS and ID events is expected. The average parent neutrino energy is 2-3 GeV. The data are compared with MC predictions without oscillations in Figs. 2b,c: they show a uniform deficit over the whole angular distribution with respect to Bartol96 predictions.
against . Matter effects due to the difference between the weak interaction effective potential for with respect to sterile neutrinos, yield different total number and different zenith distributions of upthroughgoing muons. between the events with and with was used [9]. The measured ratio, , is compared with and . One concludes that oscillations are excluded at the 99.8% c.l.
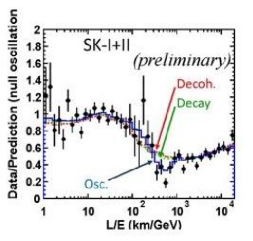
energy estimate by Multiple Coulomb Scattering (MCS) of upthroughgoing muons. An estimate of the muon energy was made through their Multiple Coulomb Scattering (MCS) in the absorbers [19]. The ratios Data/MC as a function of are in agreement with oscillations [20].
New determination of the oscillation parameters. In order to reduce the effects of systematic uncertainties in the MCs, MACRO used the following three independent ratios (it was checked that FLUKA, HKKM01 and Bartol96 MC yield the same predictions):
(i) High Energy Data: zenith distribution ratio:
(ii) High Energy Data: energy measurement ratio:
(iii) Low Energy Data: .
The no oscillation hypothesis had a probability P3 and is ruled out by . Fitting the 3 ratios to the oscillation formulae, one obtained eV2. Using Bartol96, one adds the information on absolute fluxes:
(iv) High energy data (systematic error 17): .
(v) Low energy semicontained muons (scale error ): .
These leave the best fit values unchanged and improve the significance to .
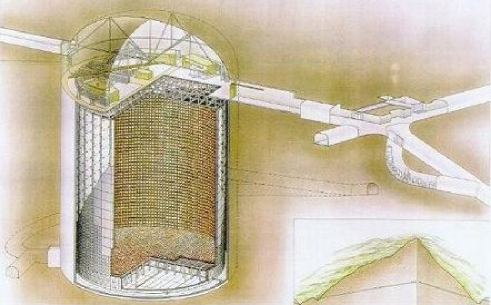
SuperKamiokande (SK) is a large cylindrical water Cherenkov detector of 39 m diameter and 41 m height containing 50 kt of water (fiducial mass 22.5 kt); it is seen by 50-cm-diameter inner-facing phototubes (PMTs), Fig. 1b. The 2 m thick outer layer of water acts as an anticoincidence; it is seen by smaller outward-facing PMTs. The detector is located in the Kamioka mine, Japan. Atmospheric neutrinos are detected in SK by measuring the Cherenkov light generated by the charged particles produced in the neutrino CC interactions with water nuclei. Thanks to the high PMT coverage, the experiment detects events of energies as low as 5 MeV.
The large detector mass allows to collect a high statistics sample of fully contained events (FC) up to 5 GeV. The FC events yield rings of Cherenkov light on the PMTs. FC events can be subdivided into sub-GeV and multi-GeV events, with energies below and above 1.33 GeV. FC events include only single-ring events, while multi-ring ones (MRING) are treated as a separate category. The partially contained events (PC) are CC interactions with vertex within the fiducial volume and at least a charged particle, typically the , exits the detector (the light pattern is a filled circle). Upward-going muons (UPMU), produced by from below interacting in the rock, are subdivided into stopping ( GeV) and throughgoing muons ( GeV) [10].
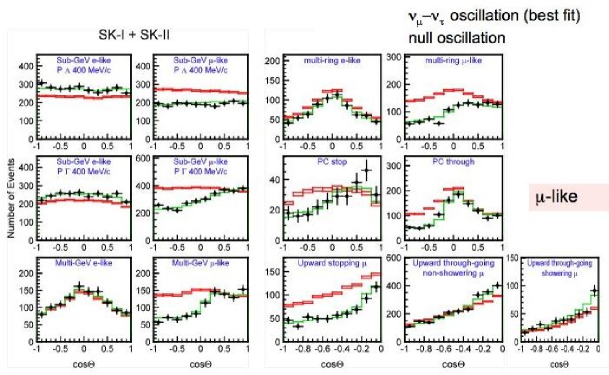
Particle identification is performed using likelihood functions to parametrize the sharpness of the Cherenkov rings, which are more diffused for electrons than for muons. The zenith angle distributions for -like and -like sub-GeV and multi-GeV events are shown in Fig. 3 left. The MC problem described before exists also in SK [10]: the e-like events were in agreement with the HKKM95 MC predictions for no-oscillations; they are higher than the HKKM01 non oscillated MC. For -like events, the new MC predictions are low: to reduce these problems the normalization is a free parameter.
The ratios -like events/MC do not depend from while -like events/MC show a dependence on consistent with an oscillation hypothesis, Fig. 3 right. The overall best fit of SK data corresponds to maximal mixing and eV2.
Exotic oscillations. MACRO and SuperK data were used to search for sub-dominant oscillations due to Lorentz invariance violation (or violation of the equivalence principle). In the first case there could be mixing between flavor and velocity eigenstates. 90 c.l. limits were placed in the Lorentz invariance violation parameters at =0 and at 1 [22]. Neutrino decay could be another exotic explanation for neutrino disappearence; no radiative decay was observed [23].
4 Long baseline neutrino beams and experiments
Neutrino physics has opened new windows into phenomena beyond the Standard Model of particle physics. Long baseline neutrino experiments may allow further insight into physics. The first long baseline beam was the KEK to Kamioka (K2K) beam, the 2nd was the Fermilab to the Soudan mine beam (NuMi). CNGS [24] was commissioned in 2006 and started sending neutrinos to the GS Lab.
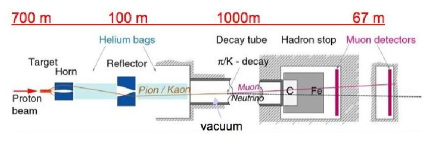
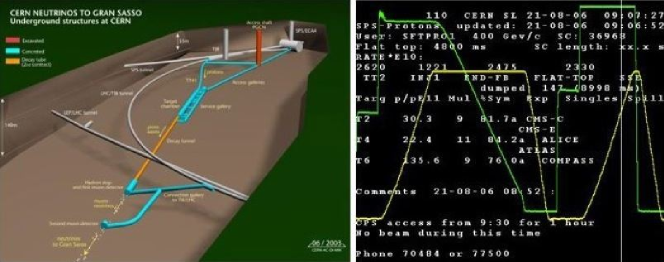
The CNGS beam. Fig. 4 left shows the main components of the beam at CERN [24]. A 400 GeV beam is extracted from the SPS and is transported to the target. Secondary pions and kaons are focused into a parallel beam by 2 magnetic lenses, called horn and reflector. Pions and kaons decay into and in a decay pipe. The remaining hadrons are absorbed in the hadron stop. The ’s are monitored in 2 detectors.
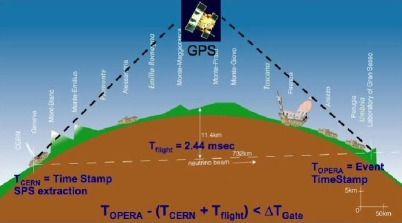
Fig. 4 right shows the path of the CNGS ’s from CERN to GS. It also shows the synchronization via GPS of the atomic clocks at CERN and GS. The beam is optimised for producing a maximum number of CC interactions in OPERA. Fig. 5 left shows the underground layout of the SPS and of CNGS at CERN; Fig. 5 right shows the scheme of the SPS operation during a test run. The mean energy is 17 GeV, the contamination 2, the () and the number of is negligible. The muon beam size at the 2nd muon detector at CERN is 1 m; this gives a beam size at GS of 1 km. The first low intensity test beam was sent to GS in August 2006 and 3 detectors (OPERA, LVD and Borexino) obtained their first events. The low intensity CNGS was stable and of high quality. The shared SPS beam sent a pulse of 2 neutrino bursts, each of 10.5 sec duration, separated by 50 ms, every 12 s. A higher intensity beam expected for October 2006 did not happen because of a water leak at CERN. In September 2007 a 2nd test was successful, but a high intensity run was cancelled because of cooling problems.
The K2K experiment confirmed the results of atmospheric oscillations [13].
The MINOS experiment on the NuMi low energy neutrino beam is a large magnetised steel scintillator tracking calorimeter, complemented by a similar near detector and a calibration detector. The experiment obtained important results which confirm the atmospheric oscillation picture with maximal mixing and eV2 [14].
We shall now concentrate on the experiments at GS which may use the CNGS beam.
Borexino is an electronic detector designed to study solar ’s, in particular those coming from Be7 decays in the center of the sun [25]. The important part of the detector is a large sphere, whose central part was filled with liquid scintillator at the beginning of 2007. The outer sphere was started to be filled with water in 2006; during the first run only few meters of water were in the sphere and only few events were observed.
LVD is an array of liquid scintillators with a total mass of 1000 t; it is designed to search and study ’s from gravitational stellar collapses [16]. LVD plans to be a neutrino flux monitor of the CNGS beam. LVD has 3 identical “towers”, each containing 8 active modules; a module has 8 counters of , filled with 1.2 t of liquid scintillator. CNGS ’s are observed through the detection of muons produced in neutrino CC interactions in the surrounding rock or in the detector and through the detection of the hadrons produced in neutrino NC/CC interactions inside the detector. In the 2006 test run LVD counted 50-100 muons per day and recorded 500 events [16].
OPERA [15] is a hybrid-emulsion-electronic detector, designed to search for the oscillations in the parameter region indicated by the atmospheric neutrinos, confirmed by the K2K and MINOS experiments. The appearance will be made by direct detection of the lepton, from CC interactions and the lepton decay products. To observe the decays, a spatial resolution of m is necessary; this is obtained in emulsion sheets interspersed with thin lead target plates (Emulsion Cloud Chamber (ECC)). OPERA may also search for the subleading oscillations and make a variety of observations using its electronic detectors.
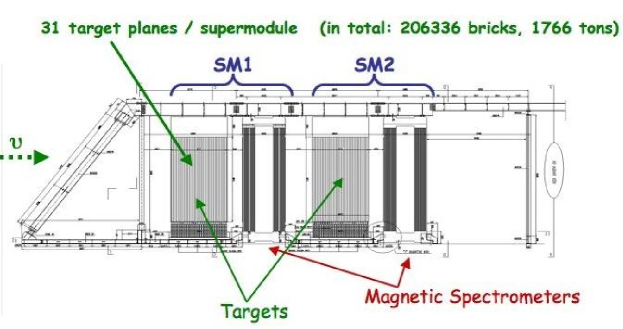
The OPERA detector, Fig. 6, is made of two identical supermodules, each consisting of a target section with 31 target planes of lead/emulsion-film modules (“bricks”), of a scintillator tracker detector and of a muon spectrometer. The final target mass is 1.55 kt.
The first electronic subdetector is an anticoincidence wall to separate events coming from interactions in OPERA from those in the material and rock before OPERA.
The target tracker is made of scintillator strips, each 7 m long and of 2515 mm2 cross section. A wavelength shifting fibre of 1 mm diameter transmits the light signals to both ends. The readout is done by 1000 64 channel Hamamatsu PMTs.
The muon spectrometer consists of 2 iron magnets instrumented with Resistive Plate Chambers (RPC) and drift tubes. Each magnet is an m2 dipole with a field of 1.52 T in the upward direction on one side and in the downward direction on the other side. A magnet consists of twelve 5 cm thick iron slabs, alternated with RPC planes.
The precision tracker measures the muon track coordinates in the horizontal plane. It is made of drift tube planes, placed in front and behind each magnet and between the 2 magnets. The muon spectrometer has a for muon momenta GeV/c. Two crossed planes of glass RPC’s (XPC’s) are installed in front of the magnets.
The DAQ system uses a Gigabit network of 1150 nodes. To match the data of the different subdetectors a “time stamp” is delivered by a clock using the GPS. Also the synchronization with the beam spill is done via GPS. The commissioning of each electronic detector was made with CR muons and with the CNGS at reduced intensity.
Nuclear emulsions and their scanning. The basic target module is a “brick”, consisting of 56 lead plates (1 mm thick) and 57 emulsion layers. A brick has a size of cm2, a depth of 7.5 cm (10 radiation lengths) and a weight of 8.3 kg. Two additional emulsion sheets, the changeable sheets (CS), are glued on its downstream face. The bricks are arranged in walls. Within a brick, the achieved spatial resolution is m and the angular resolution is 2 mrad. Walls of target trackers provide the interaction trigger and the identification of the brick in which the interaction took place.
The bricks are made by the Brick Assembling Machine (BAM), which consists of robots for the mechanical packing of the bricks. The BAM, installed in the GS lab, produces 1 brick every 2 minutes. The bricks are handled by the Brick Manipulator System (BMS), made of two robots, each operating at one side of the detector.
A fast automated scanning system with a scanning speed of cm2/h per emulsion (m thick) is needed to cope with daily analyses of many emulsions. This is a factor of 10 increase with respect to past systems. For this purpose were developed the European Scanning System (ESS) in Europe [26] and the S-UTS in Japan [27]. An emulsion is placed on a holder and the flatness is guaranteed by a vacuum system. By adjusting the focal plane of the objective, 16 tomographic images of each field of view are taken at equally spaced depths. The images are digitized, converted into a grey scale, sent to a vision processor and analyzed to recognize sequences of aligned grains. The 3-dimensional structure of a track in an emulsion layer (microtrack) is reconstructed by combining clusters belonging to images at different levels. Each microtrack pair is connected across a plastic base to form the base track. A set of connected base tracks forms a volume track.
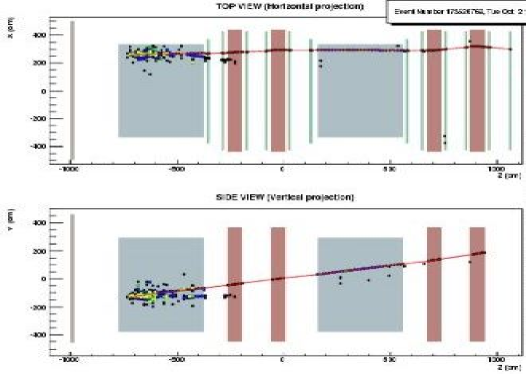
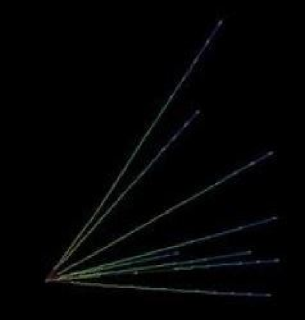
In the 2006 test run OPERA recorded 319 events, consistent with the 300 events expected from the delivered integrated intensity. A fit to the angle distribution of these reconstructed events on-time with the beam yielded a mean muon angle of 3.4∘ in agreement with the value of 3.3∘ expected for originating from CERN and travelling under the earth surface to the GS underground halls. During the same test run, a test of the CS procedure was performed, using an emulsion detector plane inserted in the SM2 target. 9 muons produced by neutrino interactions in the rock surrounding the detector crossed the CS plane surface. The test proved the capability of going from the centimetre scale of the electronic tracker to the micrometric resolution of nuclear emulsions [15]. During the short 2007 test run several interactions in the lead bricks positioned in the target section of SM 1 (40% of total mass) were detected by the electronic detectors and confirmed by tracks observed in the CS: the event vertexes were observed in the emulsions analysed by microscopes: Fig. 7 left shows an interaction in the electronic detectors, Fig. 7 right the vertex region in the emulsions. This test confirmed the validity of the methods to associate electronic detectors to nuclear emulsions.
5 Conclusions
The atmospheric neutrino anomaly became, in 1998, the atmospheric neutrino oscillation hypothesis with maximal mixing and eV2.
It was later confirmed with more data and by the first two long baseline experiments. All experiments agree on maximal mixing, while the are:
Soudan-2 5.2 , MACRO 2.3 , SK 2.5 , K2K 2.7 , MINOS 2.38 eV2.
These results come from disappearance experiments
(). An appearance experiment () with detection would solve conclusively the situation.
Other more exotic scenarios have been investigate like: Lorentz invariance violation, radiative decays, etc. Stringent limits were established for these hypotheses.
Acknowledgments. I acknowledge many colleagues at CERN, LNGS and Bologna. I thank drs. A. Casoni, M. Errico, M. Giorgini and R. Giacomelli for technical help.
References
- [1] R. Becker-Szendy et al., Phys. Rev. D 46, 372 (1992).
- [2] Y. Fukuda et al., Phys. Lett. B 335, 237 (1994).
- [3] M. Aglietta et al., ICRC Proc. 2014, 446 (1993).
- [4] K. Daum et al., Z. Phys. C 66, 417 (1995).
- [5] S. Mikheyev et al., Phys. Lett. B 391, 491 (1997); Phys. Lett. B 449, 137 (1999).
- [6] S. Ahlen et al., Phys. Lett. B 357, 481 (1995).
- [7] W. W. M. Allison et al., Phys. Lett. B 391, 491 (1997).
- [8] W. W. M. Allison et al., Phys. Lett. B 449, 137 (1999); Phys. Rev. D 68, 113004 (2003).
- [9] M. Ambrosio et al., Phys. Lett. B 434, 451 (1998); Phys. Lett. B 478, 5 (2000); Phys. Lett. B 517, 59 (2001). S. P. Ahlen et al., Nucl. Instrum. Meth. A 324, 337 (1993).
- [10] Y. Fukuda et al., Phys. Rev. Lett. 81, 1562 (1998); Phys. Lett. B 433, 9 (1998); Phys. Rev. Lett. 85, 3999 (2000); Y. Ashie et al., Phys. Rev. Lett. 93, 101801 (2004); K. Kaneyuki, at HEP2007.
- [11] V. Agrawal et al., Phys. Rev. D 53, 1314 (1996); M. Honda et al., Phys. Rev. D 52, 4985 (1995).
- [12] M. Honda et al., Phys. Rev. D 64, 053011 (2001); Phys. Rev. D 70, 043008 (2004); G. Battistoni et al., Astrop. Phys. 19, 269 (2003).
- [13] D. Kielorezka et al., Acta Phys. Polon. B 35, 1453 (2004).
- [14] N. Tagg et al., hep-ex/0605058 (2006); A. Weber, Presentation at HEP2007, Manchester.
- [15] R. Acquafredda et al., J. Phys. 8, 303 (2006); http://operaweb.web.cern.ch/; G. Giacomelli et al., physics/0609045 (2006); E. Barbuto et al., Nucl. Instr. Meth. A 525, 485 (2004).
- [16] N. Y. Agafonova et al., hep-ex/0710.1536 (2007); http://www.bo.infn.it/lvd; H. Menghetti, at GS.
- [17] P. Bernardini hep-ex/9809003 (1998); F. Ronga hep-ex/9810008 (1998).
- [18] M. Ambrosio et al., Nucl. Instr. Meth. Phys. Res. A 486, 663 (2002).
- [19] M. Ambrosio et al., Phys. Lett. B 566, 35 (2003).
- [20] M. Ambrosio et al., Eur. Phys. J. C 36, 323 (2004); G. Giacomelli et al., hep-ex/0707.1691 (2007).
- [21] T. K. Gaisser et al., Nucl. Phys. B Proc. Suppl. 118, 109 (2003).
- [22] G. Battistoni et al., Phys. Lett. B 615, 14 (2005).
- [23] S. Cecchini et al., hep-ex/0606037 (2006); Astrop. Phys. 21, 35 (2001).
- [24] CNGS project: http://proj-cngs.web.cern.ch/proj-cngs/; G. Giacomelli, physics/0703247 (2007).
- [25] http://borex.lngs.infn.it; M. Pallavicini (A few CNGS events in Borexino) Gran Sasso meeting.
- [26] N. Armenise et al., Nucl. Instr. Meth. A 551, 261 (2005); M. De Serio et al., Nucl. Instr. Meth. A 554, 247 (2005); L. Arrabito et al., Nucl. Instr. Meth. A 568, 578 (2006); physics/0701192 (2007).
- [27] T. Nakano, Proc. of Int. Europhys. Conf. on High Energy Physics, Budapest, Hungary, 2001.