Activity cycle of the giant star of Z Andromedae and its spin period
Abstract
We have reanalyzed the long-term optical light curve (LC) of the symbiotic star Z Andromedae, covering 112–yr of mostly visual observations. Two strictly periodic and one quasi-periodic cycles can be identified in this LC. A P1=7550 d quasi periodicity characterizes the repetition time of the outburst episodes of this symbiotic star. Six such events have been recorded so far. During quiescence states of the system, i.e. in time intervals between outbursts, the LC is clearly modulated by a stable coherent period of P2=759.1 d. This is the well known orbital period of the Z And binary system that have been measured also spectroscopically. A third coherent period of P3=658.4 d is modulating the intense fluctuations in the optical brightness of the system during outbursts. We attribute the trigger of the outbursts phenomenon and the clock that drives it, to a solar type magnetic dynamo cycle that operates in the convection and the outer layers of the giant star of the system. We suggest that the intense surface activity of the giant star during maximum phases of its magnetic cycle is especially enhanced in one or two antipode regions, fixed in the atmosphere of the star and rotating with it. Such spots could be active regions around the North and the South poles of a general magnetic dipole field of the star. The P3 periodicity is half the beat of the binary orbital period of the system and the spin period of the giant. The latter is then either 482 or 1790 d. If only one pole is active on the surface of the giant, P3 is the beat period itself, and the spin period is 352 d. It could also be 5000 d if the giant is rotating in retrograde direction. We briefly compare these findings in the LC of Z And to similar modulations that were identified in the LC of two other prototype symbiotics, BF Cyg and YY Her.
keywords:
binaries: symbiotic – stars: individual: Z And – stars: magnetic fields – stars: oscillations.1 Introduction
Some thirteen years ago we made a first attempt to extract information about the prototype symbiotic star Z And by applying techniques of time-series analysis to its optical light curve (LC) (Formiggini & Leibowitz (1994), hereafter paper I). We have collected all historical and modern measurements of the brightness of the star known to us, mostly visual estimates by countless amateur astronomers all over the world. In this we have been greatly helped by the rich and invaluable data archive of the American Association of Variable Star Observers (AAVSO). The LC analyzed in that work covered 98–yr of the star history. Since our first analysis, data on additional 14–yr of this star photometric behavior have been accumulated. This fact, together with some experience and knowledge that we gained on the photometric variability of two other prototype symbiotics, BF Cyg and YY Her, (Leibowitz & Formiggini 2006–hereafter paper II; Formiggini & Leibowitz 2006–hereafter paper III), prompted us to make a second attempt to understand Z And through its long-term LC. In this work we present the results of our reanalysis of the more extended LC, now covering 112–yr. Some of our conclusions reconfirm part of what we asserted in paper I. Here we present also new conclusions about the system.
2 The symbiotic system Z And
The basic parameters of the Z And symbiotic star and the common knowledge and understanding of this system are summarized in many papers (e.g. Kenyon & Webbink 1984; Mikolajewska & Kenyon 1996; Sokoloski et al. 2006). Important developments in the study of this system in the thirteen years since the publication of paper I, that are related to our present analysis, may be summarized as follows: From polarimetric data, Schmid & Schild (1997) were able to determine the orbital plane inclination of the binary system i=47∘12∘. The spectroscopic orbital period was found to be identical to the photometric one derived in paper I,(Mikolajewska & Kenyon 1996; Fekel et al. 2000). Sokoloski & Bildstein (1999) discovered coherent 28 minute oscillations, which were interpreted as reflecting the spin period of the magnetic white dwarf (WD) component of the system. This episode was detected, however, only during a decline from one upward fluctuation in the brightness of the star (within our H6 event–see below) that started in 1997. Another attempt to observe rapid oscillations during the 2000-2002 fluctuation of that event yielded a null result (Sokoloski et al. 2006; Gromadzki et al. 2006). Recently, Sokoloski et al. (2006) made a thorough analysis of multi-wavelength observations of the 1996-97 and the 2000-02 fluctuations of event H6. They propose that the first one is probably a cataclysmic instability episode in an accretion disk around the WD of the system. They suggest that the second, much more intense outburst, and presumably also many other similar fluctuations of Z And, constitute a new type of a ”combination nova” outburst. This is an eruption and a large pour of energy from the system, the origin of which is disk instability, coinciding or preceding an enhanced nuclear burning on the surface of the WD.
3 The long-term light curve of Z And: the data
For the construction of the visual LC of Z And, we used the Payne-Gaposhkin (1946) data, covering the period from 1895 to 1944 and the visual magnitude estimates of AAVSO. Our procedure in bringing the two data sources to a satisfactory common scale and zero level is described in paper I–Section 2.
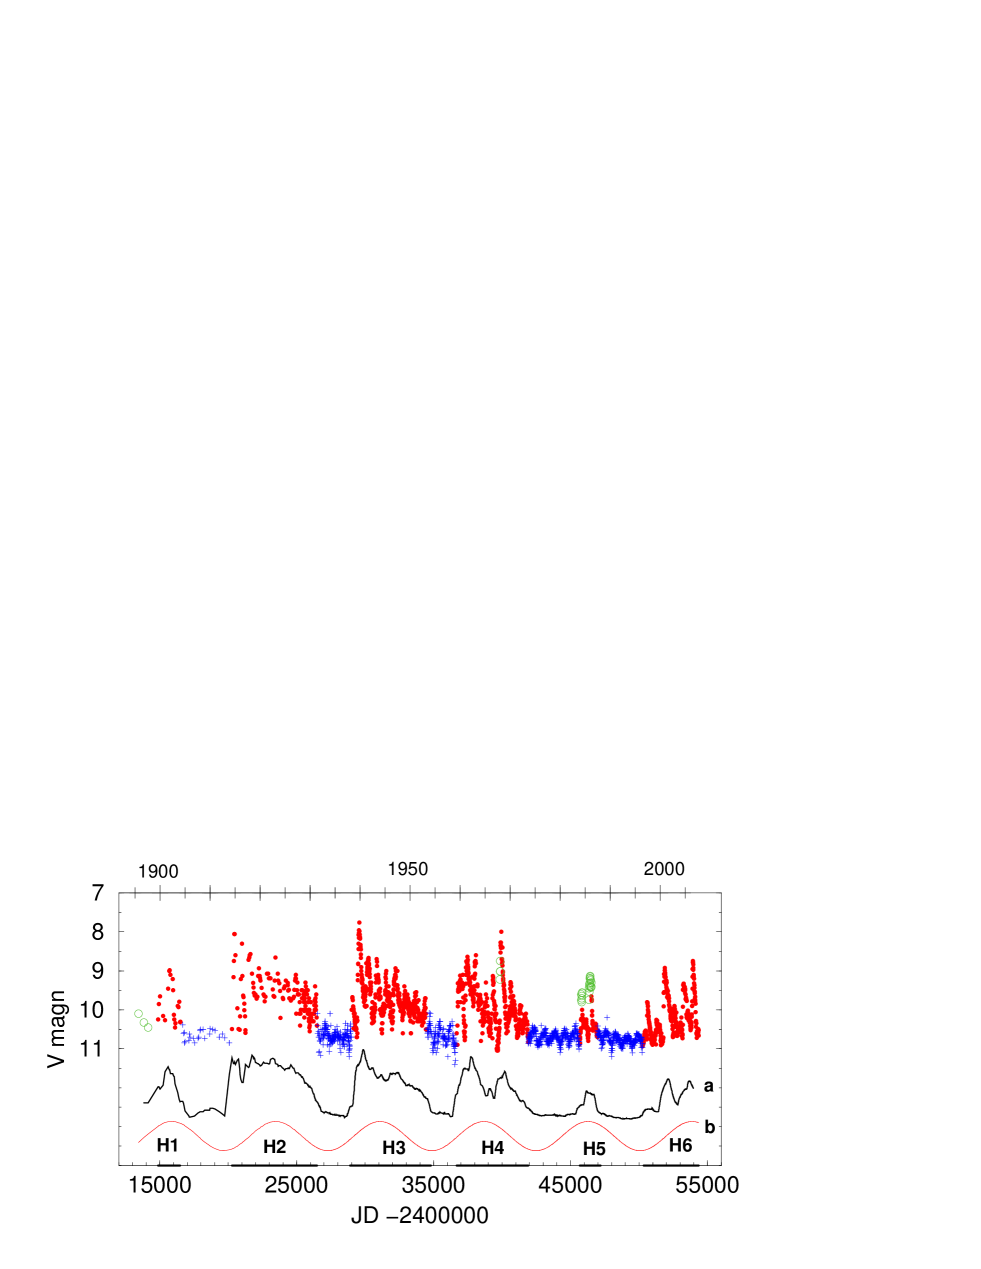
The LC shown in Fig. 1 here is the same one presented in fig. 1 of paper I, extended up to the month of September 2007. The points displayed in the figure after JD=2425000 are the magnitude estimate values in equal time bins of 10 d width. Due to the scarcity of the earlier data, those points are presented as given in the original sources. In our analysis of the data we have eliminated the first three points marked in the plot by open circles, on account of their large separation in time from the rest of the data. Our results, however, do not change significantly if we add these points to the LC. The other twenty nine points marked by circles will be discussed in Section 4.4. The curve underneath the observed data points displays the running mean of the LC above it. The running window that we have used is 760 d wide. The sine wave curve depicted in the figure will be explained in Section 4.1. The two lower curves were shifted downward from their nominal y values to facilitate eye comparison.
4 Analysis
Basic characteristics of the optical LC of Z And become qualitatively apparent by just looking at Fig. 1. The temporal behavior of the star is marked by six outburst events, during most of which the mean brightness of the system rose by more than one magnitude. This is clearly seen in the running mean curve in Fig 1. This curve displays the mean over 760 d of the star magnitude, namely, the average magnitude of the star over one binary orbital cycle of the system (see below). Superposed on these brightening episodes are large fluctuations that reach up to two magnitudes peak to peak amplitude. The outburst episodes which we designate as H1 to H6, are marked by the heavy lines along the time axis.
The individual events (red dots in Fig.1) are however quite different from each other, in their duration, in their structure, as well as in the amplitude of the fluctuations. We refer to all of them as the high (H) states of the system.
In between the H states there are clear time intervals during which the brightness of the system is down and in a much quieter state. These are the low (L) states of the system (blue crosses in in Fig.1).
It can clearly be seen in Fig. 1 that the brightness of the star at all L states is cyclically modulated with one and the same periodicity.
4.1 Outbursts
Our first quantitative treatment of the LC was a computation of its power spectrum (PS) (Scargle, 1982). We also applied on it the AoV technique of period search in time-series (Schwarzenberg-Czerny 1989). Both yield very similar results.
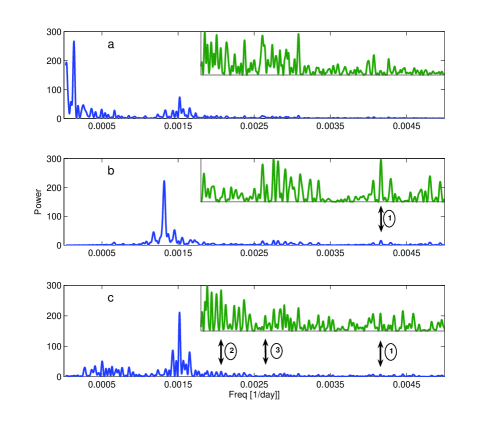
Fig. 2(a) presents the PS of the observed LC seen in Fig. 1, in the period range from 200–d to the entire length of the LC, nearly 40000 d. There is a high rise of the spectrum at the extreme low frequency region of it. It indicates some variability on time scale of the length of the LC. This can either be a real effect or an artifact due to some systematic error in our procedure of normalization of the different data sources in bringing them to a common magnitude level.
Asides from this feature, the PS is dominated by two peaks, both are statistically significant. The major one is at the frequency f1, corresponding to the period P1=7550722 d. The uncertainty quoted here and throughout this work is P2/T, P being the corresponding period and T is the time length of the LC. The second high peak in the PS near f=0.0015 d-1 will be discussed in Section 4.3.
The lowest curve in Fig. 1 is a sine wave of the P1 periodicity, fitted to the data by least squares. The purpose of presenting it is only to show qualitatively how faithful is P1 in representing the quasi cycle of the outburst occurrences.
We note that our present P1 value and the value quoted in paper I for the characteristic repetition time of the outbursts of Z And are within the corresponding error estimates. The difference between the two values is due to the new outburst of the system of the present era, that was added in the last fourteen years to the older LC analyzed in paper I. In any event, as we shall discuss in Section 5.2, we do not claim, nor do we believe that the P1 number represents a period of a strictly cyclic process. The outbursts of Z And take place quasi-periodically and P1 is presently the best estimate for the average time interval between centres of successive outburst events. The inserts in Fig. 2 (a)–(c) are blowups of the high frequency end of the corresponding PS. They, and the arrows in all frames of Fig. 2 will be discussed in Section 6.2.1.
4.2 The L state
Fig. 2(b) is the PS of the combined LC of all low states of the system. The unquestionable highly statistical significant peak is at the frequency f2, corresponding to the period P2=759.18.6 d. Fig. 3(a) displays twice the L state LC folded onto the P2 periodicity. It is quite evident that the system has preserved the phase of the P2 cycle, as well as the amplitude of this variation, throughout the entire 112–yr of the observations, i.e. for more than 44 successive cycles. This is in spite of the six time intervals of different lengths, those of the H state of the system, that are dispersed within these 112–yr, during which the P2 periodicity all but disappeared from the LC of the star. Note the absence of any spectral feature in Fig 2(c) at the frequency of the high peak seen in Fig 2(b) (see Section 4.3)
4.3 The H state
Fig. 2(c) is the PS of the H state LC. Before combining the magnitudes of all the outbursts of the star into this single H LC, we subtracted from each individual H LC a polynomial of first or second degree. This process detrended each individual H LC from variability on the time scale of the H time interval itself. When we subtract from each H LC only the corresponding mean magnitude we obtain similar results.
The highest peak in Fig. 2(c), which is statistically highly significant, is at the frequency f3, corresponding to the period P3=658.45.5 d. The cluster of lower peaks around it are either aliases of the high one or resulting from the highly non harmonic structure of the P3 periodicity. For example, the second highest peak to the right of the f3 one, corresponds to the period of 606 d. This is the beat period of P3 and P1, due to the gaps in the H LC, (the time intervals of the L state), that break up the H LC with the 7550 d periodicity.
Fig. 3(b) is the LC of the H state, folded onto the P3 periodicity. The twenty nine points marked by red circles are the ones marked by circles in Fig. 1. We shall refer to them shortly. With the exception of these points, all other 1533 points seen in the figure are evidence of the persistence of the P3 period in the H state of the system. The figure demonstrates that the period P3 has the same phase in all its appearances, including the H6 event and the H1 event. These two events are separated from each other by 55 cycles of this period and the 100 years that separate them contain the five time intervals of the L state, during which the P3 period is absent from the LC. There is no peak at the f3 frequency in the PS of the L state. Note the saw tooth structure of the mean profile of the P3 photometric cycle.
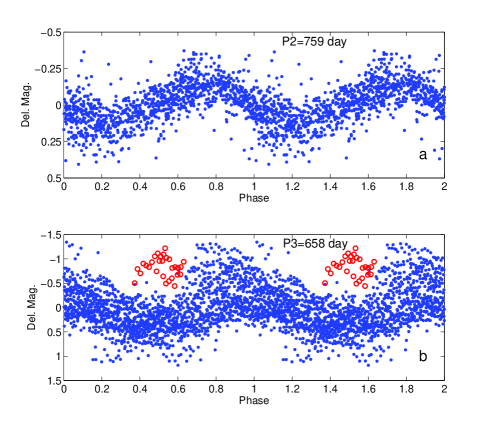
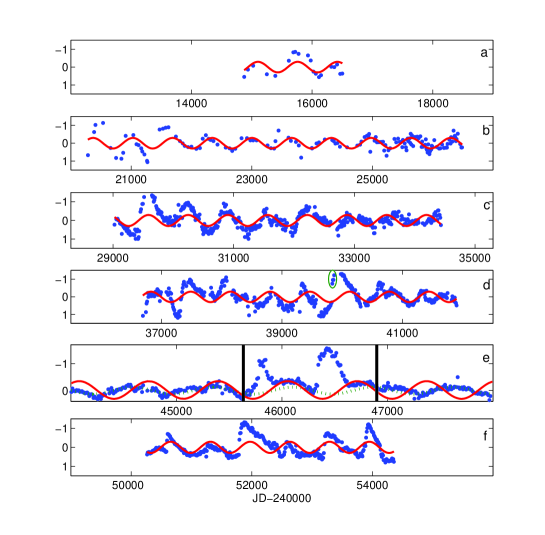
Fig. 4 displays in details the quality of the fit of the P3 periodicity to the individual fluctuations in each of the six outburst events. Each frame presents the observed detrended LC of one event. The harmonic function is a sine wave fitted to the combined H LC of the star. Thus the amplitude and the phase of the wavefronts are the same in all six frames. Note that the scale of the x and y axis in Fig. 4 (e) is different from all the rest. Fig. 4 (e) presents a time range that is wider than event H5, as defined in Fig. 1. The outburst event itself is the segment delineated by the two vertical lines in the figure. The dotted line is the run of harmonic wave of the P2 periodicity that is fitted by least squares to the L light curve.
In all other frames, i.e. all H events except H5, one can see in the figure that while the structure of the observed individual fluctuations varies considerably and is markedly different from the smooth sine wave structure, the phase seems to fit very well. Four points in H4 (surrounded by green ellipse in Fig. 4 (d)) around JD 40000 are exceptions, showing a sharp rise in the brightness of the star that starts near a minimum of the P3 periodicity. We shall return to these four outliner points, as well as to Fig. 4 (e) in the next section.
4.4 The outlier points
Most of the 29 H state points that are out of phase with the 1533 measurements that exhibit the P3=658 d oscillations, are those that constitute the two peaks of event H5. They are shown in details in Fig. 4 (e). The figure presents a wider segment of the LC. The H5 event as we identify it, is delineated by the two vertical lines in the figure. The solid sinusoid line is the harmonic wave of the P3 periodicity that is fitted by least squares to the entire H LC of the star, as in all other frames of Fig. 4. The dotted line is the P2=759 d harmonic wave fitted to the overall L LC. One can see in Fig. 4(e), that outside the two vertical lines the observed points follow very accurately the dotted line. In fact most of the dotted line is obscured by the observed points that in the resolution of the figure fall right on top of it. The LC in the section between the lines is composed of two well defined peaks and a sequence of lower points in between them, and a few that follow the second one. These lower points too exhibit two oscillations, the maxima of which are systematically higher by 0.1-0.2 magnitude than the maxima of the 759 wave. They also follow much better the solid line representing the 658 wave. Thus, the underlying rise in the brightness of the star of the H5 event, as compared with the brightness level in the L state, seems to follow the 658 periodicity, in phase with all other H events. The two peaks of this event, as well as the four outlier points in event H4, seem to be some sporadic flaring activity of the system that is probably related to the magnetic active phase of the star (see section 5.3) but occur not in phase with the 658 d periodicity.
For the first fluctuation of the H5 event, the exceptional nature of it is apparent even in the photometric data. Fig. 4 (e) shows that this peak is different from all others. Its duration is only one half of the 658 d period which is the typical duration of nearly all other fluctuations observed in the H state of the system.
The two out of phase fluctuations of H5 will be discussed further in Section 6.1.
5 Discussion
5.1 The low state
The optical brightness of Z And in its low state is clearly modulated by the P2=759 d periodicity. This period coincides well with the spectroscopic periodicity found for this binary star (Mikolajewska & Kenyon 1996; Fekel et al. 2000) and it is therefore well established as the orbital period of the system (paper I). The profile of the optical photometric cycle is nearly sinusoidal, with minimum light obtained near spectroscopic conjunction, when the giant star is in front of the WD of the system (Sokoloski et al. 2006). The cool component at this phase is obscuring part of the emission nebula, the excitation centre of which is the WD. This binary configuration is also the phase of minimum light reflection from the hemisphere of the giant illuminated by the hot component (Formiggini & Leibowitz 1990).
5.2 The outburst cycle
Six outbursts of Z And have been recorded so far. They are quite different from each other in duration, in the amount of excess optical radiation emitted in them, as well as in their structure. The outbursts seem to take place, however, with a fairly constant time interval of some 7550 d, i.e. some twenty one Earthly years, between the centres of successive ones. An outburst is generally manifested photometrically in the optical region by one or more magnitude increase in the average brightness of the system, and by intense periodic oscillations with a period P3=658.4 d of strongly varying amplitude.
Very similar features characterize the outbursts of two other symbiotic stars, BF Cyg (paper II) and YY Her (paper III). In these two systems the triggering of the outbursts has been ascribed to magnetic activity in the outer layers of the giant component of these two binary systems. A solar-like magnetic dynamo mechanism has been suggested as the driver of the phenomenon and as the clock that maintains the quasi periodic cyclic nature of it. The similarities in the phenomenology suggest also a similarity in mechanism. We propose that in Z And too, each of the six recorded outbursts resulted from intense, solar-like magnetic activity that takes place quasi-cyclically in the giant star of this system.
The quasi-periodic nature of the magnetic cycle in the giant of Z And is not dissimilar to the timing of the magnetic activity of our own Sun. The solar cycle is also far from being strictly periodic, with intervals between successive maxima varying between nine and thirteen years (Babcock 1961; Fligge, Solanki & Beer 1999; Mursula & Ulich 1998). Similarly, vast variations in the format of different maxima of the activity cycle as observed in Z And, characterize also the activity cycles of our Sun (Solanki et al. 2002).
5.3 The High state
During outbursts, the brightness of the star fluctuates violently with a distinct periodicity P3=658.4 d. While the structure of these oscillations is far from being stable, the star seems to preserve the periodicity and the phase of their occurrences. With the two exceptions discussed in Section 6.1, the clock that controls the P3 cycle appears to be stable throughout the 100 years period of the observations, i.e. for more than 55 cycles of the 658 d periodicity.
The persistence of the P3 periodicity and phasing, implies that the clock controlling them must be a rather stable one. In addition to the binary period, another clock in the system that is able to withstand the violent activity of the system with the tenfold or more variation in its output power, could be the spin of the giant star. We suggest that the period of the observed outburst oscillations and its stable phase are the combined effect of these two coherent cycles of the system, according to the following qualitative model.
5.3.1 The qualitative model
The system consists of a hot white dwarf (WD) star and an M giant, in binary orbit around each other with the period P2=759 d. Sokoloski et al. (2006) showed quite convincingly that the violent activity of the 2000-2002 Z And fluctuation, and presumably also of the other violent fluctuations of the system, consist of a nuclear runaway process (NRA) on the surface of the WD, combined with instability episodes in an accretion disk around the WD that seems to precede it or to coincide with it.
We suggest that the cause and the trigger of these two processes that constitute the ”combination nova” events is the enhanced activity of the giant star, regulated semi-periodically by the giant inner magnetic dynamo. One of the consequences of this activity is an intensification of the giant stellar wind, as is the case for the Sun.
In the case of our Sun, detailed measurements of solar wind various parameters in the last few years, especially by Ulysses, SOHO and other space probes, reveal this phenomenon as a multi-components, complex process. However, a global structure, in mass density as well as in velocity, that is regulated to a very large extent by a dipole magnetic field that can be ascribed to the Sun, is clearly apparent. During maximum activity seasons of the solar cycle, the wind pattern is changing, when both density and velocity taking different spatial configuration, also governed, however, by a global magnetic dipole field. For recent review of solar wind dynamics over the solar cycle see Schwenn (2006). Notice in particular Fig. 5 of that paper. During maximum activity seasons of the solar cycle, for example, the wind velocity from the magnetic pole regions is strongly enhanced (Marsch 2006; Ofman 2006) .
It is very much likely that for the giant of Z And as well, during active seasons, stellar wind from the poles of a dipole magnetic field of the star is more enhanced, in velocity, in mass density or in both, than the wind from the magnetic equatorial regions. The same qualitative model would apply if the magnetic field near the poles is inhibiting mass loss rather than intensifying it, and the wind from the magnetic equator is the more enhanced component. We hypothesize that the axis of the dipole is inclined with respect to the spin axis of the star and rotates with it. This is the case in the Sun, although the inclination angle there is quite small (Babcock 1961; Bilenko 2002). However, the phenomenon of magnetic oblique rotators with large inclination angles is not uncommon among stars (Kurtz 1990). We should note, however, that the existence of the hypothesized magnetic dipole field of the giant star would not be easily detected directly. In the solar case, the dipole field that is associated and presumably controls the global structure of the wind, reaches a maximum intensity of no more than 50 Gauss. The local fields in spots and in other features of surface and coronal activities are orders of magnitude stronger. For a distant observer, as we are with respect to the giant in Z And, they mask any observable diagnostic of the global field, such as measurable polarization or the Zeeman effect. The polarization observed by Schmid and Schild (1997) is due to Raman scattering and the geometry involved is on a much wider scale of the Z And nebula that far exceeds the binary dimensions. We further note, however, that the essential requirement here is not the dipole magnetic field. What is needed for our interpretation is the existence on the surface of the giant of one, or two antipodal active regions, fixed in the outer atmosphere and rotating with the star.
Frnandez-Castro et al. (1988) showed that even during quiescence states of Z And, some nuclear burning is taking place on the surface of the WD. This implies that even at quiescence, the giant is loosing mass at a large rate. This would indicate in turn, that the giant star is not far from filling its gravitational Roche lobe of the binary system (Sokoloski et al. 2006). The gravitational pull of the WD creates a tidal wave in the outer layers of the giant. The high tides are fixed in the rotating frame of the system. If the giant rotation is not locked to the orbital cycle, the tidal wave is traveling in the atmosphere of the spinning giant. For an observer on the surface of the giant, the period of one cycle, namely, the synodic period of the wave, is the beat of the binary orbital period of the system and the sidereal spin period of the star (see next Section).
During phases of maximum activity of the giant, whenever the bulge of the tidal wave is sweeping across the neighborhood of either the North or the South magnetic poles of the star (or, one might say, when the magnetic pole is sweeping through the tidal bulge) a specially intense mass loss rate is ensued. This results in enhanced cataclysmic dynamical processes in the disk around the WD. It also increases the rate of supply of fuel for the nuclear runaway burning on the surface of the WD, and thus greatly intensifying it. Due to the strong dependence of the rate of nuclear burning on the surface of a WD on temperature and density, even small enhancements in the accretion rate onto the disk and eventually to the WD surface are enough to excite vast variations in the energy output rate of the system (Sokoloski et al. 2006). This enhancement may occur once every synodic period of the traveling tidal wave, if the magnetic activity near one pole is significantly more enhanced than near the other. It may occur twice every synodic cycle if the two antipodal regions on the surface of the giant are more similar in their surface activity. This qualitative picture explains well the phase preservation in the P3 periodicity in all outburst events of the system (with the exception of the flares mentioned above). It is the coherence of the binary cycle on one hand, and that of the spin period of the giant on the other, that ensure it.
6 The giant spin period
We observe that during outbursts, the period of the activity cycle is P3=658 d. This is, as explained, the synodic period of the tidal wave in the giant atmosphere. If there are two antipodal centres of activity on the surface of the rotating giant, the synodic period is in fact 1317 d. For a binary orbital period of P2=759 d, this would be the case if the sidereal period of the giant spin is 482 or 1790 d. If the intense wind at maximum activity season is emanating mainly from just one pole, the giant sidereal spin period is 352 d. In this case it could also be 5000 d if the giant rotates in the retrograde direction.
6.1 The H5 maximum activity season
According to our suggested scenario (Section 5.3.1), during seasons of maximum magnetic activity of the giant, whenever a magnetic pole is sweeping through the tides bulge, a large flux of matter is flowing from the giant onto the Roche lobe of the WD. Thus, during the giant activity season, what is being supplied in large quantities to the disk around the WD is not only mass but also a great deal of angular momentum. The disk instability, which according to the combination nova scenario (Sokoloski et al. 2006) precedes the NRA on the surface of the WD, may be a response of the disk to the sudden increase in the influx of angular momentum, no less than to the increase in the rate of mass supply. This may be an additional reason for the prompt response of the disk to the changing rate of mass accretion.
In contrast, the two out of phase eruptions of H5 may be understood as instability events that erupted in the disk spontaneously. In this event too, the supply of matter to the disk was modulated by the P3 periodicity, in phase with the oscillations in all other H events, as evident in the low amplitude variation of the low lying points of the H5 event, as described in Section 4.4. However, the amount of material supplied to the disk in this event, and hence also of angular momentum, was obviously smaller than in all other H events. Due to the smallness of these two parameters, they disturbed the disk less sharply than in the common, more powerful maximum activity seasons of the giant. By saying that in H5 the disk instabilities occurred spontaneously we mean that the conditions for instability developed in the disk more slowly. The timing of their onset was regulated by the internal physics of the disk itself, as is the case in the common disk instability events in dwarf novae. This is why they are not in phase with all other P3 oscillations.
The small amplitude brightness variation during H5 that is in phase with the P3 periodicity possibly reflects the brightness response of the disk to the increase varying supply of material from the giant. It may also be the result of modest variations in the nuclear burning rate on the surface of the WD, due to variations in the rate of materials falling onto the WD surface either directly or after spiraling through the accretion disk.
6.2 Further possible results
In this section we report on two other findings in the LC of the star that are very much in line with our suggested scenario. The two additional features that we identify in the PS are, however, clearly below an appreciable statistical significance. We therefore do not consider them as proofs of our model. We do believe, however, that it is worthwhile mentioning them here for what they are, since if their reality is better confirmed by future observations, they do provide considerable support for our interpretation.
6.2.1 Sidereal spin signal
The inserts in the three frames of Fig. 2 are blow-ups in the y direction of the high frequency ends of the corresponding PSa. The arrows in frames (b) and (c) designated ”1”, are pointing at peaks corresponding to the periods 240.23.86 d in the L PS (Fig. 2 (b)), and 240.60.73 d in the H PS (Fig. 2 (c)). Well within the error in the peak position these number are precisely half the 482 value, one of the candidates for the sidereal spin period of the giant. A detection of a signal with 241 d periodicity is expected if there is a concentration of bright or dark spots around the magnetic poles of the rotating giant. Fig. 2 (a) shows, however, that the 241 d peak is absent from the PS of the entire LC, namely, the curve of the combined sequence of the low and the high states. This means that if the P=241 d is a real feature of Z And, there is a phase shift in this periodicity between the low and the high states of the system. If the 241 d periodicity is indeed half the spin period of the giant this would indicate that the hot or dark spots on the surface of the giant that are responsible for this light variations, change their location on the surface of the star between the two states of the system. For example they could be concentrated more around the poles in one state, moving towards the magnetic equator in the other. We note also that in the PS of the high state (Fig. 2 (c)) there is a weak signal also at P=484.32.97 d (peak ”2”).
Due to the low statistical significance of these signals we refrain from using them for making a choice between the possible values that we suggest for the sidereal spin period of the giant.
6.2.2 Ellipsoidal effect
Mikolajewska et al. (2002) report on preliminary results of IR observations that indicate the presence of an ellipsoidal effect in the LC of Z And. If the star is nearly filling its Roche lobe, a significant distortion of its outer layers from spherical symmetry is indeed expected. Such a distortion would be reflected in the LC of the system if the contribution of the giant photospheric light to the total optical luminosity of the system in the observed spectral region is not entirely negligible. We do find in the H LC a weak signal of a period which is half the orbital period, as expected for the ellipsoidal effect. Arrow ”3” in Fig. 2 (c) is pointing at a peak in the PS corresponding to the period 378.21.8 d. The peak is below any statistical significance and it is undetectable in Fig. 2 (b), the PS of the L LC. We therefore do not consider it as a positive detection of the ellipsoidal effect as stated above, in spite of the near perfect coincidence of its frequency with twice the orbital frequency. We nonetheless wanted to find out where an assumption that it is a true sign of the ellipsoidal shape of the giant could lead us.
Since the giant spin is not locked to the orbital revolution, the tidal bulge is noncollinear with the centres of the two stars. If the spin period is 482 or 352 d, the orbital angular velocity is slower than that of the spin and the bulge is leading in front this line (Lecar, Wheeler & McKee, 1976). By least squares we computed the sine wave of half the orbital period that best-fit the H LC. We compare this LC to the sine wave of the orbital period itself that is best fitted to the L state of the system. We found that one minimum of the ”ellipsoidal” LC is preceding the orbital minimum by 130 d. The other ”ellipsoidal” minimum is obviously preceding the maximum of the orbital cycle by the same number of days. In units of angle this means that the direction of the high tides protrusion is leading the binary centres line by 60∘. If the reality of the P2/2 signal could be confirmed, this result would be an important source of quantitative information about dissipative processes in the outer layers of the giant, those that are responsible for this noncollinearity.
7 Comparison with two other symbiotics
We have performed in the past time-series analysis similar to the one presented in this work, on the historical LCs of two other prototype symbiotics, BF Cyg and YY Her (paper II and III). The three symbiotic stars are very similar in the basic astronomical parameters that characterize the corresponding binary systems. Table 1 presents some of these parameters for the three stars. Thus Z And seems to become a third symbiotic system in which evidence for the operation of a solar-like magnetic dynamo cycle has been discovered. The stars harboring the process in the symbiotic systems are giants, whereas the Sun is a main sequence star. The intensity of the surface activity of the symbiotic giants is probably also different from that of the Sun, being of a more grandeur scale in the giants. Note, however, that the dramatic effects of the activity cycles of these stars are mainly due to the fact that they are members in interacting binary systems. The activity cycle on the giant is mainly a trigger for the vast outpour of energy, which is generated in the extreme conditions on and around the WD component of the symbiotic system. The quasi-periodicity of the phenomenon in all four stars is however of the same order of 15-20 yr.
The rotation rate of the giant of Z And is much more distant from synchronization with the orbital cycle than in the other two symbiotics. Thus the synodic period of the tidal wave in its outer atmosphere is much shorter than the dynamo magnetic cycle. In BF Cyg and YY Her, the near synchronization makes the spin-orbit beat period to be of the same order as that of the magnetic dynamo cycle. This is why in Z And we do not find in the LC any trace for an effect of the tides on the stellar magnetic cycle itself. This is also the case in the Sun with its spin period of merely 27 d. The tides in the Sun, excited primarily by Jupiter, are obviously also of a much smaller scale than in the symbiotics. In any event, in both Z And and in the Sun, over one activity cycle, the displacement vector due to the radial motion induced by tides averages to zero, since one activity cycle includes many tidal oscillations. In BF Cyg and YY Her, on the other hand, the radial oscillations of the outer envelope of the giant that are due to tides have the same characteristic time as that of the magnetic cycle itself. The role of tides in the creation and maintenance of the dynamo may therefore be comparable to that of differential rotation, convection and meridional flow that are currently believed to be at the dynamical roots of the magnetic dynamo phenomenon (paper III and references therein). This is why in these two stars the synodic period of the tide wave is manifested in the timing of the magnetic dynamo cycle of their corresponding giant components.
The giant of Z And is thus joining the class of stars that harbor magnetic dynamo process, as have been suggested already in the past (Soker 2002, Soker & Kastner 2003). In Z And, as well as in BF Cyg and YY Her, the observational effects of this phenomenon are gaining very large magnification, due to the binary interaction with the nearby WD companion. This strengthens the proposition that symbiotic stars may turn out to be important laboratories for studying the stellar magnetic dynamo cycle, an astronomical process that affects Earthlings directly.
8 Summary
New analysis of an updated optical LC of Z And covering the last 112–yr of the star history reestablishes the well known 759.1 d photometric periodicity of the star, known to be the binary orbital period of the system. The analysis confirms the semi-periodic nature of the outburst phenomenon of this symbiotic star. The characteristic time interval between the centres of successive outbursts is 7550 d. It is suggested that the quasi-periodicity of the outburst events is regulated by a solar-type magnetic dynamo process in the giant of the system. Enhanced mass loss during maximum phases of this activity cycle is the trigger and provides the fuel for the intense energy outpour of energy during outbursts, emanating mainly from the vicinity of the WD component. In addition to an increase by one magnitude or more in the mean brightness of the system, outbursts are also characterized by violent periodic oscillations. Our analysis reveals a persistent periodicity of P3=658 d of these oscillations that preserves its phase throughout the entire 112–yr of the observations. The oscillations result from periodic modulation of the mass accretion rate onto the WD component of the system, from the bulge of a tidal wave in the atmosphere of the giant which is fixed in the binary rotation frame. The synodic period of the tidal wave that circulates in the atmosphere of the giant is the measured P3 value, or twice this number. This is the beat period of the giant spin and the orbital periods of the system. The sidereal spin period of the giant is either 482 or 1790 d. It could also be 352 d or possibly 5000 d, if the giant is spinning in the retrograde direction.
| Table 1 Comparison of the properties of Z And, BF Cyg and YY Her | ||||||
| Z And | Ref. | BF Cyg | Ref. | YY Her | Ref. | |
| Giant Sp. Type | M4 III | 1 | M5 III | 1 | M4 III | 1 |
| Luminosity L | 620-1600 | 2 | 5200 | 2 | 1100 | 2 |
| Binary period | 759.0 | 5 | 757.3 | 3 | 593.2 | 4 |
| Giant Spin period | 482∗ | 6 | 798.8 | 3 | 551.4 | 4 |
| Tidal wave period | 1317 | 6 | 14580 | 3 | -7825 | 4 |
| Solar-type period | 7550 | 6 | 5375 | 3 | 4650 | 4 |
*) This is a slightly preferred number among four possible values.
1) Műrset & Schmid (1999), 2) Műrset et al. (1991), 3) Leibowitz & Formiggini (2006),
4) Formiggini & Leibowitz (2006), 5) Fekel et al. (2000), 6) This paper.
Acknowledgments
We acknowledge with thanks the variable star observations from the AAVSO International Database contributed by observers worldwide and used in this research. This research is supported by ISF - Israel Science Foundation of the Israeli Academy of Sciences.
References
- (1) Babcock H.W., 1961, ApJ, 133, 572
- (2) Bilenko I.A., 2002, A&A, 396, 657
- (3) Fekel F.C., Hinkle K.H., Joyce R.R., Skrutskie M.F., 2000, AJ, 120, 3255
- (4) Frnandez-Castro T., Cassatella A., Gimnes A., Viotti R., 1988, ApJ, 324, 1016
- (5) Fligge M., Solanki S.K., Beer J., 1999,A&A, 346, 313
- (6) Formiggini L., Leibowitz E.M., 1990, A&A, 227, 121
- (7) Formiggini L., Leibowitz E.M., 1994, A&A, 292, 534 (paper I)
- (8) Formiggini L., Leibowitz E.M., 2006, MNRAS, 372, 1325 (paper III)
- (9) Gromadzki M., Mikolajewski M., Tomov T., Bellas-Velidis I., Dapergolas A., Galan C., Acta Astron, 56,97
- (10) Kenyon S.J., Webbink R.F., 1984, ApJ, 279, 252
- (11) Kurtz D.W., 1990, ARA&A 28, 607
- (12) Lecar M., Wheeler J.C., McKee C.F., 1976, ApJ 205, 556
- (13) Leibowitz E.M., Formiggini L., 2006, MNRAS, 366, 675 (paper II)
- (14) Marsch E., 2006, Advances in Space Research, 38,921
- (15) Mikolajewska J, Kenyon S.J. 1996, AJ, 112, 1659
- (16) Mikolajewska J., Kolotilov E.A., Shenavrin V.I., Yudin B.F., 2002, in Gnsicke K, Beuermann K., Reinsch K. eds, Asp Conf. Ser. Vol 261, The Physics of Cataclismic Variables and Related objects, Astron. Soc. Pac., San Francisco, p.645
- (17) Műrset U., Nussbaumer H., Schmid H. M., Vogel M., 1991, A&AS, 248, 458
- (18) Műrset U., Schmid, H. M., 1999, A&AS, 137, 473
- (19) Mursula, K, Ulich Th., 1998, Geophysical Research letters, 25, 1837
- (20) Ofman, L., 2006, Advances in Space Research 38,64
- (21) Payne-Gaposhkin C., 1946, ApJ, 104,362
- (22) Scargle J.D., 1982, ApJ., 263, 835
- (23) Schmid H.M., Schild H., 1997, A&A, 327, 219
- (24) Schwarzenberg-Czerny A., 1998, MNRAS, 241, 153
- (25) Schwenn R. 2006, Space Science Review, 124, 51
- (26) Soker N., 2002, MNRAS, 337, 1038
- (27) Soker N., Kastner J. H., 2003, ApJ, 592, 498 2002, MNRAS
- (28) Sokoloski J. L., Bildstein, L., 1999, ApJ,517, 919
- (29) Sokoloski J. L. et al., 2006, ApJ, 636, 1002
- (30) Solanki S.K., Krivova N.A., Schűssler M., Fligge M., 2002, A&A, 396,1029