A two-armed pattern in flickering maps of the nova-like variable UU Aquarii††thanks: Based on observations made at the Laboratório Nacional de Astrofísica, CNPq, Brazil.
Abstract
We report the analysis of a uniform sample of 31 light curves of the nova-like variable UU Aqr with eclipse mapping techniques. The data were combined to derive eclipse maps of the average steady-light component, the long-term brightness changes, and low- and high-frequency flickering components. The long-term variability responsible for the ’low’ and ’high’ brightness states is explained in terms of the response of a viscous disk to changes of 20-50 per cent in the mass transfer rate from the donor star. Low- and high-frequency flickering maps are dominated by emission from two asymmetric arcs reminiscent of those seen in the outbursting dwarf nova IP Peg, and are similarly interpreted as manifestation of a tidally-induced spiral shock wave in the outer regions of a large accretion disk. The asymmetric arcs are also seen in the map of the steady-light aside of the broad brightness distribution of a roughly steady-state disk. The arcs account for 25 per cent of the steady-light flux and are a long-lasting feature in the accretion disk of UU Aqr. We infer an opening angle of for the spiral arcs. The results suggest that the flickering in UU Aqr is caused by turbulence generated after the collision of disk gas with the density-enhanced spiral wave in the accretion disk.
1 Introduction
In Cataclysmic Variables (CVs) a late-type star overfills its Roche lobe and transfers matter to a companion white dwarf (WD) via an accretion column or disk. The CV zoo comprises low-mass transfer dwarf novae and high-mass transfer novae and nova-like systems. The light curve of these binaries show intrinsic brightness fluctuations (flickering) of 0.1-1 mag on timescales from seconds to tens of minutes, considered a basic signature of accretion (Warner 1995). When the Roche lobe of the WD is suficiently large there is room for the accretion disk to expand beyond the 3:1 resonance radius and the tidal pull of the mass-donor star becomes relevant to the gas dynamics, giving rise to precessing elliptical rings (when the binary mass ratio , e.g. Whitehurst & King 1991) and spiral shock waves (e.g., Steeghs 2001) in the outer disk regions. While theoretical expectations and numerical simulations suggest (e.g., Osaki 1996; Kunze, Speith & Riffert 1997; Murray, Warner & Wickramasinghe 2000), an extensive study of superhumps allowed Patterson et al. (2005) to set an observational upper limit of for the creation of superhumps.
Earlier studies (Bruch 1992, 1996, 2000) led to the suggestion that there are mainly two sources of flickering in CVs, the stream-disk impact region at disk rim and a turbulent inner disk region in the vinicity of the WD (possibly the boundary layer), the relative importance of which varies from system to system. The spatially-resolved study of flickering in the dwarf nova V2051 Oph by Baptista & Bortoletto (2004, hereafter BB04) revealed a more complex scenario, in which the low-frequency flickering is associated to an overflowing gas stream (possibly as a consequence of unsteady mass transfer from the mass-donor star, e.g., Warner & Nather 1971) and the high-frequency flickering is distributed over the surface of the accretion disk – possibly as a consequence of magnetohydrodynamic (MHD) turbulence or events of magnetic reconnection at the disk chromosphere (Geertsema & Achterberg 1992; Kawagushi et al. 2000). The identification of a disk component to the flickering and the consequent estimation of the disk viscosity -parameter (Shakura & Sunyaev 1973) through the application of an MHD turbulence model, raised the expectation that the technique could be applied to measure the accretion disk viscosity of other CVs. In particular, the tight correlation between the flickering disk component and the steady-light emission in V2051 Oph (BB04) suggested that this could be the dominant source of flickering in nova-like systems, with their hot and bright accretion disks. An obvious next step would be to perform a spatially-resolved study of flickering on an eclipsing nova-like system to test these ideas.
UU Aqr is a bright eclipsing nova-like variable with an orbital period of 3.9 hr and a mass ratio (Baptista, Steiner & Cieslinski 1994; hereafter BSC). It shows conspicuous flickering activity (with flares which may reach 25% of the total system light), long-term () changes of 0.3 mag in brightness (atributted to variations in the mass transfer rate from the mass-donor star, BSC), as well as mag changes on timescales of days (interpreted as being ’stunted’ dwarf nova-type outbursts, Honeycutt, Robertson & Turner 1998). It also displays superhumps in its light curve (Patterson et al. 2005), suggesting the presence of a large, elliptical precessing accretion disk.
Here we report the analysis of a large sample of light curves of UU Aqr with eclipse mapping techniques to locate the sources of the flickering and to investigate the long-term brightness changes in this binary.
2 Observations
Time series of -band CCD photometry of UU Aqr were obtained with an EEV camera ( pixels, ) attached to the 0.6 m telescopes of the Laboratório Nacional de Astrofísica, in southern Brazil, from 1998 to 2001. The CCD camera is operated in frame transfer mode, with negligible (13 ms) dead time between exposures. It has a Global Positioning System board that sets its internal clock to UTC to an accuracy better than 10 ms. The observations are summarized in Table 1. Columns 2 and 8 list the number of points in the light curve (), columns 3 and 9 give the exposure time in seconds (). Columns 4 and 10 list the eclipse cycle number (E); the numbers in parenthesis indicate observations that, because of incomplete phase coverage or interruptions caused by clouds, do not cover the eclipse itself. Columns 6 and 12 give an estimate of the quality of the observations. The seeing ranged from to . The observations comprise 31 light curves obtained with the same instrument and telescope, which ensures a high degree of uniformity to the data set.
Data reduction procedures included bias subtraction, flat-field correction, cosmic rays removal and aperture photometry extraction. Time series were constructed by computing the magnitude difference between the variable and a bright reference comparison star E and S of the variable with scripts based on the aperture photometry routines of the APPHOT/IRAF package 111IRAF is distributed by National Optical Astronomy Observatories, which is operated by the Association of Universities for Research in Astronomy, Inc., under contract with the National Science Foundation.. Light curves of other comparison stars in the field were also computed in order to check the quality of the night and the internal consistency and stability of the photometry over the time span of the observations. The magnitude and colors of the reference star were tied to the Johnsons-Cousins UBVRI systems (Bessell 1990) from observations of this star and of standard stars (Graham 1982; Stone & Baldwin 1983) made on 4 photometric nights. We used the relations of Lamla (1981) to transform UBVRI magnitudes to flux units. The B-band flux of the reference star was then used to transform the light curves of the variable from magnitude difference to absolute flux. We estimate that the absolute photometric accuracy of these observations is about 12 per cent. On the other hand, the analysis of the light curves of field comparison stars of brightness comparable to that of the variable indicates that the internal error of the photometry is less than 2 per cent. The error in the photometry of the variable is derived from the photon count noise and is transformed to flux units using the same relation applied to the data. The individual light curves have typical signal-to-noise ratios of 40-60 out-of-eclipse and 10-20 at mid-eclipse.
3 Data analysis
The light curves were phase-folded according to the linear ephemeris (Borges 2005, private communication),
| (1) |
where gives the WD mid-eclipse times. Fig. 1 shows the light curves of UU Aqr superimposed in phase. The upper frame depicts the light curves of a comparison star with the same brightness of UU Aqr around mid-eclipse. The constancy of the comparison star flux over time indicates that all brightness variations seen in UU Aqr are intrinsic to the variable. The scatter with respect to the mean level is significantly larger in UU Aqr and is caused by a combination of flickering and long term brightness changes.
We applied the ‘single’ (Bruch 1996, 2000) and ‘ensemble’ (Horne & Stiening 1985; Bennie, Hilditch & Horne 1996) methods to the set of light curves of UU Aqr to derive the orbital dependency of its steady-light, long-term brightness changes, low- and high-frequency flickering components. The reader is referred to BB04 for a detailed description and combined application of both methods.
UU Aqr was in its ’high’ brightness state during the 1998 and 2001 observations, and in its ’low’ brightness state during the 1999 and 2000 runs. The curves of the ’high’ and ’low’ brightness states are identified in Fig. 1 by black and grey symbols, respectively. We remark that the average out-of-eclipse flux level increases steadily from the 1999 to the 2001 data and that the nominal separation between the ’low’ and ’high’ brightness states is a rather arbitrary one. Because of the scatter produced by the strong flickering (with an average pear-to-peak amplitude of mJy for both brightness levels), there is an overlap in flux between the curves of the ’low’ and ’high’ states. In order to test the influence of the brightness state on the flickering behaviour, we applied the ’ensemble’ method separately for the data of the ’high’ and ’low’ brightness states. We found no evidence of a dependency of the flux level or eclipse shape of the flickering curve with brightness level in UU Aqr. We therefore combined all light curves for the following analysis. The difference in average brightness level seen in UU Aqr along the observations is properly taken into account in the ensemble method by the curve of the long-term changes (see below, BB04).
In order to apply the ’ensemble’ method, we define a reference out-of-eclipse flux (the mean flux over the phase range ) for each individual light curve and we divide the data into a set of phase bins. A linear fit to the diagram for each phase bin (e.g., Fig. 2 of BB04) yields an average flux (the steady-light component), an angular coefficient (which measures the long-term change) and a standard deviation with respect to the linear fit (the scatter curve, with added contributions from the Poisson noise and the flickering). We multiply the non-dimensional angular coefficients by the amplitude of the variation of the reference flux in the data set, mJy, to express the long-term changes in terms of the amplitude of the flux change per phase bin, .
The average steady-light curve was subtracted from each individual light curve to remove the DC component and a Lomb-Scargle periodgram (Press et al. 1992) was calculated. The periodgrams of all light curves were combined to yield a mean periodgram and a standard deviation with respect to the mean. Fig. 2 shows the resulting average power density spectrum (PDS) binned to a resolution of 0.02 units in log(frequency). The PDS is well described by a power-law . It becomes flat for minutes) and disappears in the white noise for ). The slope of the PDS distribution is reminiscent of those seen in other CVs, which can be well described by power laws with an average exponent (Bruch 1992).
The ’ensemble’ method samples flickering at all frequencies. But because of the power-law dependency of the flickering, an ’ensemble’ curve is dominated by the low-frequency flickering components. On the other hand, the filtering process of the ‘single’ method produces curves which sample the high-frequency flickering. The combination of both methods allows one to separate the low- (ensemble) and high-frequency (single) components of the flickering.
The Achilles heel of the ’single’ method is its difficulty in separating the high-frequency flickering from the rapid brightness changes caused by the eclipse. In order to overcome this limitation, we subtracted the average steady-light curve from each individual light curve before applying the ’single’ filtering process to eliminate the steep gradients produced by the eclipse in the light curve. Our ’single’ light curve includes flickering components with frequencies (timescales shorter than , Fig. 2). Single curves obtained with cut-off frequencies of and show the same morphology of the lower cutoff frequency curve. Because of the reduced power, these other curves are noisier and will not be presented here.
The steady-light, long-term changes, and flickering curves were analyzed with eclipse mapping techniques (Horne 1985; Baptista & Steiner 1993) to solve for a map of the disk surface brightness distribution and for the flux of an additional uneclipsed component in each case. The uneclipsed component accounts for all light that is not contained in the eclipse map (i.e., light from the secondary star and/or a vertically extended disk wind). The reader is referred to Rutten, van Paradijs & Tinbergen (1992) and Baptista, Steiner & Horne (1996, hereafter BSH) for a detailed description of and tests with the uneclipsed component, and to Baptista (2001) for a recent review on the eclipse mapping method. Out-of-eclipse brightness changes (not accounted for by the standard eclipse mapping method) were removed from the light curves by fitting a spline function to the phases outside eclipse, dividing the light curve by the fitted spline, and scaling the result to the spline function value at phase zero (e.g., BSH).
Our eclipse map is a flat Cartesian grid of pixels centered on the white dwarf with side (where is the distance from the disk center to the inner Lagrangian point L1). The eclipse geometry is defined by the mass ratio and the inclination , and the scale of the map is set by . We adopted , and (BSC), which correspond to a white dwarf eclipse width of cycle. This combination of parameters ensures that the white dwarf is at the center of the map. The reconstructions were performed with a polar gaussian default function (Rutten et al. 1992) with radial blur width and azimuthal blur width , and reached a final reduced chi-square for all light curves. The uncertainties in the eclipse maps were derived from Monte Carlo simulations with the light curves using a bootstrap method (Efron 1982, Watson & Dhillon 2001), generating a set of 20 randomized eclipse maps (see Rutten et al. 1992). These are combined to produce a map of the standard deviations with respect to the true map. A map of the statistical significance (or the inverse of the relative error) is obtained by dividing the true eclipse map by the map of the standard deviations (Baptista et al. 2005).
4 Results
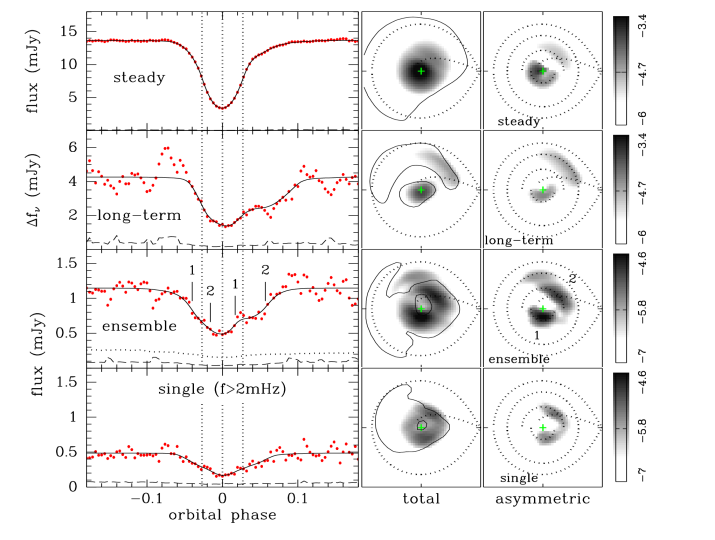
Light curves and corresponding eclipse maps are shown in Fig. 3. For a better visualization of structures in the disk brightness distributions, the asymmetric disk components are also shown. An asymmetric component is obtained by slicing the disk into a set of radial bins and fitting a smooth spline function to the mean of the lower half of the intensities in each bin. The spline-fitted intensity in each annular section is taken as the symmetric disk-emission component. The asymmetric disk component is then obtained by subtracting the symmetric disk from the original eclipse map (eg., Saito & Baptista 2006). This procedure removes the baseline of the radial distribution while preserving all azimuthal structure.
4.1 Steady-light and long-term changes
The steady-light light curve gives the flux per phase bin for the mid-reference flux level and represents the median steady brightness level along the data set. Because it is obtained by combining 31 light curves, it has high S/N and the corresponding eclipse map is of high statistical significance (typically ).
The eclipse map of the steady-light shows an extended brightness distribution peaking at disk center with two asymmetric arcs on roughly opposite disk sides (Fig. 3, top row). The asymmetries are diluted by the dominant broad disk brightness distribution and only become clear in the asymmetric disk component. The arcs account for per cent of the total flux of the steady light map. They are located at different radii, with the one in the trailing side (the lower disk hemisphere in the eclipse maps of Fig. 3) being closer to disk center. The asymmetric arcs do not coincide with the WD at disk center or bright spot at disk rim.
By transforming the intensities in the steady-light eclipse map into blackbody brightness temperatures (assuming a distance of 200 pc to the binary, BSH) we find that the radial temperature distribution closely follows the law for steady accretion in the outer disk and becomes flatter in the inner disk regions (), leading to estimated mass accretion rates of Ṁ at and Ṁ at . The brightness temperatures decrease steadily with radius, from at , to at (the radial range at which the asymmetric arcs are located), and at . We also find an uneclipsed component of per cent of the total steady-light flux. The inferred brightness temperatures, uneclipsed component and mass accretion rates are in good agreement with previous results (BSH, Baptista et al. 2000; Vrielmann & Baptista 2000).
The curve of the long-term changes measures brightness changes on timescales longer than the orbital period. It allows us to visualize the differences in disk structure between the observed ’low’ and ’high’ brightness states of UU Aqr.
The light curve of the long-term changes shows an eclipse with a pronouced shoulder at egress phases. The resulting eclipse map (Fig. 3, second row from top) has a bright source at disk center and an azimuthally extended () bright spot at disk rim, similar to those found in the eclipse maps of the ’high’ state of BSH. The uneclipsed component is negligible. This map tells us that the difference between the ’low’ and ’high’ brightness states is caused by an increase in the luminosity of the outer parts of the disk (as previously found by BSH) but also by a comparable increase in brightness of the innermost disk regions.
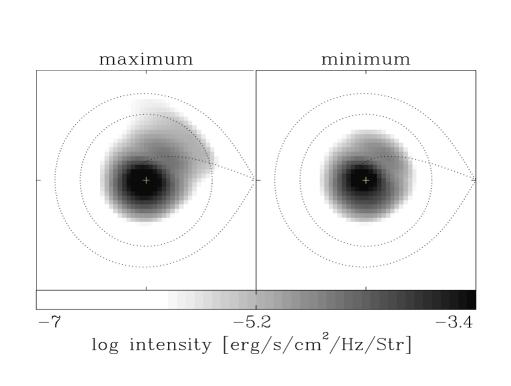
For a fixed distance, the intensities in the eclipse map scale linearly with the flux in the light curve (see, e.g., Baptista 2001). Because we choose to express the long-term changes curve in terms of the amplitude of the flux variation (Sect. 3), the intensities in the corresponding eclipse map are given in terms of the amplitude of the variation in intensity between the minimum and maximum brightness states in the data set, (where refers to each pixel in the eclipse map). Thus, eclipse maps representing the minimum and maximum brightness distributions can be obtained by adding/subtracting the appropriate proportion of the long-term changes map to/from the steady-light map, ,
| (2a) | |||
| (2b) |
As expected, the resulting minimum and maximum brightness maps (Fig. 4) are similar to the -band eclipse maps of the ’low’ and ’high’ brightness states of BSH (see their Fig. 3).
We now turn our attention to the interpretation of the structures seen in the long-term changes map. BSH suggested that the azimuthally extended spot seen in the ’high’ brightness state reflects long-term changes in luminosity caused by variations in mass input rate at the outer disk. Baptista et al. (2000) noted that it could alternatively be the signature of an elliptical (precessing) disk similar to those possibly present in SU UMa stars during super-outbursts.
In order to test the second possibility, we searched for the presence of superhumps in our data set. We combined the light curves for a given year of observations and computed Lomb-Scargle periodograms after removing the eclipses from the data. We find no statistically significant periodicities in the combined light curves at the range of frequencies near the orbital frequency. The only exception is the data of 1999 (JD 2,451,403-2,451,404, when UU Aqr was on its lowest brightness level along our data set), which presents a clear signal at the orbital frequency. A sine fit to the data shows that the peak occurs at phases cycle on all orbits, indicating that we are seeing the orbital hump and not a superhump. We remark that, because our observations focus on the eclipse and frame relatively short time intervals (of at most 2-3 consecutive orbits) on each night, they are not as sensitive to the presence of superhumps as the much more intensive and well sampled data of the campaign by Patterson et al. (2005). Therefore, the lack of positive identification of superhumps in our data indicates that, if present, the superhump signal was of low amplitude/intensity and would hardly be able to account for the extended bright spot seen in the long-term changes map. We are thus left with the explanation of BSH.
Can the bright source at inner disk also be explained in terms of changes in mass input rate? In order to answer this question, we took a reference steady-state disk model with mass accretion rate and computed the difference between the (blackbody) brightness distributions of a test steady-state model with () and the reference model. For an opaque steady-state disk, the change in effective temperature, , caused by a change in mass accretion rate, Ṁ, has the same radial dependency of the effective temperature (see, e.g., Frank, King & Raine 1992),
| (3) |
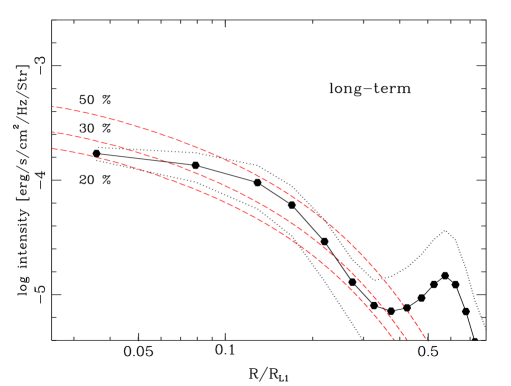
where is the WD radius. Thus, the difference in temperature (and the corresponding difference in blackbody intensity) between two steady-state disk models increases with decreasing radius and peaks near disk center (at ). The difference in intensity also scales with . In searching for the pair of () values of best fit to the observed brightness distribution we find and . Fig. 5 shows that the radial distribution of the central source of the long-term changes map is consistent, within the uncertainties, with the difference in intensity expected for an increase by 20-50 per cent in mass accretion rate of a steady-state disk with . Because the radial temperature distribution of the steady-light map is actually flatter than the law of steady-state disks, these results should be considered illustrative. Nevertheless, the inferred range of mass accretion rates () is in line with the values for the ’low’ and ’high’ brightness states found by BSH.
Because in a steady-state disk the mass accretion rate reflects the mass transfer rate, , we may interpret the map of the long-term changes in terms of the response of a high-viscosity disk to changes in of about 20-50 per cent. When increases, the luminosity of the bright spot at disk rim increases, as well as that of the inner disk regions – as a consequence of the increase of mass accretion through a disk close to a steady-state.
4.2 low- and high-frequency flickering
The ’ensemble’ and ’single’ curves show a double-stepped eclipse reminiscent of the occultation of the two-armed spiral structure seen in eclipse maps of the dwarf nova IP Peg in outburst (e.g., Baptista, Haswell & Thomas 2002; Baptista et al. 2005), and lead to similar two-armed asymmetric brightness distributions (Fig. 3, the two lowermost rows). The solid contour line overploted on each eclipse map depicts the 3- confidence level region as derived from the map of statistical significance in each case (Sect. 3). The asymmetric arcs are at or above the 3- confidence level in both maps. Vertical tick marks in the ’ensemble’ panel of Fig. 3 indicate the eclipse ingress/egress phases of the two bright arcs (labeled ’1’ and ’2’). Their location is depicted in the asymmetric component of the ensemble map. A simple comparison reveals that these are the same asymmetric arcs seen in the steady-light map. The major difference is that the arcs dominate the emission in the flickering maps (the asymmetric component account for 53 and 41 per cent of the total flux, respectively for the ’ensemble’ and ’single’ maps). As already noted, they do not coincide with the WD at disk center nor with the bright spot at disk rim.
Although it is possible to center the eclipse of source 1 by applying a phase shift to all light curves, this would lead to physically unplausible brightness distributions for the steady-light and long-term changes maps – with highly asymmetric brightness distributions where the main sources fall at positions which cannot be associated with either the WD, the bright spot or gas stream (e.g., the azimuthally extended spot in the long-term changes map would fall at the edge of the primary Roche lobe, far away from the gas stream trajectory). It is also not possible to interpret the observed asymmetries in terms of enhanced emission from an elliptical outer disk ring because the asymmetries lie well inside the disk, far from its edge. Given the similarities with the IP Peg eclipse maps (e.g., see Fig. 3 of Baptista et al. 2002) and the lack of plausible alternative explanations, we interpret the asymmetries in the flickering and steady-light maps as consequence of tidally-induced spiral shock waves in the accretion disk of UU Aqr (e.g., Sawada et al. 1986).
Arc 1 is in the trailing side of the disk at ; Arc 2 is in the leading side of the disk and is farther away from disk center, . The two arcs have azimuthal extent and radial extent . Baptista et al. (2005) devised a way to estimate the opening angle of the spirals from the azimuthal intensity distribution of the eclipse maps. We applied the same method to the flickering maps to estimate an opening angle of , indicating that the spiral arms in UU Aqr are more tightly wound than in IP Peg at outburst (, Baptista et al. 2005). They are also systematically closer to disk center than the arms seen in IP Peg (at average distances of 0.30 and , see Baptista et al. 2005). Because the opening angle of the spiral arms scales with the disk temperature (e.g., Steeghs & Stehle 1999), this suggests that the outer accretion disk of UU Aqr is cooler than that of IP Peg in outburst.
We find uneclipsed components of and per cent of the total flux, respectively for the ’ensemble’ and ’single’ maps. This suggests that a sizeable part of the flickering may arise from outside the orbital plane, perhaps in a vertically-extended disk chromosphere + wind.
The ’ensemble’ map samples flickering at all frequencies while the ’single’ map contains the high-frequency (timescales ) flickering components. It is possible to separate the contribution of the low-frequency flickering by subtracting the ’single’ map from the ’ensemble’ map.
Fig. 6 compares the relative amplitude of the low- (’ensemble’ - ’single’) and high-frequency (’single’) flickering components in UU Aqr. The radial run of the relative amplitudes are obtained by dividing the average radial intensity distribution of these two flickering maps by that of the steady-light. Dashed and dotted lines show the 1- limits on the average amplitude, respectively for the low- and high-frequency flickering. The large uncertainties reflect the scatter introduced by the asymmetric arcs in the radial bins. The two distributions are comparable, within the uncertainties. Flickering is negligible in the inner disk. The amplitude of the low-frequency flickering increases monotonically with radius, reaching 6 per cent of the total light at . The amplitude of the high-frequency flickering also increases with radius and peaks at the location of the spiral arms (). The distributions are not reliable for because of the reduced statistical significance of the flickering maps and the rapidly declining intensities in the steady-light map. The lower panel of Fig. 6 depicts the ratio of the ’single’ to the ’ensemble’ distributions and measures the contribution of the high-frequencies (’single’) to the total flickering. The high-frequency flickering accounts for a roughly constant fraction of per cent of the flickering signal at all radii. There is no apparent difference in radial behaviour between the low- and high-frequency flickering components, indicating that they not only arise from the same location but are also produced by the same physical mechanism.
We further notice that our data cover a time interval of about 4 yr and that the eclipse maps yield the average behaviour over this time scale – with the implication that the observed spiral shocks are a long-lasting feature in the accretion disk of UU Aqr.
5 Discussion
BB04 found two independent sources of flickering in their study of the dwarf nova V2051 Oph: the low-frequency flickering is associated to inhomogeneities in the mass transfer process, while the high-frequency flickering originates in the accretion disk, possibly as a consequence of MHD turbulence (Geertsema & Achterberg 1992) or events of magnetic reconnection in the disk surface (Kawagushi et al. 2000).
Contrary to the suggestion of Bruch (2000), UU Aqr shows no evidence of flickering arising from a turbulent inner disk or from the bright spot. And, in contrast to V2051 Oph, it shows no disk-related flickering component. However, its high- and low-frequency flickering have the same origin. They are produced in a two-armed pattern reminiscent of the tidally-induced spiral shocks seen in outbursting accretion disks of dwarf novae (Steeghs, Harlaftis & Horne 1997; Baptista et al. 2002). These shocks are produced by tidal effects when the disk expands beyond the 3:1 resonance radius. In a dwarf novae these spiral shocks are only seen during outburst, when the disk becomes hot and large. In a nova-like system, the spiral shocks may be a permanent feature if the hot disk is large enough for tidal effects to become relevant. The presence of spiral structures in the steady-light and flickering maps of UU Aqr is a likely indication that its accretion disk is large enough for the tidal pull of the mass-donor star to be relevant for the gas dynamics in the outer disk regions. This is in line with the detection of long-lasting superhumps in this binary (Patterson et al. 2005) – the tidal influence that leads to spiral density waves may also induce elliptical orbits in the outer disk regions. Because the spiral arms account for a small fraction of the steady-light and are not related to the broad and brighter steady emission centered in the disk, one might conclude that they are not the dominant source of viscous dissipation and angular momentum removal in the UU Aqr accretion disk.
Why do the asymmetric arcs flicker? We discuss three possibilities. One may consider that flickering is a consequence of unsteady dissipation of energy from a clumpy gas stream as it hits the two-armed spiral density wave in the disk (i.e., a mass transfer origin for the flickering, as proposed by Warner & Nather 1971). In this case the clumpy gas stream should also lead to detectable flickering at the location of the bright spot, where it first hits the accretion disk rim before reaching the spiral arms. However, while the bright spot is a significant light source in the long-term changes map (indicating that the stream-disk impact occurs at , farther out in the disk than the observed radial position of the spiral arms) it gives no contribution to the flickering. We may conclude that there is no evidence of clumpiness in the infalling gas stream and, therefore, we shall exclude this as a viable explanation. A second possibility is to consider that flickering arises from reprocessing at tidally-induced and vertically-thickened disk regions of unsteady irradiation from the boundary layer (a boundary layer/WD flickering, Bruch 1992). The problem with this explanation is similar to that of the previous one: it would be hard to explain why we do not see optical flickering directly from the innermost disk regions. The third and most promising possibility is to assume that the observed flickering is the consequence of turbulence generated by the shock of disk gas as it passes through the tidally-induced spiral density waves (i.e., a local origin for the flickering). Further numerical simulations of spiral shocks in accretion disks would be useful to verify the turbulent nature of the after-shock gas and to test if such turbulence could generate the observed power-law dependency [] of the resulting energy dissipation fluctuations.
Assuming that the disk gas moves in Keplerian orbits around the WD (BSC), the locations of the asymmetric arcs corresponds to Doppler velocities of and , respectively for arcs 1 and 2. Given that the after-shock gas is expected to have sub-Keplerian velocities ( per cent lower, see Steeghs & Stehle 1999; Baptista et al. 2005), these structures may appear as arcs of enhanced emission at velocities in the upper left (arc 2) and lower right (arc 1) quadrant on a Doppler tomogram. Kaitchuck et al. (1998) and Hoard et al. (1998) report that UU Aqr disk line-emission is largely asymmetric. Their tomograms show regions of enhanced emission which may be interpreted as arising from a two-armed spiral pattern in the disk. The asymmetry corresponding to arc 1 is clearly seen (e.g., see Fig. 6 of Hoard et al. 1998 and Fig. 15 of Kaitchuck et al. 1998), while that related to arc 2 may be blended with and hidden by the emission from the gas stream and bright spot impact site. This latter effect may help to explain the large mass ratio () inferred by Kaitchuck et al. (1998) by fitting the gas stream trajectory to the asymmetry in the upper left quadrant of their Doppler tomograms.
6 Summary
Our investigation of the sources of variability in UU Aqr indicates that the long-term changes giving rise to the ’low’ and ’high’ brightness states can be accounted for by changes in mass transfer rate of 20-50 per cent. A high S/N steady-light light curve reveal the presence of long-lasting (at least over a 4 yr period of the observations) asymmetric arcs in the accretion disk aside of the broad brightness distributions of a roughly steady-state disk. The arcs are interpreted as the consequence of tidally-induced spiral shocks in an extended and hot accretion disk. The spiral arms account for 25 per cent of the steady-light flux and are the dominant source of flickering, both at low- and high-frequencies. They are more tightly wound than the spiral shocks found in the outbursting dwarf nova IP Peg. The observed flickering shows a power spectrum density with an power-law dependency, and is best explained as resulting from turbulence generated after the collision of disk gas with the density-enhanced spiral wave in the accretion disk. There is no evidence of flickering originating in the bright spot at disk rim or in the innermost disk regions around the WD.
References
- (1) Baptista, R. 2001. in Astrotomography, Indirect Imaging Methods in Observational Astronomy, Lecture Notes in Physics 573, ed. H. M. J. Boffin, D. Steeghs, & J. Cuypers (Berlin: Springer), 307
- (2) Baptista, R., & Bortoletto, A., 2004. AJ, 411, 128 (BB04)
- (3) Baptista, R., Haswell, C. A., & Thomas, G., 2002. MNRAS, 334, 198
- (4) Baptista, R., Morales-Rueda, L., Harlaftis, E. T., Marsh, T. R., & Steeghs, D., 2005. A&A, 444, 201
- (5) Baptista, R., Silveira, C., Steiner, J. E., & Horne, K., 2000. MNRAS, 314, 713
- (6) Baptista, R., & Steiner, J. E. 1993. A&A, 277, 331
- (7) Baptista, R., Steiner, J. E., & Cieslinski, D., 1994. ApJ, 433, 332 (BSC)
- (8) Baptista, R., Steiner, J. E., & Horne, K., 1996. MNRAS, 282, 99 (BSH)
- (9) Bennie, P. J., Hilditch, R., & Horne, K., 1996. in IAU Colloq. 158, Cataclysmic Variables and Related Objects, ed. A. Evans & J. H. Wood (Dordrecht: Kluwer), 33
- (10) Bessell, M. A. 1990. PASP, 102, 1181
- (11) Bruch, A., 1992. A&A, 266, 237
- (12) Bruch, A., 1996. A&A, 312, 97
- (13) Bruch, A., 2000. A&A, 359, 998
- (14) Efron, B., 1982. The Jackknife, The Bootstrap and Other Resampling Plans (SIAM, Philadelphia 1982)
- (15) Frank, J., King, A., & Raine D. 1992. Accretion Power in Astrophysics (2nd. edition, Cambridge: Cambridge Univ. Press)
- (16) Graham, J. A., 1982. PASP, 94, 244
- (17) Geertsema, G. T. & Achterberg, A. 1992. A&A, 255, 427
- (18) Hoard, D. W., Still, M. D., Szkody, P., Smith R. C., Buckley, D. A. H., 1998. MNRAS, 294, 689
- (19) Horne, K. 1985. MNRAS, 213, 129
- (20) Horne, K., & Stiening, R. F., 1985. MNRAS, 216, 933
- (21) Honeycutt, R. K., Robertson, J. W., & Turner, G. W., 1998. AJ, 115, 2527
- (22) Kaitchuck, R. H., Schlegel, E. M., White II, J. C., Mansperger, C. S., 1998. ApJ, 499, 444
- (23) Kawaguchi, T., Mineshige, S., Machida, M., Matsumoto, R. & Shibata K. 2000. PASJ, 52, L1
- (24) Kunze, S., Speith, R., & Riffert, H., 1997. MNRAS, 289, 889
- (25) Murray, J. R., Warner, B., & Wickramasinghe, D. T., 2000. MNRAS, 315, 707
- (26) Lamla, E. 1981. in Landolt-Börnstein - Numerical Data and Functional Relationships in Science and Technology, Vol. 2, eds. K. Schaifers & H. H. Voigt (Berlin: Springer-Verlag)
- (27) Osaki, Y., 1996. PASP, 108, 39
- (28) Patterson, J., et al., 2005. PASP, 117, 1204
- (29) Press, W. H., Flannery, B. P., Teukolsky, S. A., & Vetterling, W. T., 1992. Numerical Recipes in C (Cambridge: Cambridge University Press)
- (30) Rutten, R. G. M., van Paradijs, J. & Tinbergen, J. 1992. A&A, 260, 213
- (31) Saito, R. K, & Baptista, R. 2006. AJ, 131, 2185
- (32) Sawada, K., Matsuda, T., & Hachisu, I., 1986. MNRAS, 219, 75
- (33) Shakura, N. I. & Sunyaev, R. A. 1973. A&A, 24, 337
- (34) Steeghs, D. 2001. in Astrotomography, Indirect Imaging Methods in Observational Astronomy, Lecture Notes in Physics 573, ed. H. M. J. Boffin, D. Steeghs, & J. Cuypers (Berlin: Springer), 45
- (35) Steeghs, D., Harlaftis, E. T., & Horne, K, 1997. MNRAS, 290, L28
- (36) Steeghs, D., & Stehle, R., 1999, MNRAS, 307, 99
- (37) Stone, R. P. S., & Baldwin, J. A., 1983. MNRAS, 204, 347
- (38) Warner, B. 1995. Cataclysmic Variable Stars (Cambridge: Cambridge University Press)
- (39) Warner, B. & Nather, R. E. 1971. MNRAS, 152, 219
- (40) Watson, C. A., & Dhillon, V. S., 2001. MNRAS, 326, 67
- (41) Whitehurst, R., & King, A., 1991. MNRAS, 249, 25
- (42) Vrielmann, S., & Baptista, R., 2002. Astron. Nach., 323, 75
| HJD start | E aa with respect to the ephemeris of eq. (1). | phase | Quality bb sky conditions: A= photometric (main comparison stable), B= good (some sky variations), C= poor (large variations and/or clouds). | HJD start | E aa with respect to the ephemeris of eq. (1). | phase | Quality bb sky conditions: A= photometric (main comparison stable), B= good (some sky variations), C= poor (large variations and/or clouds). | ||||
|---|---|---|---|---|---|---|---|---|---|---|---|
| (2.450.000+) | (s) | (cycle) | range | (2.450.000+) | (s) | (cycle) | range | ||||
| 1047.6259 | 368 | 10 | (28734) | A | 1782.5171 | 999 | 10 | 33227 | B | ||
| 1047.6683 | 1446 | 10 | 28735 | A | 1782.6490 | 433 | 10 | (33228) | C | ||
| 1050.4957 | 506 | 10 | 28752 | A | 1787.6155 | 347 | 10 | 33258 | C | ||
| 1050.6815 | 339 | 10 | 28753 | A | 2136.5369 | 649 | 10 | 35391 | B/C | ||
| 1052.4647 | 1179 | 7 | 28764 | B | 2136.6232 | 538 | 10 | (35392) | B/C | ||
| 1052.5936 | 1322 | 7 | 28765 | B | 2137.4796 | 1079 | 10 | 35397 | B | ||
| 1053.5675 | 1397 | 8 | 28771 | B/C | 2137.6048 | 1413 | 10 | 35398 | B | ||
| 1053.7460 | 201 | 20 | (28772) | B/C | 2138.4690 | 676 | 15 | 35403 | B | ||
| 1054.6388 | 169 | 15 | (28777) | C | 2138.5863 | 756 | 15 | 35404 | B | ||
| 1055.5546 | 265 | 10 | (28783) | C | 2138.7499 | 550 | 15 | 35405 | B | ||
| 1403.4937 | 898 | 10 | 30910 | B | 2139.4636 | 590 | 15 | 35409 | B | ||
| 1403.6550 | 885 | 10 | 30911 | B | 2139.5678 | 886 | 15 | 35410 | A | ||
| 1404.4772 | 1068 | 10 | 30916 | B | 2139.7313 | 604 | 15 | 35411 | A | ||
| 1404.6009 | 1242 | 10 | 30917 | B | 2140.6193 | 380 | 15 | 35416 | C | ||
| 1404.7644 | 563 | 10 | (30918) | B | 2141.5954 | 192 | 15 | 35422 | B/C | ||
| 2141.7556 | 346 | 15 | 35423 | B/C |