The relation between stellar populations, structure and environment for dwarf elliptical galaxies from the MAGPOP-ITP.
Abstract
Dwarf galaxies, as the most numerous type of galaxy, offer the potential to study galaxy formation and evolution in detail in the nearby Universe. Although they seem to be simple systems at first view, they remain poorly understood. In an attempt to alleviate this situation, the MAGPOP EU Research and Training Network embarked on a study of dwarf galaxies named MAGPOP-ITP (Peletier et al., 2007). In this paper, we present the analysis of a sample of 24 dwarf elliptical galaxies (dEs) in the Virgo Cluster and in the field, using optical long-slit spectroscopy. We examine their stellar populations in combination with their light distribution and environment. We confirm and strengthen previous results that dEs are, on average, younger and more metal-poor than normal elliptical galaxies, and that their [/Fe] abundance ratios scatter around solar. This is in accordance with the downsizing picture of galaxy formation where mass is the main driver for the star formation history. We also find new correlations between the luminosity-weighted mean age, the large-scale asymmetry, and the projected Virgocentric distance. We find that environment plays an important role in the termination of the star formation activity by ram pressure stripping of the gas in short timescales, and in the transformation of disky dwarfs to more spheroidal objects by harassment over longer timescales. This points towards a continuing infall scenario for the evolution of dEs.
keywords:
galaxies : dwarf - galaxies : formation - galaxies : evolution1 Introduction
Dwarf galaxies are the lowest mass galaxies in the universe, and are the most common galaxy type. Particularly, dwarf elliptical galaxies111In this paper, we use dE for all low-luminosity () early-type galaxies: dwarf elliptical, dwarf lenticular and dwarf spheroidal galaxies. (dEs) are the dominant galaxy population in galaxy clusters, and their evolved nature and abundance makes them ideal targets for detailed study (Sandage, Binggeli & Tammann, 1985; Ferguson & Binggeli, 1994). Their properties and evolution also reveal much about galaxy formation in general, and can serve as a test of cosmological models. According to the widely accepted CDM hierarchical merging scenario, dwarf-size dark matter halos are the first to form, and higher mass galaxies are thought to form from the merging of these low-mass systems (e.g. White & Rees, 1978; White & Frenk, 1991). By studying dwarf galaxies we can therefore potentially study the first galaxies, or at least those galaxies with very simple formation histories.
However, it appears that, observationally, the star formation in lower mass galaxies is shut off, or exhausted, later than in giant galaxies or, in other words, that massive galaxies formed earlier and more quickly (Cowie et al., 1996; Gavazzi, Pierini & Boselli, 1996; Boselli et al., 2001; Caldwell, Rose & Concannon, 2003; Nelan et al., 2005; Bundy et al., 2006). Although seemingly anti-hierarchical, this behaviour can be reproduced in semi-analytic simulations of galaxy formation in a CDM cosmology (De Lucia et al., 2006). This “downsizing” puts the observational study of dwarf and low-mass galaxies into a new focus. Although some dEs in clusters have old stellar populations, as seen through their globular cluster systems (Beasley et al., 2006; Conselice, 2006), it is clear that not all dwarfs have a single formation event, but appear to form in several star formation episodes.
Detailed study of dwarfs in groups, especially in the Local Group, reveals that most dEs have a broad star formation history, with many appearing to have a star formation burst or event in the past few Gyr (e.g. Mateo, 1998; Grebel, Gallagher & Harbeck, 2003). Nearly all of these Local Group dwarfs also have old stellar populations that date back to roughly the time of reionisation. These results, however, are based on the study of resolved stellar populations, and more distant dwarfs cannot be as easily studied. Based on the velocity distribution of the dE population as a whole (Conselice, Gallagher & Wyse, 2001), and on their stellar populations (e.g. Caldwell, Rose & Concannon, 2003; Poggianti et al., 2001; Rakos et al., 2001; van Zee, Barton & Skillman, 2004), evidence accumulated to date suggests that dEs in nearby clusters have a mixed origin. Some have properties consistent with an old primordial formation, while others appear to be more recently formed from accreted field galaxies. It is thus becoming clear that dEs are not just small Es with simple, old and metal-poor stellar populations.
An independent test of the star formation history of galaxies comes from their integrated stellar populations and, more specifically, from their [/Fe] abundance ratios (Worthey, Faber & Gonzalez, 1992). Since elements, such as Mg, are mainly produced on short timescales by type II supernovae, while most of the Fe is formed later by type Ia supernovae, the observed super-solar [/Fe] abundance ratios in giant ellipticals (Es) is attributed to short formation timescales. The observed correlation of [/Fe] abundance ratio and galaxy mass is again a manifestation of the downsizing (Vazdekis, Trujillo & Yamada, 2004; Thomas et al., 2005; Nelan et al., 2005). Gorgas et al. (1997) were the first to recognise that Virgo dEs are consistent with solar [/Fe] abundance ratios, pointing to a more gradual chemical evolution in low-mass systems. Later studies have confirmed these results and also found that on average, dEs have lower metallicities and younger ages than normal Es (Geha, Guhathakurta & van der Marel, 2003; van Zee, Barton & Skillman, 2004).
Scenarios for the formation and evolution of dEs are still actively debated. On the one hand, internal processes play a role, mainly through supernova feedback. On the other hand, because of their low masses, the properties of dwarf galaxies are expected to depend strongly on the environment they reside in. For example, the morphology-density relation, also observed for massive galaxies, is indeed very strong for low-mass galaxies (e.g. Binggeli, Tammann & Sandage, 1987).
Supernova feedback regulates and/or suppresses star formation, eventually leading to gas exhaustion through star formation and/or to gas expulsion through galactic winds (e.g. Davies & Phillipps, 1988; Carraro et al., 2001; Dekel & Woo, 2003). Invoking only internal processes can reproduce observed structural and kinematical correlations for dEs (de Rijcke et al., 2005), but of course not the morphology-density relation. In a dense environment a variety of external processes act on galaxies and may even transform late-type galaxies into early-type galaxies. This transformation depends on the environment and involves several mechanisms. For instance, ram-pressure stripping by the hot intracluster medium can deprive a galaxy of its gas (Gunn & Gott, 1972), while harassment by galaxy-galaxy interactions transforms disks into more spheroidal objects (Moore, Lake & Katz, 1998). For an extensive review on these, and other, environmental effects see Boselli & Gavazzi (2006). Observations of rotation in dEs, and the existence of dEs with residual disk structure, support the idea that some dEs are transformed late-type spiral or dwarf irregular galaxies (Pedraz et al., 2002; Simien & Prugniel, 2002; De Rijcke et al., 2003a; Geha, Guhathakurta & van der Marel, 2003; van Zee, Skillman & Haynes, 2004; Lisker, Grebel & Binggeli, 2006).
Given the importance of dwarf galaxies and the fact that we still do not know what mechanisms play the dominant role in their formation and evolution, the MAGPOP EU Research and Training Network embarked on an observational project to study the star formation history of dwarf galaxies. In the framework of an International Time Programme (ITP) we used a variety of telescopes and instruments at the Roque de los Muchachos Observatory in La Palma to study the structure, dynamics and stellar populations in a large sample of dwarf galaxies ((see Peletier et al., 2007). In this paper we present the first results of this project, examining the ages, metallicities and abundance ratios of dEs and their relation to their stellar light distribution and environment, using intermediate-resolution optical spectra.
In the next section we describe the sample, the observations and the data reduction. In Section 3, we report the results from our analysis of the indices (3.1), ages, metallicities and abundance ratios (3.2), the stellar light distributions (3.3) and the Virgocentric distance (3.4). We discuss the implications of our results on the formation and evolution scenarios for dEs in Section 4. Finally we summarise our conclusions in Section 5.
2 Sample, observations and data reduction
| galaxy | alt. name | RA (J2000) | DEC (J2000) | Type | note | ||||
| (h, m, s) | (,′,″) | (″) | (Mpc) | (mag) | (mag) | ||||
| (1) | (2) | (3) | (4) | (5) | (6) | (7) | (8) | (9) | (10) |
| M 32 | NGC 221 | 00:42:41.84 | +40:51:57.4 | cE2 | — | 1.97 | 8.89 | ||
| ID 0650 | UGC 8986 | 14:04:15.87 | +04:06:43.9 | S0? | — | 17.8 | 15.06 | ||
| ID 0734 | PGC 1007217 | 02:41:35.08 | 08:10:24.8 | — | — | 22.0 | 15.92 | ||
| ID 0872 | PGC 1154903 | 02:42:00.37 | +00:00:52.3 | — | — | 16.0 | 17.03 | ||
| ID 0918 | CGCG 020-039 | 14:58:48.76 | +02:01:24.9 | E | — | 25.9 | 14.81 | ||
| ID 1524 | NGC 5870 | 15:06:33.86 | +55:28:46.0 | S0? | — | 11.8 | 14.83 | ||
| VCC 0021 | IC 3025 | 12:10:23.14 | +10:11:18.9 | dS0(4) | 11.95 | 17.0 | 14.91 | ||
| VCC 0308 | IC 3131/3132 | 12:18:50.77 | +07:51:41.3 | dS0,N: | 17.11 | 23.0 | 14.42 | ||
| VCC 0397 | CGCG 042-031 | 12:20:12.25 | +06:37:23.6 | dE5,N | — | 23.0 | 15.18 | ||
| VCC 0523 | NGC 4306 | 12:22:04.13 | +12:47:15.1 | dSB0,N | 17.90 | 17.0 | 13.81 | ||
| VCC 0856 | IC 3328 | 12:25:57.93 | +10:03:13.8 | dE1,N | 14.32 | 23.0 | 14.48 | 1 | |
| VCC 0917 | IC 3344 | 12:26:32.40 | +13:34:43.8 | dE6 | 9.29 | 17.0 | 15.45 | 1,2 | |
| VCC 0990 | IC 3369 | 12:27:16.91 | +16:01:28.4 | dE4,N | — | 17.0 | 14.88 | 2 | |
| VCC 1087 | IC 3381 | 12:28:14.88 | +11:47:23.7 | dE3,N | 15.93 | 17.0 | 14.38 | 1 | |
| VCC 1122 | IC 3393 | 12:28:41.74 | +12:54:57.3 | dE7,N | 11.82 | 17.0 | 14.86 | 2 | |
| VCC 1183 | IC 3413 | 12:29:22.49 | +11:26:01.8 | dS0,N | 15.31 | 17.0 | 14.37 | ||
| VCC 1261 | NGC 4482 | 12:30:10.35 | +10:46:46.3 | dE5,N | 17.34 | 17.0 | 13.72 | 1,2 | |
| VCC 1431 | IC 3470 | 12:32:23.39 | +11:15:47.4 | dE0,N | 8.14 | 17.0 | 14.38 | ||
| VCC 1549 | IC 3510 | 12:34:14.85 | +11:04:18.1 | dE3,N | 11.61 | 17.0 | 14.86 | ||
| VCC 1695 | IC 3586 | 12:36:54.79 | +12:31:12.3 | dS0 | 13.72 | 17.0 | 14.67 | ||
| VCC 1861 | IC 3652 | 12:40:58.60 | +11:11:04.1 | dE0,N | 13.83 | 17.0 | 14.47 | ||
| VCC 1910 | IC 809/3672 | 12:42:08.68 | +11:45:15.9 | dE1,N | — | 17.0 | 14.27 | ||
| VCC 1912 | IC 810 | 12:42:09.12 | +12:35:48.8 | dS0,N | 16.38 | 17.0 | 14.25 | ||
| VCC 1947 | CGCG 043-003 | 12:42:56.36 | +03:40:35.6 | dE2,N | 9.15 | 17.0 | 14.65 | 1 |
| galaxy | night | P.A. | exp |
|---|---|---|---|
| (deg) | (s) | ||
| M 32 | 30 Dec 05 | 170 | |
| ID 0650 | 4 Apr 06 | 140 | |
| ID 0734 | 29 Dec 05 | 15 | |
| ID 0872 | 30 Dec 05 | 105 | |
| ID 0918 | 4 Apr 06 | 175 | |
| ID 1524 | 5 Apr 06 | 25 | |
| VCC 0021 | 6 Apr 06 | 100 | |
| VCC 0308 | 4 Apr 06 | 110 | |
| VCC 0397 | 5 Apr 06 | 135 | |
| VCC 0523 | 5 Apr 06 | 3a | |
| VCC 0856 | 29 Dec 05 | 105 | |
| VCC 0917 | 6 Apr 06 | 57 | |
| VCC 0990 | 4 Apr 06 | 135 | |
| VCC 1087 | 30 Dec 05 | 110 | |
| VCC 1122 | 4 Apr 06 | 132 | |
| VCC 1183 | 6 Apr 06 | 167 | |
| VCC 1261 | 29 Dec 05 | 145 | |
| VCC 1431 | 5 Apr 06 | 165 | |
| VCC 1549 | 5 Apr 06 | 10 | |
| VCC 1695 | 6 Apr 06 | 40 | |
| VCC 1861 | 30 Dec 05 | 0 | |
| VCC 1910 | 29 Dec 05 | 5 | |
| VCC 1912 | 4 Apr 06 | 166 | |
| VCC 1947 | 6 Apr 06 | 125 |
a The major axis position angle of VCC 523 is 175 deg. We chose 3 deg to also include VCC 522 in the slit.
2.1 Sample
A detailed description of the sample selection for the MAGPOP-ITP dwarf galaxies will be presented in Peletier et al. (2007). In summary, the galaxies were selected to have been observed, but not necessarily detected, by GALEX. For the Virgo sample we then selected galaxies with , classified as dE or dS0 in the Virgo Cluster Catalogue (VCC: Binggeli, Sandage & Tammann, 1985). This yields 43 objects, of which we observed 18, giving preference to those with highest central surface brightness. Therefore, all but two of the observed dEs are nucleated (dE,N; see Table 1), i.e. they have an unresolved central light excess (Binggeli, Sandage & Tammann, 1985).
For the field sample we queried SDSS for nearby dwarf galaxies ( and mag)222The absolute magnitudes were computed using the SDSS radial velocities and assuming a Hubble constant .. To select quiescent dwarf galaxies, we then applied a colour cut in UV colours (GALEX: ), or in optical colours (SDSS: ) if there where non-detections in the UV. These colour cuts maximise the separation in star-forming and quiescent galaxies in the Virgo sample (see Peletier et al., 2007). Visual inspection of this selected sample yielded 10 objects. However, from the SDSS spectroscopic data, we found that three of these 10 contain emission lines. Because emission lines are hard to remove accurately from the intermediate-resolution spectra we analyse here, we did not include these galaxies in the sample presented here. One of them (NGC 3073) will be the subject of an extensive analysis based on high-resolution spectroscopy (Toloba et al., 2007). We were mostly limited by visibility constraints and observed only 5 field dEs.
Finally, we also observed M 32 to compare to previous studies. In Table 1, the sample galaxies and some of their properties are listed. In column 1 we give the name of the galaxies, either by their number in the VCC catalogue, or by their GALEX identification number (ID), while in column 2 we give alternative names. Columns 3 and 4 list the galaxy positions. For column 5 we take the morphological type given by NED (for the field dEs) or by VCC (for the Virgo dEs). Column 6 gives, if available, the -band effective radius in arcseconds, taken from the GOLDMine database (Gavazzi et al., 2003). Columns 7 lists the distance to the galaxies. For M 32 we take the distance from the HYPERLEDA database. (Paturel et al., 2003). For the field galaxies we calculate the distance based on their radial velocity and assuming . The distances to the Virgo galaxies are estimated using their position in the Virgo Cluster (Gavazzi et al., 1999). The apparent magnutides (column 8) are taken from the HYPERLEDA database, and the absolute blue magnitudes (column 9) are computed using the listed distances and apparent magnitudes. Finally, in column 10 we indicate which galaxies have also been observed by Geha, Guhathakurta & van der Marel (2003) (1), and by van Zee, Barton & Skillman (2004) (2).
2.2 Observations and data reduction
The observations were carried out on 29–30 December 2005 and 4–6 April 2006 with the 2.5m Nordic Optical Telescope (NOT) using ALFOSC with grism #14 (600 rules mm-1 and blazed at Å) and slit333Although the name of the used slit is 1.2″, the actual measured width is 1.0″. See the ALFOSC page for more details: http://www.not.iac.es/instruments/alfosc/slits.html 1.2″. The wavelength coverage is Å and the resolution is 6.8 Å (FWHM), or km s-1 around 5200 Å. The detector was an E2V Technologies back-illuminated CCD with active + 50 overscan pixels on both sides, with a pixel size of m, and a plate scale of pixel-1. At the beginning of most of the nights there was thin cirrus, and the seeing varied between 0.8–1.5″(FWHM). Typical integration times were from one hour, up to 3 hours for the faintest galaxies (see Table 2).
The data reduction was carried out using MIDAS444The image processing package ESO-MIDAS is developed and maintained by the European Southern Observatory. and REDUCEME555http://www.ucm.es/info/Astrof/software/reduceme/reduceme.html (Cardiel, 1999). All frames were overscan and bias subtracted, flat-fielded using dome and twilight flats and cosmic ray events were removed. For the wavelength calibration we obtained He arcs at each telescope position.
During twilight we observed standard stars drawn from the Lick/IDS (Worthey et al., 1994) and MILES (Sánchez-Blázquez et al., 2006c)stellar libraries, spanning a range of spectral types (see Table 6). Since the MILES catalogue is carefully flux-calibrated, we used these stars as spectrophotometric standards, as well as velocity templates. Finally we de-redshifted the galaxy spectra. Given the spectral resolution of km s-1 and the expected galactic velocity dispersions, km s-1, it is not possible to measure the internal dispersions. A kinematic analysis is therefore beyond the scope of this paper and will be addressed in a subsequent paper (Toloba et al., 2007) using high-resolution spectroscopy. All galaxies have been observed with the slit along the major axis, determined from SDSS surface photometry analysis, except for VCC 0523, where we positioned the slit to simultaneously observe VCC 0522 (see Table 2).
2.3 Index calibration
In this paper, we work with flux-calibrated, one-dimensional spectra, obtained by summing the central 4″ in each galaxy. Given the typical effective radius , this corresponds to about . To be able to work with the information contained in the spectra, we have determined Lick/IDS indices, allowing us easy comparisons with the literature and some stellar population models (see below). However, the reduced spectra are also available on simple request, allowing the reader to measure their own indices at their preferred spectral resolution, or to use all the available information.
To measure indices in the Lick/IDS system, we broadened our spectra to the Lick/IDS resolution ( Å (FWHM), depending on the wavelength, see Table 7). Then we measure indices using the pass-bands defined in Worthey et al. (1994) and Worthey & Ottaviani (1997). We observed standard stars from in the original Lick/IDS stellar library (Table 6) to determine possible systematic offsets resulting from the non-flux-calibrated response of the Lick/IDS system (Table 7). See Appendix A for more details on the transformation to the Lick/IDS system and Appendix B for a table with all the measured indices. In none of the galaxies in the sample do we detect [OIII] emission, thus we do not correct the H absorption for possible contamination by emission. If such emission were present, it would make the measured H absorption smaller, and therefore the derived ages older.
To derive ages, metallicities and abundance ratios, we use predictions of single-age, single-metallicity stellar population (or simple stellar population or SSP) models, in particular those of Thomas, Maraston & Bender (2003a) (TMB03) and Vazdekis et al. (1996) (V96), as updated in Vazdekis (1999) and Vazdekis et al. (2003). One should keep in mind that SSPs that are based on observational stellar libraries might not be solar-scaled at every metallicity, because of the limitations of the input library. One could expect that models are solar-scaled at high metallicity because here stars in the solar neighbourhood are being used, while at low metallicity the models may be -enhanced because low-metallicity stars in the observational library are generally somewhat -enhanced (Maraston et al., 2003). TMB03 tried to correct for this bias by assuming an /Fe - metallicity relation for the abundances of the input stars. The underlying stellar isochrones in both the V96 and TMB03 models are scaled solar for all metallicities. It is instructive to see how well the results obtained using different models agree, and that the choice of model does not bias the conclusions obtained here in any way.
2.4 Comparison data
In order to compare the behaviour of dEs with that of normal Es, we use the sample of 98 early-type galaxies from Sánchez-Blázquez et al. (2006a) (SB06), who provided us with indices measured within the central 4″ (Sánchez-Blázquez, 2007). This sample contains a range of early-type galaxies of all luminosities in dense (Coma) and less dense (Virgo and field) environments.
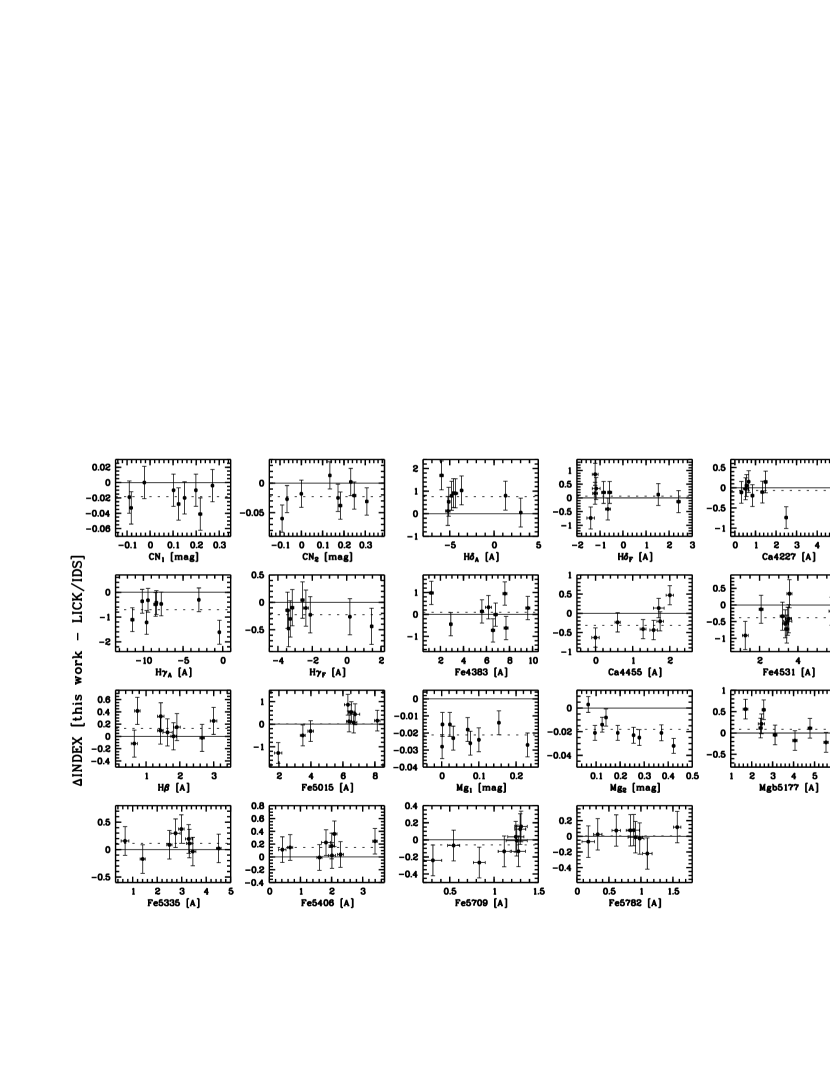
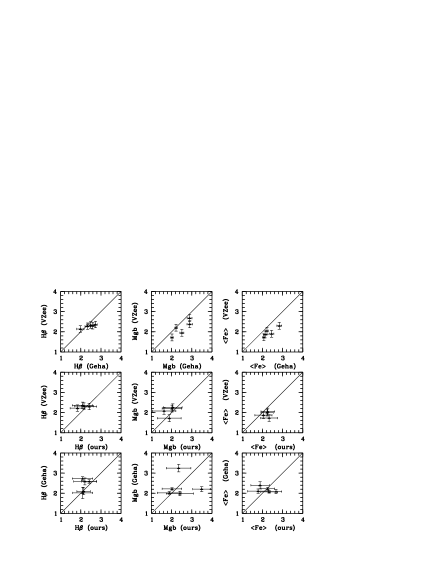
We also examined the dE samples of van Zee, Barton & Skillman (2004) and Geha, Guhathakurta & van der Marel (2003). The van Zee, Barton & Skillman (2004) sample comprises 16 dE/dS0 from the VCC with . Because they were looking for rotationally supported dEs, an ellipticity constraint was also imposed. The sample of Geha, Guhathakurta & van der Marel (2003) is also selected from the bright end of the dE population in the Virgo Cluster, spanning a range of ellipticities, and consists of 17 objects. The three dE samples span a similar range of magnitudes and there is an overlap of 4–5 galaxies between each of the samples. See Table 1 for dEs in common with our sample, and Appendix A (Figure 13) for a comparison of the indices measured in the three papers. Both Geha, Guhathakurta & van der Marel (2003) and van Zee, Barton & Skillman (2004) find no statistical differences between the rotating and the non-rotating dEs. Although we will use here some preliminary results from (Toloba et al., 2007) to identify dEs with rotation in our sample (see Section 3.4), we postpone a detailed comparison of the rotating and non-rotating dEs to that paper.
3 Results
The ultimate goal of our analysis is to gain insight in the star formation and assembly history of dwarf galaxies. This can be done by comparing indices, and combinations of indices, that are sensitive to age, metallicity or relative abundance of different metals. The measured values are compared to population synthesis model predictions. Comparison with SSP models gives us SSP-equivalent, or mean, luminosity-weighted, ages, metallicities and abundance ratios. In the optical most of the light comes from the youngest component of the stellar population. It is important to keep this in mind in the following. A galaxy with a young age means that the galaxy formed stars until recently, but could have a very old underlying stellar population. Throughout the paper, when we talk about age, metallicity or abundance ratio, we refer to the mean, luminosity-weighted values.
3.1 Central Lick/IDS indices
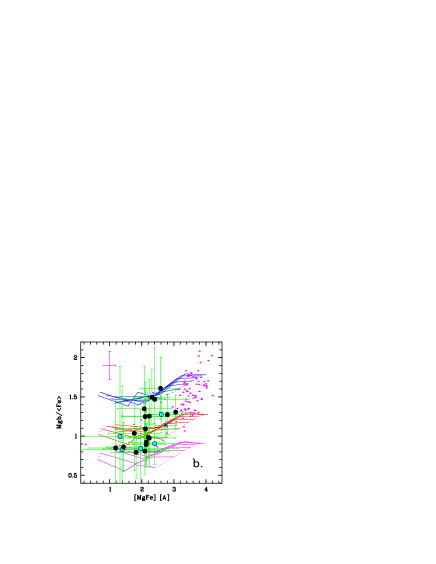
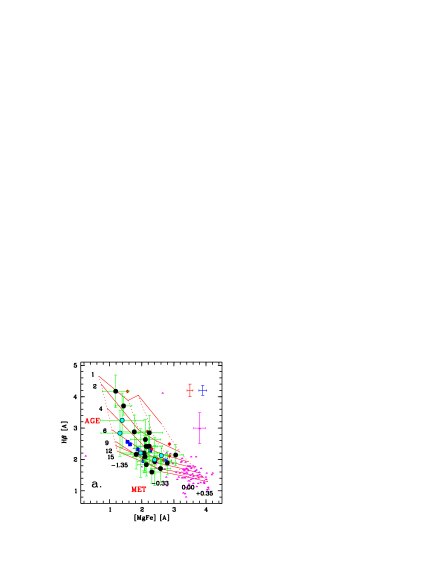
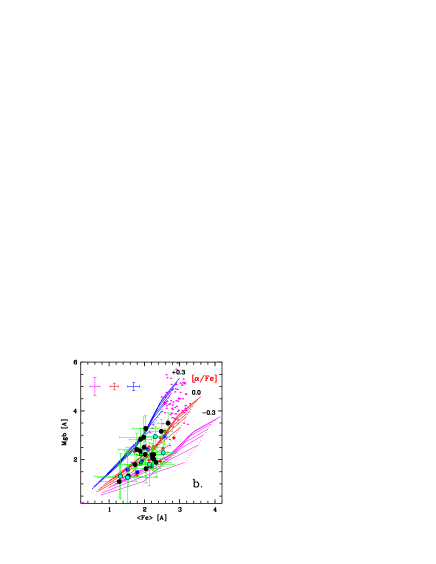
The most age-sensitive Lick/IDS indices are the hydrogen Balmer series, of which H, H and H are measurable in our spectra. The most used metallicity-sensitive Lick/IDS indices are Mg, Fe5270 and Fe5335, often combined as , and . The Mg index traces the metallicity as given by the elements, whereas Fe is most sensitive to Fe. Discrepancies between the metallicity estimated by those indices are due to non-solar [/Fe] abundance ratios (Worthey, Faber & Gonzalez, 1992). The [MgFe] index tries to minimise the effect of the non-solar abundance ratios (especially Mg-enhancement) exhibited by normal Es (TMB03).
In Figure 1 we plot the H– [MgFe] and Mg – Fe diagrams for our sample of dEs, together with the dEs of Geha, Guhathakurta & van der Marel (2003) and van Zee, Barton & Skillman (2004), and the early-type massive galaxies of SB06. The dE data fall in the same region in these plots, indicating that they have similar stellar population properties—ages, metallicities and abundance ratios. Comparing to the TMB03 models, Figure 1a shows that dEs span a wide range of ages and metallicities. Note however, that there appear to be no old, metal-rich dEs. The dEs also have more or less solar abundance ratios and some have even sub-solar abundance ratios (Figure 1b), a fact that was already noted by van Zee, Barton & Skillman (2004) and confirmed here. In the following we leave out the other dE samples because they would make the plots too crowded, and we concentrate on the comparison between dEs and Es.
Figure 1a shows that the massive Es completely fill the bottom-right part of the H – [MgFe] model grid, demonstrating that they are mainly old, metal-rich systems. In the Mg – Fe diagram (Figure 1b) the dEs and Es form a continuum of increasingly higher abundance ratios.
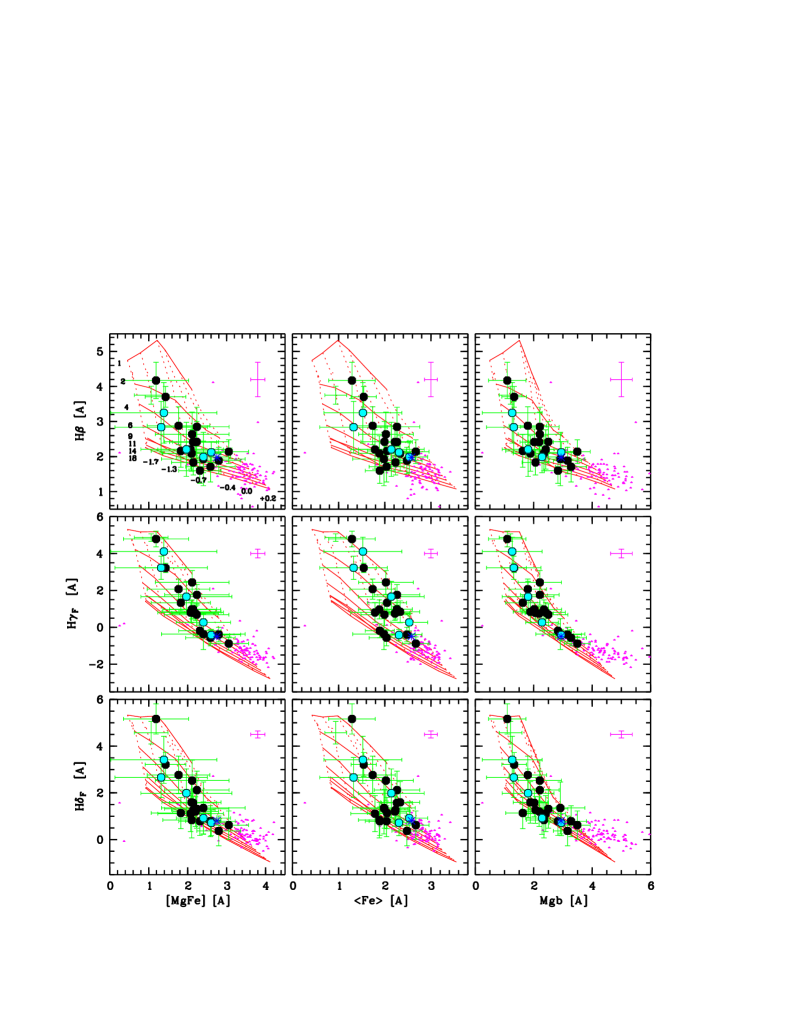
In Figure 2 we compare the observed central H, H and H indices versus Mg, Fe and [MgFe] indices to the V96 models. Again, while the massive early-type galaxies fill the bottom-right corner of the model grids, the dEs show a much larger spread, practically filling the rest of the grid, although the error bars are fairly large. There is almost no overlap between the dEs and the Es, but they seem to form a continuum. The Mg values measured in normal Es fall outside the grids because of the super-solar [/Fe] abundance ratios in these massive systems. The dEs however, fall in the same region as the model grids in both Fe and Mg and any of the Balmer indices. Finally it should be noted that the normal Es also have different loci with respect to the model grids when looking at the Balmer indices. This reflects the influence of super-solar [/Fe] abundance ratios on the higher-order Balmer indices (see Thomas, Maraston & Korn, 2004). The H and [MgFe] indices are virtually independent on the [/Fe] abundance ratio. Therefore we will use these indices to derive the ages and metallicities of the galaxies (unless otherwise specified, see section 3.2).
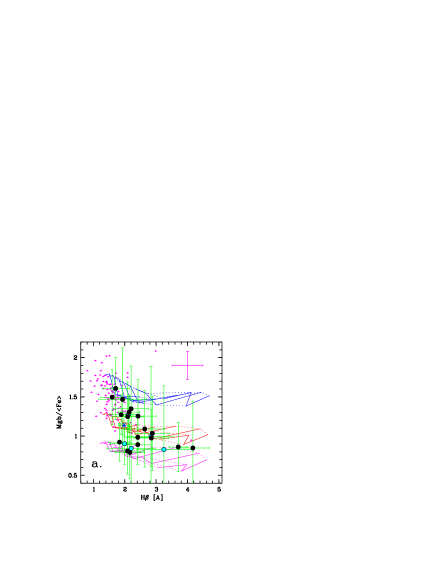
The Mg and the Fe index are sensitive to both metallicity and [/Fe] abundance ratio. The combination into [MgFe] makes a good metallicity estimator that is virtually independent of the [/Fe] ratio (TMB03). The ratio Mg/Fe on the other hand is almost independent of the metallicity. In Figure 3 we plot Mg/Fe versus H and [MgFe]. Unfortunately, error bars tend to explode when computing line-strength ratios, but as in Figure 1b, the Es clearly fall above any solar-scaled models, whereas the dE abundance ratios scatter around solar; some even show sub-solar ratios. Again, there appears to be a continuum from Es to dEs: decreasing Mg/Fe (decreasing [/Fe] abundance ratio) with increasing H (decreasing age), and with decreasing [MgFe] (decreasing metallicity). It seems that, whilst for the oldest dEs there is a range of [/Fe] ratios, all the youngest dEs ( Å) have solar or sub-solar abundance ratios.
3.1.1 Other metal indicators
Since different elements are produced on different timescales, element abundance ratios can potentially be used as clocks that measure the duration of the star formation in a galaxy. By comparing other metal indices to Fe, we can gain insight in the different abundance ratios on a relative scale. We do not attempt to obtain the true abundance ratios as these are always model-dependent. It is our opinion that current-day stellar population models are not capable of deriving true abundance ratios.
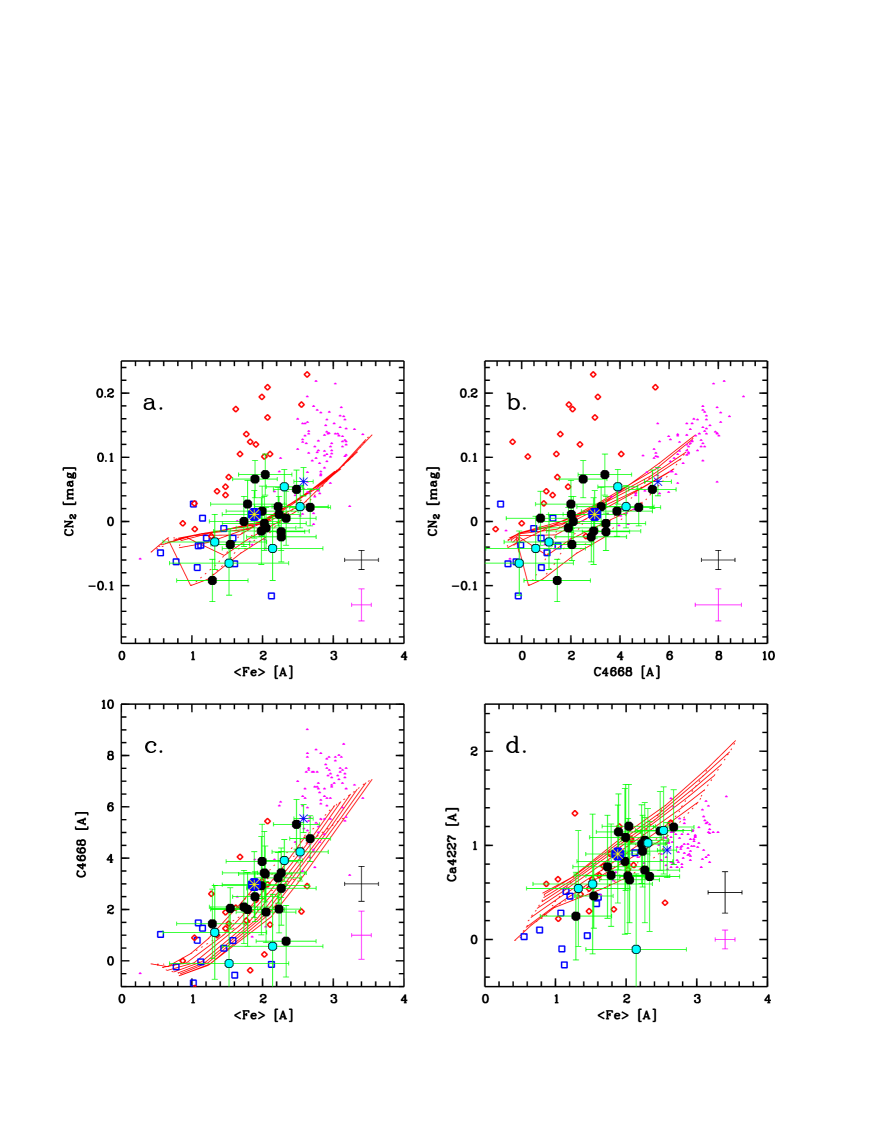
In Figure 4 we show CN2 versus Fe and C4668 (panels a and b respectively) as well as C4668 and Ca4227 versus Fe (panels c and d). The models plotted in Figure 4 are those of V96. We also checked with the solar-scaled TMB03 models and found that not correcting the -enhancement (V96) has some effect at very low metallicities but it is not significant and does not change any of our results.
In Tripicco & Bell (1995), it was established that the C4668 and Ca4227 indices are mostly sensitive to C and Ca respectively. For the CN2 index, the above paper predicts a C and N dependence which varies with stellar type. However, the observation that CN and NH features in M31 globular clusters (GCs) are enhanced with respect to Milky Way GCs, whilst the CH feature is not, supports the idea that N rather than C, is actually driving the CN2 values Burstein et al. (1984, 2004, see).
The behaviour of N and C in the integrated spectra of stellar populations has turned out to be a promising tool to constrain not only different star formation time-scales but also the importance of different chemical enrichment processes (see Cenarro et al., 2007, and references therein). For a more general comparing overview with other subsamples, in Figure 4 we included data for the globular cluster systems of the giant E NGC 1407 (Cenarro et al., 2007) and the dE VCC 1087 (Beasley et al., 2006, with the galaxy being also in our sample). Both globular cluster data sets have been spectroscopically confirmed to be old ( Gyr). Interestingly, VCC 1087 is slightly younger with an age of 7.4 Gyr (in agreement with Beasley et al., 2006), as will be presented in next Section.
In panels a and b, most dEs exhibit striking N underabundances with respect to Fe and C, contrary to both massive Es and extragalactic globular clusters of similar metallicity. Note however that, whilst dEs seem to match the extrapolation of the metallicity sequence of massive Es down to lower values, globular clusters clearly depart from the locus of galaxies all over the metallicity regime. Probably, primordial N enhancements in globular clusters (Meynet & Maeder, 2002; Li & Burstein, 2003) are responsible for this dichotomy. In panel c, the dichotomy between galaxies and globular cluster has washed out. Instead, from massive Es down to the low metallicity globular clusters there exists a unique sequence in the sense that [C/Fe] ratios tend to increase with the increasing metallicity. Note however that, since age differences among the subsamples exist, this trend must be considered from a qualitative point of view. In any case, it seems clear that most dEs show slightly super-solar [C/Fe] ratios—resembling massive Es—whereas globular clusters tend to exhibit either solar or even subsolar values (see Cenarro et al., 2007).
Ca has received recent attention in the literature because of inconsistencies found for the predictions of the NIR Ca II Triplet (e.g. Cenarro et al., 2003; Michielsen et al., 2003). Also the optical Ca4227 index exhibits unexplained behaviour (Cenarro et al., 2004). Although Ca is an element, we see that in Figure 4d the indices for both dEs and Es are consistent with solar [Ca/Fe] abundance ratios. This could point to a genuine Ca depletion resulting from metallicity-dependent supernova yields (Thomas, Maraston & Bender, 2003b). However, recently Prochaska, Rose & Schiavon (2005) have indicated that the CN band might be affecting the blue pseudo-continuum of the Ca line, leading to lower Ca4227 values. Therefore, giant Es, which show strong CN should also show low Ca4227 values, as observed here. The dEs on the other hand have no strong CN absorption. We therefore do not expect a CN-induced decrease in the Ca4227 index. The observed trend that dEs have solar [Ca/Fe] ratios is therefore real. In a subsequent paper we will investigate these issues in more detail, using high-resolution spectra and SSP models (Toloba et al., 2007).
3.2 Ages, metallicities and abundance ratios
| H – [MgFe] | H – Mg | H – Fe | ||||||||||
|---|---|---|---|---|---|---|---|---|---|---|---|---|
| galaxy | age | log(Z/Z⊙) | age | log(Z/Z⊙) | age | log(Z/Z⊙) | ||||||
| (Gyr) | (dex) | (Gyr) | (dex) | (Gyr) | (dex) | |||||||
| M 32 | ||||||||||||
| ID 0650 | ||||||||||||
| ID 0734 | ||||||||||||
| ID 0872 | ||||||||||||
| ID 0918 | ||||||||||||
| ID 1524 | ||||||||||||
| VCC 0021 | ||||||||||||
| VCC 0308 | ||||||||||||
| VCC 0397 | ||||||||||||
| VCC 0523 | ||||||||||||
| VCC 0856 | ||||||||||||
| VCC 0917 | ||||||||||||
| VCC 0990 | ||||||||||||
| VCC 1087 | ||||||||||||
| VCC 1122 | ||||||||||||
| VCC 1183 | ||||||||||||
| VCC 1261 | ||||||||||||
| VCC 1431 | ||||||||||||
| VCC 1549 | ||||||||||||
| VCC 1695 | ||||||||||||
| VCC 1861 | ||||||||||||
| VCC 1910 | ||||||||||||
| VCC 1912 | ||||||||||||
| VCC 1947 | ||||||||||||
| H – [MgFe] | Mg – Fe | |||||||
|---|---|---|---|---|---|---|---|---|
| galaxy | age | log(Z/Z⊙) | log(Z/Z⊙) | [/Fe] | ||||
| (Gyr) | (dex) | (dex) | (dex) | |||||
| M 32 | ||||||||
| ID 0650 | ||||||||
| ID 0734 | ||||||||
| ID 0872 | ||||||||
| ID 0918 | ||||||||
| ID 1524 | ||||||||
| VCC 0021 | ||||||||
| VCC 0308 | ||||||||
| VCC 0397 | ||||||||
| VCC 0523 | ||||||||
| VCC 0856 | ||||||||
| VCC 0917 | ||||||||
| VCC 0990 | ||||||||
| VCC 1087 | ||||||||
| VCC 1122 | ||||||||
| VCC 1183 | ||||||||
| VCC 1261 | ||||||||
| VCC 1431 | ||||||||
| VCC 1549 | ||||||||
| VCC 1695 | ||||||||
| VCC 1861 | ||||||||
| VCC 1910 | ||||||||
| VCC 1912 | ||||||||
| VCC 1947 | ||||||||
To derive ages and metallicities from measured H – [MgFe] indices, we apply a quadratic interpolation over the 9 nearest SSP model grid points (see Cardiel et al., 2003, for a detailed description). To estimate the errors in the derived quantities we make 1000 Monte Carlo realizations using the errors on the indices and derive 1 error contours in the age – metallicity space. These error contours are not necessarily ellipses; their exact form depends on how the index space maps into the age – metallicity space. As a conservative limit, we take the extremes of the error contour as upper and lower errors on both age and metallicity. In Table 3 we list the ages and metallicities derived using H and different metallicity indicators ([MgFe], Mg and Fe) using the V96 models. Similarly, using the TMB03 models, we also derive the [/Fe] abundance ratio and metallicity from the Mg – Fe diagrams, keeping age fixed at the age derived using H – [MgFe]. The metallicities we get from both H – [MgFe] and Mg – Fe diagrams are very similar (see Table 4).
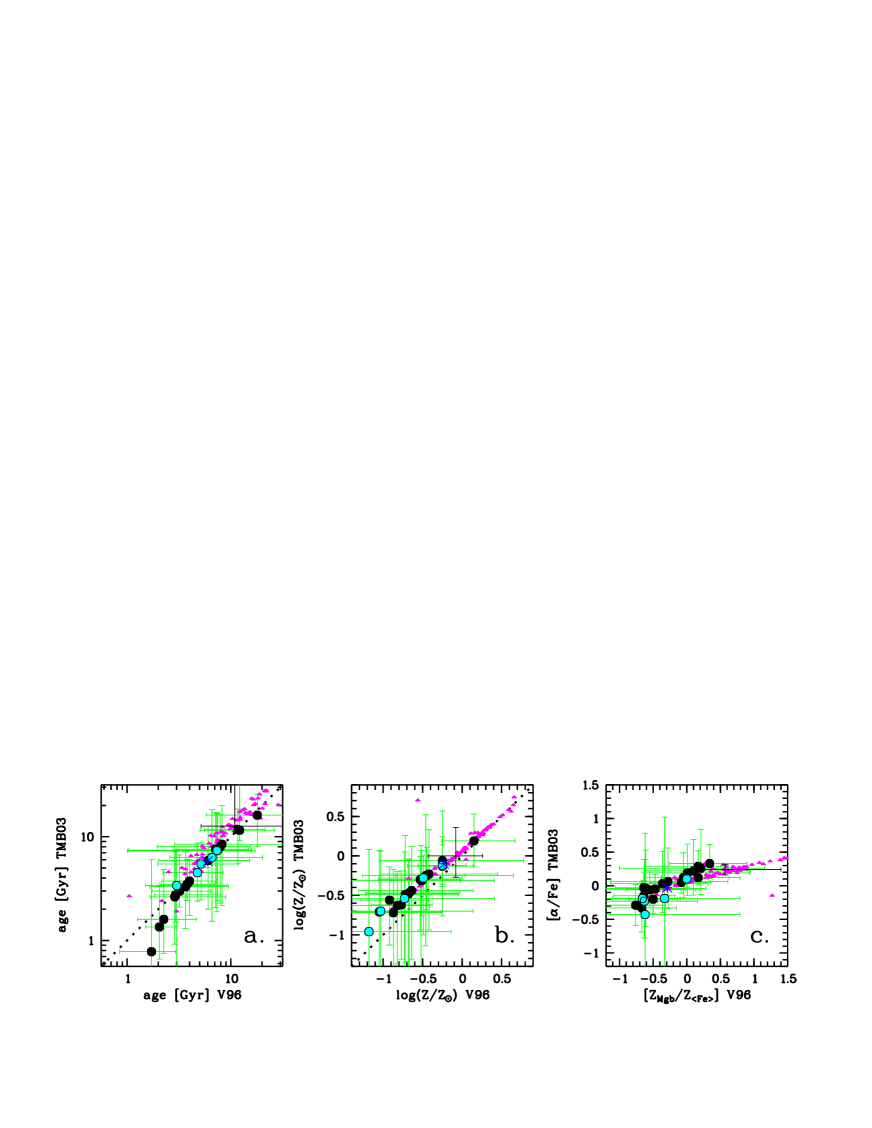
In Figure 5 we show the comparison of ages, metallicities and abundance ratios derived for our sample and the SB06 sample. Although the V96 models make no predictions for non-solar [/Fe] ratios, the difference of the metallicities derived from H – Mg and H – Fe diagrams correlates with the [/Fe] ratio inferred using TMB03 models (Figure 5c, see also Yamada et al., 2006). In the following, we will denote this difference as [ZMgb/Z⟨Fe⟩]. The ages agree remarkably well (Figure 5a), except for very young systems ( Gyr), where the TMB03 models give slightly younger ages. For the metallicity, there is a systematic 0.2 dex offset towards higher metallicities in TMB03 (Figure 5b); this offset seems to become slightly larger when going to lower metallicities. Finally, [ZMgb/Z⟨Fe⟩] appears to be a good proxy for the [/Fe] abundance ratio (Figure 5c, see also de la Rosa et al. (2007)). In the following we will use the ages, metallicities and [ZMgb/Z⟨Fe⟩] derived using V96 models, but the choice of models does not alter the conclusions whatsoever.
The dEs all fall inside the model grids. However, many of the Es have index measurements that lie outside the region defined by the models. In those cases, the derived ages/metallicities are extrapolations outside the model grids and should be treated with caution. For a more detailed examination of the ages and metallicities of the Es, we refer the reader to Sánchez-Blázquez et al. (2006b).
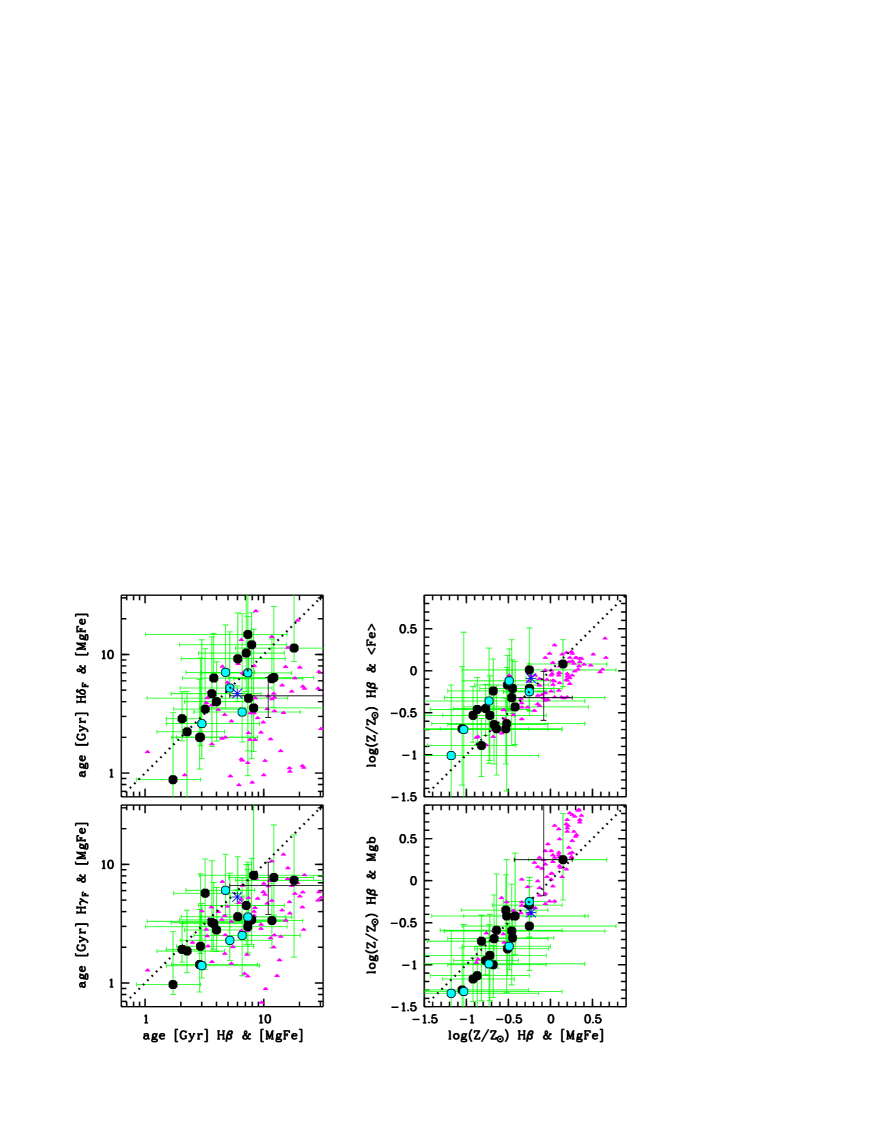
In order to estimate the robustness of the ages and metallicities derived, we compare the behaviour of different age and metallicity indicators (Figure 6). The ages of the dEs, derived from different Balmer indices, are consistent, but with a slight hint that H overestimates the age of the dEs. The ages of the Es however, are underestimated by both H and H, a known effect of their super-solar [/Fe] abundance ratios (Thomas, Maraston & Korn, 2004). This effect is even more noticeable in the derived metallicities (Mg gives higher metallicities, Fe gives lower metallicities). The metallicity of the dEs however is consistent, irrespective of the metallicity index used. Although the error bars are large, the effect of the sub-solar [/Fe] ratio is present for the field dEs; Mg gives slightly lower metallicities, Fe gives slightly higher metallicities.
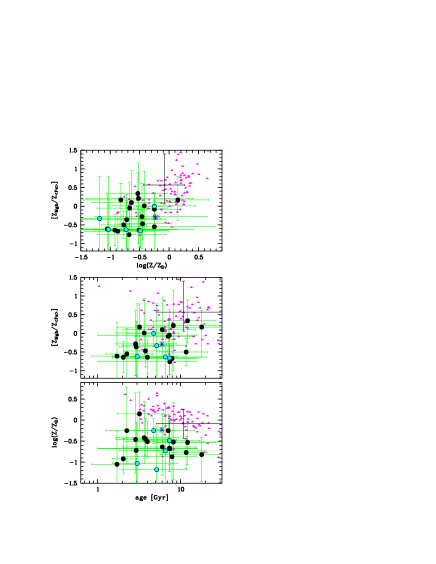
In Figure 7 we show the derived age versus metallicity and [ZMgb/Z⟨Fe⟩], and metallicity versus [ZMgb/Z⟨Fe⟩]. Although the index – index diagrams are not completely orthogonal in age, metallicity and abundance ratio, the idea that dEs are on the whole younger and less metal-rich, and that they have lower abundance ratios than Es, is confirmed. The age – metallicity plot shows the extension of the Trager et al. (2000) age – metallicity – velocity dispersion projection. For galaxies with the same velocity dispersion, age and metallicity anti-correlate, but the lower the velocity dispersion, the lower the mean ages and metallicities. This point will be explored in greater detail in Toloba et al. (2007) when we have the velocity dispersions for our dEs.
Using the whole dE sample and the V96 model predictions, we find a mean age of Gyr and a mean metallicity of log(Z/Z⊙). For only the Virgo sample we find an age of Gyr and a metallicity of log(Z/Z⊙). For only the Virgo sample, and using the TMB03 models, we find a mean age of Gyr and mean metallicity of log(Z/Z⊙), in very good agreement with the results of Geha, Guhathakurta & van der Marel (2003). They find, for a sample of 17 Virgo Cluster dEs and also using TMB03 models, a mean age of Gyr and mean metallicity of log(Z/Z⊙), respectively.
Although the mean age found for our dE sample does not change much if we include or exclude the field dEs, it is interesting to see that none of the field dEs has an age larger than 8 Gyr. On the other hand, there are also no field dEs younger than 3 Gyr, while some Virgo dEs are as young as 2 Gyr. As a statistical comparison, we use the one-dimensional Kolmogorov-Smirnov (K-S) test. This test gives the probability () that the difference between two distributions would be as large as observed if they had been drawn from the same population, and works well even for small samples. We have to take into account that age, metallicity and abundance ratios are determined from the H, Mg and Fe index data sets. The derived quantities are obviously correlated because the model grids are not orthogonal in the index space. Therefore we perform the K-S test on the measured indices rather than on the derived quantities. We find for the H, Mg and Fe distributions a value of 0.68, 0.96 and 0.52, respectively. Therefore we cannot rule out that the indices of field and Virgo dEs have the same distribution.
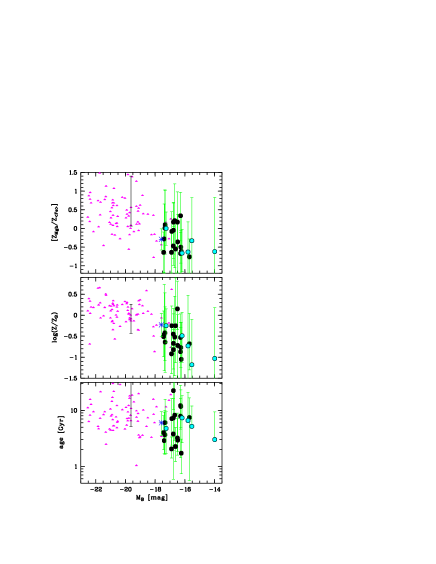
In Figure 8 we show versus age, metallicity and [ZMgb/Z⟨Fe⟩] for the galaxies in our sample and those in the sample from SB06 with available in HYPERLEDA (Table 1 in SB06). There is a clear correlation between and age, metallicity and abundance ratio. In all cases, dEs form the low-mass tail of the correlations for Es. In age, the dEs are generally younger than the Es. In metallicity, the dEs extend the luminosity-metallicity relation towards lower luminosities. Finally, the dEs have lower abundance ratios than the massive Es.
The high-metallicity dE is VCC 1947, which is known to rotate. This could be evidence that VCC 1947 stems from a harassed, more massive spiral. However, this dE has also been observed by Geha, Guhathakurta & van der Marel (2003) who find a lower metallicity, so we should be careful with this galaxy. Moreover, other rotationally supported dEs in our sample, such as VCC 397 and VCC 1122, or VCC 856 which has a spiral structure, do not show such a high metallicity.
3.3 Stellar light distributions
| galaxy | ||||||
|---|---|---|---|---|---|---|
| M 32 | — | — | — | |||
| ID 0650 | 3.881 | 0.028 | 0.023 | 0.012 | 0.26 | 0.36 |
| ID 0734 | 2.399 | 0.012 | 0.038 | 0.015 | 0.33 | 0.33 |
| ID 0872 | 3.768 | 0.055 | 0.053 | 0.019 | 0.23 | 0.42 |
| ID 0918 | 4.145 | 0.087 | 0.048 | 0.002 | 0.07 | 0.06 |
| ID 1524 | 2.293 | 0.013 | 0.133 | 0.010 | 0.21 | 0.39 |
| VCC 0021 | 3.128 | 0.045 | 0.147 | 0.008 | 0.11 | 0.14 |
| VCC 0308 | 2.930 | 0.033 | 0.058 | 0.012 | 0.07 | 0.11 |
| VCC 0397 | 2.967 | 0.051 | 0.112 | 0.021 | 0.06 | 0.09 |
| VCC 0523 | 2.761 | 0.034 | 0.059 | 0.008 | 0.02 | 0.05 |
| VCC 0856 | 2.561 | 0.035 | 0.119 | 0.008 | 0.09 | 0.11 |
| VCC 0917 | 3.266 | 0.060 | 0.101 | 0.008 | 0.07 | 0.09 |
| VCC 0990 | 3.202 | 0.054 | 0.022 | 0.007 | 0.04 | 0.05 |
| VCC 1087 | 2.877 | 0.033 | 0.041 | 0.010 | 0.06 | 0.10 |
| VCC 1122 | 3.088 | 0.043 | 0.062 | 0.007 | 0.09 | 0.11 |
| VCC 1183 | 3.204 | 0.040 | 0.055 | 0.016 | 0.11 | 0.11 |
| VCC 1261 | 2.991 | 0.036 | 0.084 | 0.007 | 0.02 | 0.04 |
| VCC 1431 | 2.959 | 0.048 | 0.034 | 0.006 | 0.02 | 0.04 |
| VCC 1549 | 3.170 | 0.039 | 0.104 | 0.005 | 0.12 | 0.20 |
| VCC 1695 | 3.476 | 0.036 | 0.048 | 0.009 | 0.12 | 0.11 |
| VCC 1861 | 3.107 | 0.029 | 0.001 | 0.015 | 0.18 | 0.22 |
| VCC 1910 | 3.079 | 0.039 | 0.091 | 0.003 | 0.11 | 0.16 |
| VCC 1912 | 3.485 | 0.044 | 0.128 | 0.007 | 0.06 | 0.08 |
| VCC 1947 | 2.991 | 0.050 | 0.079 | 0.005 | 0.05 | 0.08 |
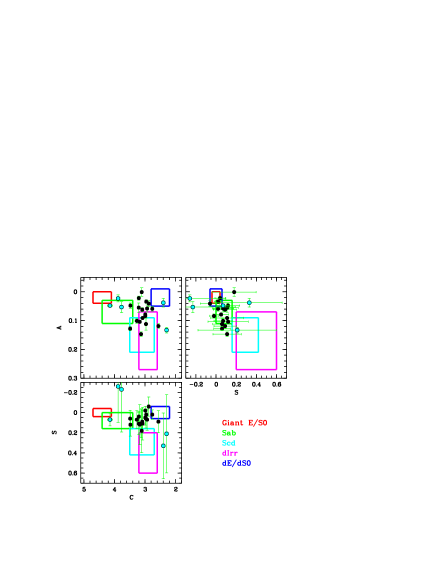
Using the SDSS -band images, we analyse the structural parameters of the galaxies in our sample. The concentration (), large-scale asymmetry () and clumpiness (), are three model-independent parameters that can be used to quantify a galaxy’s structural appearance (Conselice, 2003).
The CAS parameters have a well-defined range of values and are computed using simple techniques. The concentration index is the logarithm of the ratio of the radius containing 80% of the light in a galaxy to the radius which contains 20% of the light (Conselice, Bershady, & Jangren, 2000). The range in values is found from 2 to 5, with higher values for more concentrated galaxies, such as massive early types. The asymmetry is measured by rotating a galaxy’s image by and subtracting this rotated image from the original galaxy’s image. The residuals of this subtraction are compared with the original galaxy’s flux to obtain a ratio of asymmetric light. The radii and centering involved in this computation are well-defined and explained in (Conselice, Bershady, & Jangren, 2000). The asymmetry ranges from 0 to with merging galaxies typically found at . The clumpiness is defined in a similar way to the asymmetry, except that the amount of light in high frequency ’clumps’ is compared to the galaxy’s total light (Conselice, 2003). The values range from 0 to , with most star forming galaxies have .
In Figure 9, we show the values for , and measured on the whole sample (see also Table 5). The range adopted for the , and plots span the range measured for different galaxy types, taken from Table 6 of Conselice (2003). The dEs in the sample used in that work have lower luminosities () than the dEs in our sample (). The locus of our dEs coincides with what one expects for these (by selection), smooth, symmetric, diffuse galaxies, in-between the early-type Es/S0s and the fainter dEs studied in Conselice (2003). A Spearman rank-order test on the whole sample showed that no significant correlations exist between the , or parameters. However, the errors for the field dEs, especially for clumpiness () are quite large. Using only the Virgo dEs, a correlation between concentration () and clumpiness () exists at the 97.5% confidence level.
We find that the field dEs we have selected are either more concentrated or less concentrated than the Virgo dEs. This might be a result of the difficulty in finding dEs in the field, favouring quite compact or very diffuse systems to be selected. The K-S test yields that the probability that follows the same distribution for field and Virgo dEs is 1% (), thus the field and Virgo dEs have a significantly different distribution in concentration. For and , gives 0.52 and 0.13, respectively, so we cannot definitely say they are drawn from a different distribution.
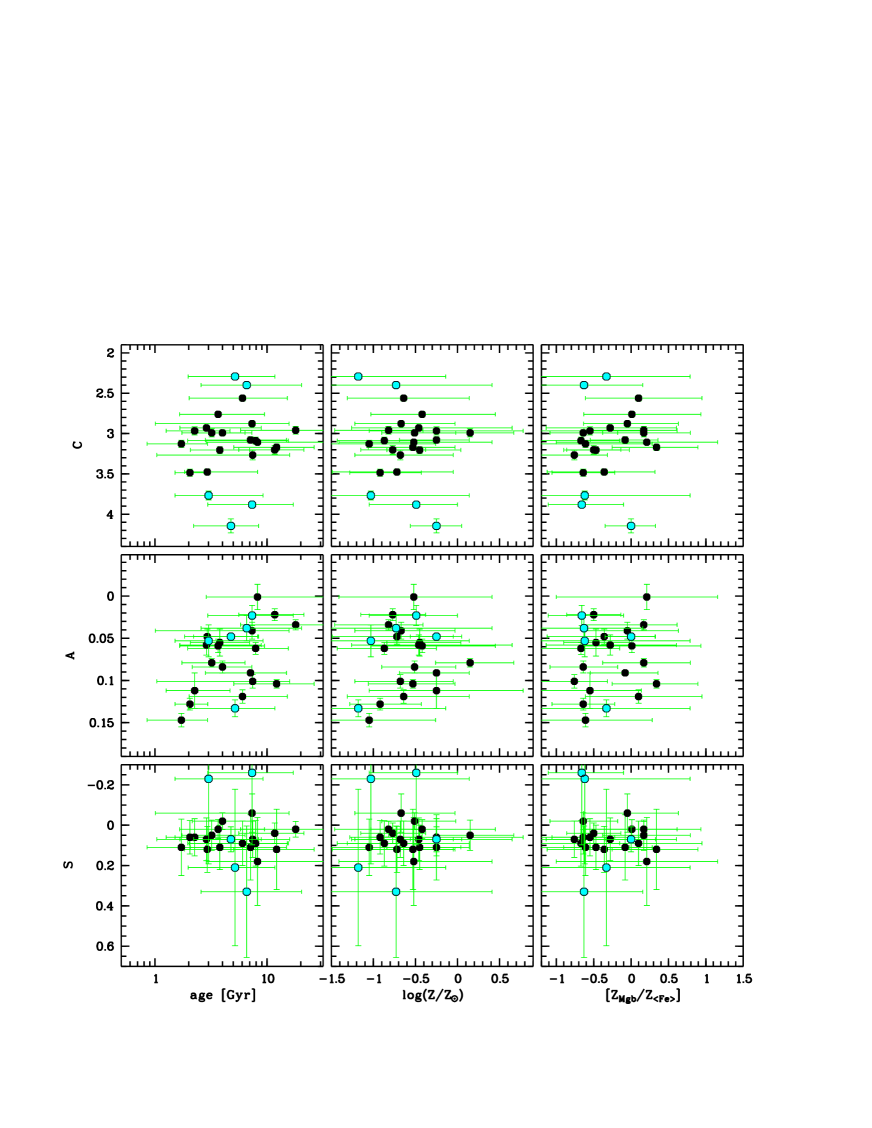
In Figure 10, we show , and as a function of age, metallicity and [ZMgb/Z⟨Fe⟩]. Here, a Spearman rank-order test reveals that there exists a significant (anti)correlation between age and large-scale asymmetry (), at the 97.5% confidence level using only the Virgo data, and better than 99% using the whole sample. Since measures the large-scale or bulk asymmetry, it appears that at the same time star formation was switched off, the galaxy also received a dynamical disturbance leaving an imprint in the large-scale structure of that galaxy, consistent with a scenario that the young dEs have only recently fallen into the cluster.
Using only the Virgo sample, it seems there are anti-correlations between concentration and metallicity (95%), and between concentration and [ZMgb/Z⟨Fe⟩] (97.5%). We also find that for the Virgo galaxies, the concentration parameter also anti-correlates with . Thus, the found anti-correlations with can be traced back to the mass – metallicity and mass – [ZMgb/Z⟨Fe⟩] relations. These correlations are in accordance with the findings of Vazdekis, Trujillo & Yamada (2004), who demonstrated that [Mg/Fe] correlates stronger with Sérsic- than metallicity. Like these authors, we also find that the correlation with metallicity as estimated by Mg is stronger, while it disappears if metallicity estimated by Fe is used. We will investigate this matter in more detail in subsequent papers, using photometric and kinematical data.
Finally, because the dEs are selected to be non-starforming systems, and the clumpiness parameter correlates very well with the H emission, we expect all our dEs to be smooth and to not show a large variation in .
3.4 The Virgo sample
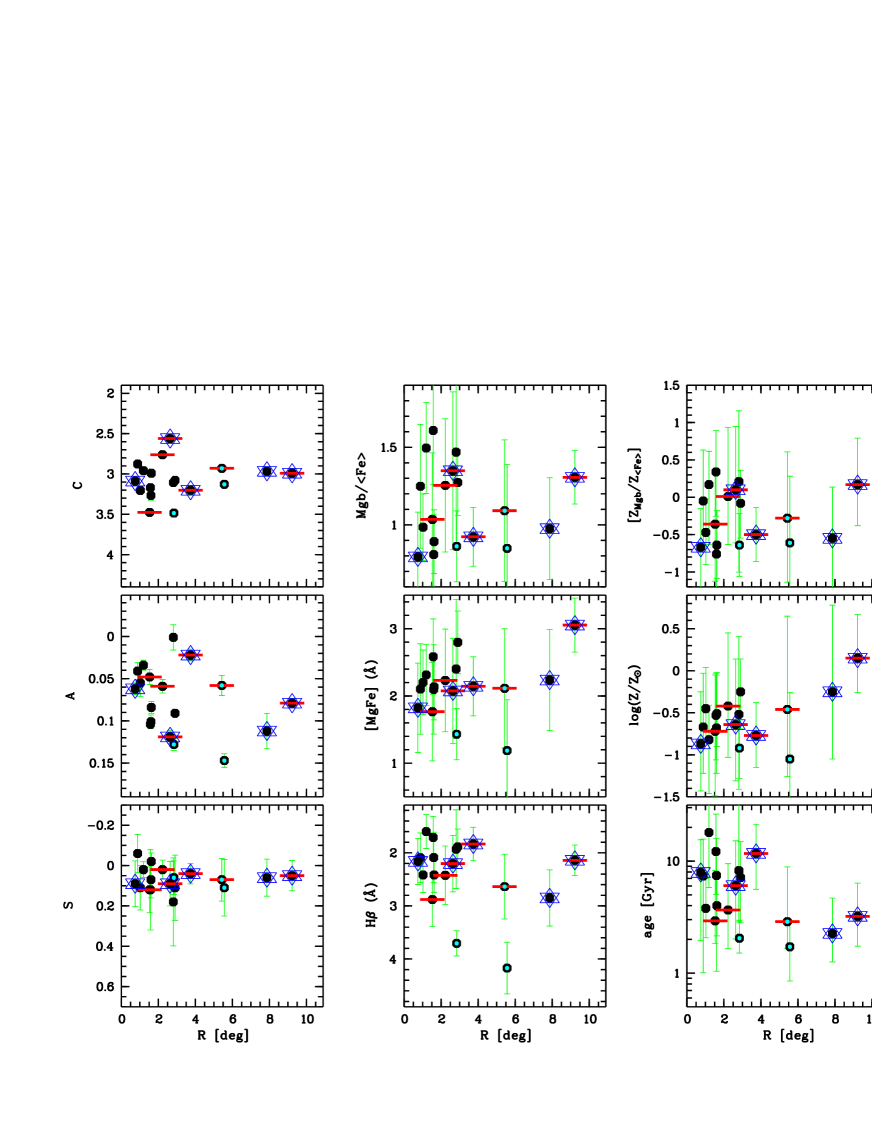
In Figure 11, we plot the measured , and parameters, the measured H, [MgFe] and Mg/Fe indices and the derived ages, metallicities and [ZMgb/Z⟨Fe⟩] versus the projected Virgocentric distance (we take M87 as the cluster centre). The Spearman rank-order test suggests a trend between and (better than 90%). The trend indicates the effect of the cluster on the dynamical state of dEs. Also age, and to a lesser extent, [ZMgb/Z⟨Fe⟩] are correlated with the distance to the cluster centre. The Spearman rank-order significance for the – log(age) correlation is better than 97.5%. The young dEs lie towards the outskirts of the cluster, and old dEs towards the centre. Although the Spearman rank-order test gives low significance to an – [ZMgb/Z⟨Fe⟩] correlation, it seems that the dEs with higher abundance ratio are located in the central 3 degrees (this is a consequence of the age – [ZMgb/Z⟨Fe⟩] correlation).
We also indicate in Figure 11 those dEs that have blue nuclei (Lisker et al., 2006), disk or spiral structures (certain and probable disks from Lisker, Grebel & Binggeli, 2006) and rotation (Geha, Guhathakurta & van der Marel, 2003; van Zee, Barton & Skillman, 2004; Toloba et al., 2007). The fraction of such dEs with residual structure decreases in the centre of the cluster (less than 2 degrees away from M87), again indicating the impact of the environment on those low-mass systems.
4 Discussion
4.1 Field and Virgo dEs
This is the first dE study to include a detailed investigation of field systems. It is notoriously difficult to find field non-starforming dwarfs, which in itself already reveals the importance of the environment to stop star formation, at least in low-mass objects. Except for ID 872, which is a quite faint dE, the field sample has similar absolute blue magnitudes as the Virgo dEs, so we are probing a similar mass range. Although the sample selection was mostly based on colour cuts, the analysis of the light distributions (Section 3.3) reveals that the field galaxies selected have a different concentration distribution than the Virgo dEs, being either more extended or more compact than the Virgo cluster dEs of which all but two are nucleated.
Although our field sample is small (only 5 galaxies) there appear to be no systematic differences between the Lick indices or the ages, metallicities and abundance ratios for the Virgo and the field samples. The K-S test cannot rule out that the samples are drawn from the same population. Having said that, none of the field dEs has a luminosity-weighted age larger than 8 Gyr, whereas the some of Virgo dEs have ages up to 18 Gyr. One could argue that also none of the field dEs is older then 3 Gyr, while some Virgo dEs are as young as 2 Gyr. Although the field sample suffers from poor statistics on both sides, the sample selection based on finding red objects should be biased towards old systems. Moreover, we found that three of the field dEs in the original sample are apparently still actively starforming.
It seems that by selecting red, smooth dwarf galaxies (dEs), we are automatically selecting galaxies with the same properties. It would be interesting to study the properties of dwarf galaxies irrespective of classification, as a function of environment. Given that dEs span such a large range in ages, and dIrrs are still starforming, and given that optical magnitudes are sensitive to age, it seems that selection should better be done on the near-infrared magnitudes in order to study connections between different populations of dwarf galaxies. Indeed, the -band surface brightness profiles of peculiar dEs and dIrrs appear to be indistinguishable (Gavazzi et al., 2001), and optical structural parameters for dEs and dIrrs are quite similar as well (van Zee, Barton & Skillman, 2004). In subsequent papers from the MAGPOP-ITP we will address this issue; see also Boselli et al. (2007).
4.2 The evolution of dEs
4.2.1 Internal mechanisms
From this and previous studies, it is becoming clear that not all dEs are old, primordial objects, and that some of them formed stars until auite recently ( Gyr ago).
It appears that, like for late-type galaxies (Boselli et al., 2001), the star formation history of quiescent galaxies is a function of mass. Massive early-type galaxies form early and on short time-scales (with high star formation efficiency), whereas less massive early-type galaxies have more extended star formation histories (lower star formation efficiency), leading to (sub-)solar [/Fe] abundance ratios and young luminosity-weighted ages. This dependence of star formation duration and star formation efficiency on mass is reproduced in detailed N-body/SPH simulations of isolated galaxies (Carraro et al., 2001).
A dwarf galaxy will only be classified as a dE once it stops star formation either through exhausting its gas, or through blowing it out in a galactic wind. Galactic winds, if present, are probably not efficient in blowing away all the gas, even from low-mass objects (Mac Low & Ferrara, 1999). They may however, preferentially blow away the ejecta from supernova type II, which are linked to the sites of star formation and therefore occur quite concentrated in space and time, while the ejecta from supernova type Ia are mixed into the interstellar medium more easily as they occur only sporadically (e.g. Vader, 1986). This could account for the sub-solar abundance ratios observed in some of the dEs. Abundance ratios for starforming dwarfs are unfortunately not yet available. In starforming systems optical emission lines are present, making the analysis of the underlying stellar populations difficult. However it seems that the same trends with mass are also found for late-type spirals, with lower [/Fe] abundance ratios for later Hubble types (Ganda et al., 2007).
4.2.2 External mechanisms
The observed correlation between age and Virgocentric distance indicates that environment also plays an important role in the evolution of dwarf galaxies. Similar trends of age and also [/Fe] were observed by Smith et al. (2006), who point out that: “Further progress in this area will be driven by improved spectroscopic observations of faint cluster members, which appear to exhibit stronger signatures of later accretion.”
Simulations predict that gas removal by ram pressure stripping in an intragroup or intracluster medium is very efficient, and proceeds in a few 100 Myr, even in low-density group environments (Mori & Burkert, 2000; Marcolini, Brighenti & D’Ercole, 2003). The morphological transformation of a disk or irregular galaxy into a more spheroidal, relaxed dE through interactions with other galaxies and the cluster potential may take longer, up to a few Gyr (Moore, Lake & Katz, 1998). Both these environmental effects would leave their imprint on the galaxies, either in their stellar populations because the star formation is stopped earlier than in an isolated environment, or in their stellar light distributions if the interaction has a dynamical effect.
Using our results, we can disentangle the effect of the two mechanisms at work. The correlation of age with Virgocentric distance, and the fact that very few genuine intermediate-type dE/dIrr galaxies exist, points to rapid loss of gas and subsequent truncation of the star formation once a dwarf galaxy enters the cluster. The correlation of age and bulk asymmetry shows the morphological transformation at work in galaxies that already stopped star formation some time ago. The dependency of asymmetry on Virgocentric distance might be less strong than the correlation with age because it can take several cluster crossing times666The crossing time of the Virgo cluster is about one-tenth of the Hubble time or slightly more than 1 Gyr (Trentham & Tully, 2002). to complete the morphological transformation.
This is corroborated by the fact that Virgo dEs with blue nuclei, residual disks, rotation, etc. (see Figure 11), tend to lie at larger radii. The spatial distribution of such ’special’ dEs appears to be consistent with that of star forming dwarfs (Lisker et al., 2007), pointing towards an ongoing infall and transformation of star forming dwarfs into quiescent dEs in the Virgo cluster. Given the continuous change of age with Virgocentric distance, and the fact that all but two of the Virgo dEs are nucleated and relatively bright, it seems that ’normal’ and ’special’ dEs are not two subclasses but rather form a continuum of increasingly older and more relaxed galaxies as they have spend more time in the cluster.
So if star formation is stopped by ram pressure stripping, why did field dE stop forming stars? We may see the field dEs in a quiescent stage of their life. Observations of the Local Group dEs reveal that their star formation history is episodic with gaps of up to a few Gyr (e.g. Grebel, Gallagher & Harbeck, 2003). Studies of HI find that gas-rich dEs, which are mainly located in the outskirts of clusters and in groups, have gas mass fractions comparable to those of star forming galaxies (Conselice et al., 2003b; Buyle et al., 2005; Bouchard et al., 2005). Some of these dEs even show evidence of ongoing star-formation at a very low rate (De Rijcke et al., 2003b; Michielsen et al., 2004). Radio observations of the neutral gas content of the field dEs would be a valuable test of this idea.
5 Conclusions
By analysing the stellar populations of a sample of 18 dEs in the Virgo cluster and 5 field dEs + M 32 we discover a relationship between the ages of the stellar populations in dwarfs, their environment and structure. Our results can be summarised as follows:
-
•
Unlike massive Es, the [/Fe] abundance ratios of dEs scatter around solar, some have even sub-solar abundance ratios. This points to an extended or burst-like star formation history in dEs, similar to what is found in the Local Group dEs. Interestingly, dEs also exhibit different C and N abundance ratios than massive Es and globular clusters.
-
•
On average, dEs are younger and less metal-rich than more massive Es, in accordance with the ’downsizing’ scenario.
-
•
Although our sample of field dEs is small, there is no statistical evidence that the distribution in age, metallicity or abundance ratio is different from the Virgo sample. This implies that the chemical evolution of dEs is an internally governed process of slow self-enrichment. However, preliminary truncation of the star formation by a hostile environment can stop this process.
-
•
There are no very old field dEs, and we find that age is correlated with projected distance to the Virgo Cluster centre, indicating that the cluster environment plays an important role in the evolution of dEs through the truncation of star formation, probably via ram pressure stripping.
-
•
From the analysis of the structural parameters of the dEs, we show that the (mean, luminosity-weighted) age and the bulk asymmetry are correlated. The younger dEs show higher internal bulk large-scale distortions. If dEs stem from a progenitor population of star forming irregular or disk galaxies that quickly stopped star formation after entering the cluster environment through ram-pressure stripping and subsequent slow transformation to more spheroidal objects through harassment, we indeed expect those dEs that fell in early to be more relaxed and symmetric than those that were accreted more recently.
In subsequent papers from the MAGPOP-ITP, we will investigate the kinematics of this sample to compare their stellar versus dynamical mass-to-light ratios and their place in the fundamental plane (Toloba et al., 2007).
Acknowledgements
We would like to thank Scott Trager, Ignacio Trujillo and an anonymous referee for valuable comments and discussion. DM thanks the MAGPOP EU Marie Curie Training and Research Network for financial support. The Network also provided financial support for collaborating research visits during which part of this work was done. Based on observations made with the NOT, operated on the island of La Palma jointly by Denmark, Finland, Iceland, Norway, and Sweden, in the Spanish Observatorio del Roque de los Muchachos of the Instituto de Astrofísica de Canarias. The data presented here have been taken using ALFOSC, which is owned by the Instituto de Astrofísica de Andalucía (IAA) and operated at the NOT under agreement between IAA and the NBIfAFG of the Astronomical Observatory of Copenhagen. This paper made use of the following public databases: SDSS, NED, HyperLEDA, GOLDMine.
References
- Beasley et al. (2006) Beasley M. A., Strader J., Brodie J. P., Cenarro A. J., Geha M., 2006, AJ, 131, 814
- Binggeli, Sandage & Tammann (1985) Binggeli B., Sandage A., Tammann G. A., 1985, AJ, 90, 1681
- Binggeli, Tammann & Sandage (1987) Binggeli B., Tammann G. A., Sandage A., 1987, AJ, 94, 251
- Boselli et al. (2007) Boselli A., Boissier S., Cortese L. & Gavazzi G., 2007, ApJ, submitted
- Boselli & Gavazzi (2006) Boselli A., Gavazzi G., 2006, PASP, 118, 517
- Boselli et al. (2001) Boselli A., Gavazzi G., Donas J., Scodeggio M., 2001, AJ, 121, 753
- Bouchard et al. (2005) Bouchard A., Jerjen H., Da Costa G. S., Ott J., 2005, AJ, 130, 2058
- Bundy et al. (2006) Bundy K., et al., 2006, ApJ, 651, 120
- Burstein et al. (1984) Burstein D., Faber S. M., Gaskell C. M., Krumm N., 1984, ApJ, 287, 586
- Burstein et al. (2004) Burstein D., et al., 2004, ApJ, 614, 158
- Buyle et al. (2005) Buyle P., De Rijcke S., Michielsen D., Baes M., Dejonghe H., 2005, MNRAS, 360, 853
- Caldwell, Rose & Concannon (2003) Caldwell N., Rose J. A., Concannon K. D., 2003, AJ, 125, 2891
- Cardiel (1999) Cardiel N., 1999, Ph. D. Thesis, Universidad Complutense de Madrid
- Cardiel et al. (2003) Cardiel N., Gorgas J., Sánchez-Blázquez P., Cenarro A. J., Pedraz S., Bruzual G., Klement J., 2003, A&A, 409, 511
- Carraro et al. (2001) Carraro G., Chiosi C., Girardi L., Lia C., 2001, MNRAS, 327, 69
- Cenarro et al. (2003) Cenarro A. J., Gorgas J., Vazdekis A., Cardiel N., Peletier R. F., 2003, MNRAS, 339, L12
- Cenarro et al. (2004) Cenarro A. J., Sánchez-Blázquez P., Cardiel N., Gorgas J., 2004, ApJ, 614, L101
- Cenarro et al. (2007) Cenarro A. J., Beasley M. A., Strader J., Brodie J. P., Forbes D. A., 2007, AJ, 134, 391
- Conselice (2003) Conselice C. J., 2003, ApJS, 147, 1
- Conselice (2006) Conselice C. J., 2006, ApJ, 639, 120
- Conselice, Bershady, & Jangren (2000) Conselice C. J., Bershady M. A., Jangren A., 2000, ApJ, 529, 886
- Conselice, Gallagher & Wyse (2001) Conselice C. J., Gallagher J. S., III, Wyse R. F. G., 2001, ApJ, 559, 791
- Conselice et al. (2003b) Conselice C. J., O’Neil K., Gallagher J. S., Wyse R. F. G., 2003, ApJ, 591, 167
- Cowie et al. (1996) Cowie L. L., Songaila A., Hu E. M., Cohen J. G., 1996, AJ, 112, 839
- Davies & Phillipps (1988) Davies J. I., Phillipps S., 1988, MNRAS, 233, 553
- Dekel & Woo (2003) Dekel A., Woo J., 2003, MNRAS, 344, 1131
- de la Rosa et al. (2007) de la Rosa I. G., de Carvalho R. R., Vazdekis A., Barbuy B., 2007, AJ, 133, 330
- De Lucia et al. (2006) De Lucia G., Springel V., White S. D. M., Croton D., Kauffmann G., 2006, MNRAS, 366, 499
- De Rijcke et al. (2003a) De Rijcke S., Dejonghe H., Zeilinger W. W., Hau G. K. T., 2003, A&A, 400, 119
- de Rijcke et al. (2005) De Rijcke S., Michielsen D., Dejonghe H., Zeilinger W. W., Hau G. K. T., 2005, A&A, 438, 491
- De Rijcke et al. (2003b) De Rijcke S., Zeilinger W. W., Dejonghe H., Hau G. K. T., 2003, MNRAS, 339, 225
- Ferguson & Binggeli (1994) Ferguson H. C., Binggeli B., 1994, A&ARv, 6, 67
- Ganda et al. (2007) Ganda K. et al., 2007, MNRAS, accepted (arXiv:0706.3624)
- Gavazzi et al. (2003) Gavazzi G., Boselli A., Donati A., Franzetti P., Scodeggio M., 2003, A&A, 400, 451
- Gavazzi et al. (1999) Gavazzi G., Boselli A., Scodeggio M., Pierini D., Belsole E., 1999, MNRAS, 304, 595
- Gavazzi, Pierini & Boselli (1996) Gavazzi G., Pierini D., Boselli A., 1996, A&A, 312, 397
- Gavazzi et al. (2001) Gavazzi G., Zibetti S., Boselli A., Franzetti P., Scodeggio M., Martocchi S., 2001, A&A, 372, 29
- Geha, Guhathakurta & van der Marel (2003) Geha M., Guhathakurta P., van der Marel R. P., 2003, AJ, 126, 1794
- Gorgas, Jablonka & Goudfrooij (2007) Gorgas J., Jablonka P., Goudfrooij P., 2007, A&A, submitted
- Gorgas et al. (1997) Gorgas J., Pedraz S., Guzman R., Cardiel N., Gonzalez J. J., 1997, ApJ, 481, L19
- Grebel, Gallagher & Harbeck (2003) Grebel E. K., Gallagher J. S., III, Harbeck D., 2003, AJ, 125, 1926
- Gunn & Gott (1972) Gunn J. E., Gott J. R. I., 1972, ApJ, 176, 1
- Li & Burstein (2003) Li Y., Burstein D., 2003, ApJ, 598, L103
- Lisker et al. (2006) Lisker T., Glatt K., Westera P., Grebel E. K., 2006, AJ, 132, 2432
- Lisker, Grebel & Binggeli (2006) Lisker T., Grebel E. K., Binggeli B., 2006, AJ, 132, 497
- Lisker et al. (2007) Lisker T., Grebel E. K., Binggeli B., Glatt K., 2007, ApJ, 660, 1186
- Mac Low & Ferrara (1999) Mac Low M.-M., Ferrara A., 1999, ApJ, 513, 142
- Maraston et al. (2003) Maraston C., Greggio L., Renzini A., Ortolani S., Saglia R. P., Puzia T. H., Kissler-Patig M., 2003, A&A, 400, 823
- Marcolini, Brighenti & D’Ercole (2003) Marcolini A., Brighenti F., D’Ercole A., 2003, MNRAS, 345, 1329
- Mateo (1998) Mateo M. L., 1998, ARA&A, 36, 435
- Meynet & Maeder (2002) Meynet G., Maeder A., 2002, A&A, 390, 561
- Michielsen et al. (2004) Michielsen D., De Rijcke S., Zeilinger W. W., Prugniel P., Dejonghe H., Roberts S., 2004, MNRAS, 353, 1293
- Michielsen et al. (2003) Michielsen D., De Rijcke S., Dejonghe H., Zeilinger W. W., Hau G. K. T., 2003, ApJ, 597, L21
- Moore, Lake & Katz (1998) Moore B., Lake G., Katz N., 1998, ApJ, 495, 139
- Mori & Burkert (2000) Mori M., Burkert A., 2000, ApJ, 538, 559
- Nelan et al. (2005) Nelan J. E., Smith R. J., Hudson M. J., Wegner G. A., Lucey J. R., Moore S. A. W., Quinney S. J., Suntzeff N. B., 2005, ApJ, 632, 137
- Paturel et al. (2003) Paturel G., Petit C., Prugniel P., Theureau G., Rousseau J., Brouty M., Dubois P., Cambrésy L., 2003, A&A, 412, 45
- Pedraz et al. (2002) Pedraz S., Gorgas J., Cardiel N., Sánchez-Blázquez P., Guzmán R., 2002, MNRAS, 332, L59
- Peletier et al. (2007) Peletier R. F., et al., 2007, in preparation
- Poggianti et al. (2001) Poggianti B. M., et al., 2001, ApJ, 562, 689
- Prochaska, Rose & Schiavon (2005) Prochaska L. C., Rose J. A., Schiavon R. P., 2005, AJ, 130, 2666
- Simien & Prugniel (2002) Simien F., Prugniel P., 2002, A&A, 384, 371
- Sánchez-Blázquez (2007) Sánchez-Blázquez P., 2004, Ph. D. Thesis, Universidad Complutense de Madrid
- Sánchez-Blázquez et al. (2006a) Sánchez-Blázquez P., Gorgas J., Cardiel N., González J. J., 2006a, A&A, 457, 787 (SB06)
- Sánchez-Blázquez et al. (2006b) Sánchez-Blázquez P., Gorgas J., Cardiel N., González J. J., 2006b, A&A, 457, 809
- Sánchez-Blázquez et al. (2006c) Sánchez-Blázquez P., et al., 2006c, MNRAS, 371, 703
- Sandage, Binggeli & Tammann (1985) Sandage A., Binggeli B., Tammann G. A., 1985, AJ, 90, 1759
- Rakos et al. (2001) Rakos K., Schombert J., Maitzen H. M., Prugovecki S., Odell A., 2001, AJ, 121, 1974
- Smith et al. (2006) Smith R. J., Hudson M. J., Lucey J. R., Nelan J. E., Wegner G. A., 2006, MNRAS, 369, 1419
- Thomas, Maraston & Bender (2003a) Thomas D., Maraston C., Bender R., 2003, MNRAS, 339, 897 (TMB03)
- Thomas, Maraston & Bender (2003b) Thomas D., Maraston C., Bender R., 2003, MNRAS, 343, 279
- Thomas et al. (2005) Thomas D., Maraston C., Bender R., Mendes de Oliveira C., 2005, ApJ, 621, 673
- Thomas, Maraston & Korn (2004) Thomas D., Maraston C., Korn A., 2004, MNRAS, 351, L19
- Toloba et al. (2007) Toloba E. et al., 2007, in preparation
- Trager et al. (2000) Trager S. C., Faber S. M., Worthey G., González J. J., 2000, AJ, 120, 165
- Trentham & Tully (2002) Trentham N., Tully R. B., 2002, MNRAS, 335, 712
- Tripicco & Bell (1995) Tripicco M. J., Bell R. A., 1995, AJ, 110, 3035
- Vader (1986) Vader J. P., 1986, ApJ, 305, 669
- van Zee, Barton & Skillman (2004) van Zee L., Barton E. J., Skillman E. D., 2004, AJ, 128, 2797
- van Zee, Skillman & Haynes (2004) van Zee L., Skillman E. D., Haynes M. P., 2004, AJ, 128, 121
- Vazdekis (1999) Vazdekis A., 1999, ApJ, 513, 224
- Vazdekis et al. (1996) Vazdekis A., Casuso E., Peletier R. F., Beckman J. E., 1996, ApJS, 106, 307 (V96)
- Vazdekis et al. (2003) Vazdekis A., Cenarro A. J., Gorgas J., Cardiel N., Peletier R. F., 2003, MNRAS, 340, 1317
- Vazdekis, Trujillo & Yamada (2004) Vazdekis A., Trujillo I., Yamada Y., 2004, ApJ, 601, L33
- White & Rees (1978) White S. D. M., Rees M. J., 1978, MNRAS, 183, 341
- White & Frenk (1991) White S. D. M., Frenk C. S., 1991, ApJ, 379, 52
- Worthey, Faber & Gonzalez (1992) Worthey G., Faber S. M., Gonzalez J. J., 1992, ApJ, 398, 69
- Worthey (2004) Worthey G., 2004, AJ, 128, 2826
- Worthey et al. (1994) Worthey G., Faber S. M., Gonzalez J. J., Burstein D., 1994, ApJS, 94, 687
- Worthey & Ottaviani (1997) Worthey G., Ottaviani D. L., 1997, ApJS, 111, 377
- Yamada et al. (2006) Yamada Y., Arimoto N., Vazdekis A., Peletier R. F., 2006, ApJ, 637, 200
Appendix A Transformation to the Lick/IDS system
| star | type | MILES | Lick/IDS |
|---|---|---|---|
| HD060522 | M0 III | yes | yes |
| HD065900 | A1 V | yes | no |
| HD072184 | K2 III | yes | yes |
| HD072324 | G9 III | yes | yes |
| HD074377 | K3 V | yes | yes |
| HD074442 | K0 III | yes | yes |
| HD075732 | G8 V | yes | yes |
| HD085235 | A3 IV | yes | no |
| HD137471 | M1 III | yes | yes |
| HD140160 | Aop V | yes | no |
| HD143761 | G2 V | yes | yes |
| HD144872 | K3 V | yes | yes |
| HD148513 | K4 III | yes | yes |
| HD165760 | G8 III | no | yes |
| HD165908 | F7 V | yes | yes |
During the course of the observations, we observed 15 standard stars (see Table 6). Fourteen of stars are in the (relative) flux-calibrated MILES sample (Sánchez-Blázquez et al., 2006c) and were used to obtain a more robust solution for the flux calibration. We have also 12 stars in our sample that appear in the original Lick/IDS stellar library (Worthey et al., 1994). Those have spectral type later than F and were used to calculate the offsets between our flux-calibrated spectra and the Lick/IDS response function. For each index we broadened our spectra to a specific resolution, as indicated in Table 7 (taken from Gorgas, Jablonka & Goudfrooij, 2007). Three of the stars had different offsets than the other 9. It results that these three stars (HD 074377, HD 137471, and HD 148513) were observed during a very early run of the Lick/IDS program (run 3), and their Lick/IDS indices may be less reliable. Therefore we do not use them here to calculate the offsets. The fits are shown in Figure 12 and the offsets and their 1 errors are listed in Table 7.
| index | Offset | ||
|---|---|---|---|
| (km s-1) | (oursLick/IDS) | ||
| CN1 | 325 | 0.018 | 0.014 mag |
| CN2 | 325 | 0.023 | 0.022 mag |
| H | 325 | 0.759 | 0.495 Å |
| H | 325 | 0.068 | 0.456 Å |
| Ca4227 | 300 | 0.065 | 0.289 Å |
| G4300 | 300 | 0.011 | 0.285 Å |
| H | 275 | 0.935 | 0.485 Å |
| H | 275 | 0.247 | 0.151 Å |
| Fe4383 | 250 | 0.097 | 0.622 Å |
| Ca4455 | 250 | 0.316 | 0.585 Å |
| Fe4531 | 250 | 0.380 | 0.365 Å |
| C4668 | 250 | 0.455 | 0.531 Å |
| H | 225 | 0.130 | 0.174 Å |
| Fe5015 | 200 | 0.013 | 0.636 Å |
| Mg1 | 200 | 0.021 | 0.006 mag |
| Mg2 | 200 | 0.018 | 0.010 mag |
| Mg | 200 | 0.089 | 0.313 Å |
| Fe5270 | 200 | 0.196 | 0.191 Å |
| Fe5335 | 200 | 0.116 | 0.167 Å |
| Fe5406 | 200 | 0.146 | 0.119 Å |
| Fe5709 | 200 | 0.059 | 0.150 Å |
| Fe5782 | 200 | 0.047 | 0.103 Å |
| index | units | this work | SB04 | W04 | |||
|---|---|---|---|---|---|---|---|
| CN1 | (mag) | ||||||
| CN2 | (mag) | ||||||
| H | (Å) | ||||||
| H | (Å) | ||||||
| Ca4227 | (Å) | ||||||
| G4300 | (Å) | ||||||
| H | (Å) | ||||||
| H | (Å) | ||||||
| Fe4383 | (Å) | ||||||
| Ca4455 | (Å) | ||||||
| Fe4531 | (Å) | ||||||
| C4668 | (Å) | ||||||
| H | (Å) | ||||||
| Fe5015 | (Å) | ||||||
| Mg1 | (mag) | — | |||||
| Mg2 | (mag) | — | |||||
| Mg | (Å) | ||||||
| Fe5270 | (Å) | ||||||
| Fe5335 | (Å) | ||||||
| Fe5706 | (Å) | — | |||||
| Fe5782 | (Å) | — | |||||
We have one galaxy in common with the sample of SB06, namely M 32. In Table 8, we show the measurements of all the indices in common for this galaxy. We also included measurements obtained by Worthey (2004), at a radius of 1.56″(we summed from -2″to 2″). They are in agreement within the error bars.
We also have several galaxies in common with both Geha, Guhathakurta & van der Marel (2003) and van Zee, Barton & Skillman (2004). In Figure 13, we compare common measurements in those works and our present work. Again the indices are in good agreement.
Appendix B Lick/IDS indices
In Table 9 we list, for all the galaxies, the indices measured and their errors. The indices are transformed to the Lick/IDS system using the offsets in Table 7.
| galaxy | CN1 | CN2 | H | H | Ca4227 | G4300 | H | H | Fe4383 | Ca445 | Fe4531 | C4668 |
|---|---|---|---|---|---|---|---|---|---|---|---|---|
| (mag) | (mag) | (Å) | (Å) | (Å) | (Å) | (Å) | (Å) | (Å) | (Å) | (Å) | (Å) | |
| M 32 | ||||||||||||
| ID 0650 | ||||||||||||
| ID 0734 | ||||||||||||
| ID 0872 | ||||||||||||
| ID 0918 | ||||||||||||
| ID 1524 | ||||||||||||
| VCC 0021 | ||||||||||||
| VCC 0308 | ||||||||||||
| VCC 0397 | ||||||||||||
| VCC 0523 | ||||||||||||
| VCC 0856 | ||||||||||||
| VCC 0917 | ||||||||||||
| VCC 0990 | ||||||||||||
| VCC 1087 | ||||||||||||
| VCC 1122 | ||||||||||||
| VCC 1183 | ||||||||||||
| VCC 1261 | ||||||||||||
| VCC 1431 | ||||||||||||
| VCC 1549 | ||||||||||||
| VCC 1695 | ||||||||||||
| VCC 1861 | ||||||||||||
| VCC 1910 | ||||||||||||
| VCC 1912 | ||||||||||||
| VCC 1947 | ||||||||||||
| galaxy | H | Fe5015 | Mg1 | Mg2 | Mg | Fe5270 | Fe5335 | Fe5406 | Fe5709 | Fe5782 | D4000 |
|---|---|---|---|---|---|---|---|---|---|---|---|
| (Å) | (Å) | (mag) | (mag) | (Å) | (Å) | (Å) | (Å) | (Å) | (Å) | (Å) | |
| M 32 | |||||||||||
| ID 0650 | |||||||||||
| ID 0734 | |||||||||||
| ID 0872 | |||||||||||
| ID 0918 | |||||||||||
| ID 1524 | |||||||||||
| VCC 0021 | |||||||||||
| VCC 0308 | |||||||||||
| VCC 0397 | |||||||||||
| VCC 0523 | |||||||||||
| VCC 0856 | |||||||||||
| VCC 0917 | |||||||||||
| VCC 0990 | |||||||||||
| VCC 1087 | |||||||||||
| VCC 1122 | |||||||||||
| VCC 1183 | |||||||||||
| VCC 1261 | |||||||||||
| VCC 1431 | |||||||||||
| VCC 1549 | |||||||||||
| VCC 1695 | |||||||||||
| VCC 1861 | |||||||||||
| VCC 1910 | |||||||||||
| VCC 1912 | |||||||||||
| VCC 1947 | |||||||||||