dir:/home/sushant/CME/PRL/
Helioseismic ring analysis of CME source regions
Abstract
We apply the ring diagram technique to source regions of halo coronal mass ejections (CMEs) to study changes in acoustic mode parameters before, during, and after the onset of CMEs. We find that CME regions associated with a low value of magnetic flux have line widths smaller than the quiet regions implying a longer life-time for the oscillation modes. We suggest that this criterion may be used to forecast the active regions which may trigger CMEs.
keywords:
Sun – coronal mass ejections – oscillations – magnetic field1 Introduction
Using high-resolution Global Oscillation Network Group (GONG) Dopplergrams, we have analysed the changes in oscillation mode properties in the source locations of CMEs. This was undertaken to find out if the mode properties of the CME regions are different from the active regions which did not produce a CME. This may help to identify the regions on solar disk which may produce CMEs.
2 Data and Analysis
The location of the CMEs are taken from the catalogue of Zhou et al. (2006) who have identified the source regions of 288 halo CMEs during the period of 1997-2003. This data base lists the location, date, time of occurrence and the classification of the region where the CMEs occured. To infer the mode parameters, we use the ring-diagram analysis (Hill, 1988) and compute power spectra of solar oscillations over smaller patches of the solar surface corresponding to the CME regions. The mode parameters are then extracted by fitting the power spectrum with a symmetric profile model which considers the peaks in the power spectra to be Lorentzian (Haber et al., 2001).
3 Results and Discussion
In this analysis we examine source locations of 48 CMEs during September 2001 – December 2003 that occurred no more than 30 degrees in any of the four cardinal directions from the solar disk center. These are further associated with flaring, active, and filament regions. The power spectra of these CME regions were calculated from an area covering 128 128 pixels with the center coinciding with the position of the CME. The area roughly corresponds to about 15 15 degrees in heliographic longitude and latitude. Each region was tracked for 1664 minutes where the central time corresponds to the onset time of the CME. In order to estimate the variation in mode parameters, we compare each of the CME region with a magnetically quiet region at the same latitude as the CME region within the same Carrington rotation. The average magnetic flux () associated with each CME and quiet region is calculated from the synoptic maps of Kitt Peak magnetograms (ftp://nsokp.nso.edu/kpvt/synoptic/mag/) by averaging the unsigned magnetic flux inside the same 15 15 degree box of the corresponding regions.
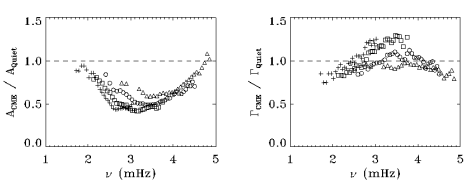
As an example of the variation in mode parameters in CME regions, we have shown the ratio of the peak power () between a CME and a quiet region in Figure 1a. It is evident that f and p-modes in the CME region have lower power than the quiet region and the variation is not a monotonic function of the frequency. The maximum suppression seems to occur in the frequency range of about 3-3.5 mHz and the suppression decreases with increasing radial order. At high frequencies, the suppression tends to become small and in few cases, we even note enhancement of power. In general, the results are consistent with those related to active regions (Rajaguru, Basu, and Antia, 2001).
The variation in half-width () between the same pair of CME and quiet region is shown in Figure 1b as the ratio between the two. For f and modes, the half-widths are larger in higher end of the frequency range and smaller in lower end of the frequency range. The widths of other p-modes are generally smaller than those in quiet regions. Since, the lifetime of a mode is inversely proportional to its half-width, the small width indicates that some modes live longer in regions where CMEs originate and implies a slow damping process. This result is in contrast to the study of active regions (Rajaguru, Basu, and Antia, 2001) where the lifetime of the modes were found to be smaller compared to the quiet regions.

Figure 2 shows the frequency averaged ratios of the half-width between the CME and quiet region for 48 CMEs as a function of average magnetic flux of the CME region. The widths are averaged over the frequency range of 2550–2750 Hz for f-modes and 3000–3500 Hz for p-modes. It is evident that the line width depends on the strength of magnetic field present in the region. Most of the CMEs associated with low magnetic flux have a smaller width compared to the quiet region. The width increases for higher magnetic flux values. However, there are exceptions in both the cases.

We have also studied the evolution of the oscillation mode parameters of the CME region one day prior and one day after the onset of the CME. As an example, we show the event of March 17, 2002 where the CME is located at W10S0 and has an average flux of 14 G (Figure 3). The quiet region for this event corresponds to the same position on April 4, 2002 and has a magnetic flux of 6.4 G. To compare, we also show the changes in half-width for three consecutive days for the active region NOAA 9628 located at S22.5E15 on September 23, 2001 (Figure 4). On comparing Figures 3 and 4, it is evident that in the region where the CME is triggered, the line width is always less than the quiet region while in case of active region, it is always higher than the quiet region. We propose this characteristic property of the oscillation modes as the prime signal to identify an active region which may produce a CME.

In summary, we find that the oscillation modes in the source locations of CMEs with a low value of magnetic flux have a higher life time as compared to the quiet regions. This indicates that damping process of the modes associated with CME regions are slow as compared to the quiet regions.
A part of this work is carried out through the National Solar Observatory Research Experiences for Undergraduate (REU) site program. This work utilizes data obtained by the Global Oscillation Network Group program, managed by the National Solar Observatory, which is operated by AURA, Inc. under a cooperative agreement with the National Science Foundation. The data were acquired by instruments operated by the Big Bear Solar Observatory, High Altitude Observatory, Learmonth Solar Observatory, Udaipur Solar Observatory, Instituto de Astrofísica de Canarias, and Cerro Tololo Interamerican Observatory. NSO/Kitt Peak data used here are produced cooperatively by NSF/NOAO, NASA/GSFC, and NOAA/SEL. This work is supported by NASA grant NNG 5-11703 and NNG 05HL41I.
References
- [1] Haber, D., Hindman, B.W., Toomre, J., et al., 2002, Astrophys. J., 570, 885.
- [2] Hill, F., 1988, Astrophys. J., 333, 996.
- [3] Rajaguru, S. P., Basu, S., and Antia, H. M., 2001, Astrophys. J., 563, 410.
- [4] Zhou, G. P., Wang, J. X., and Zhang, J., 2006, Astron. Astrophys., 445, 1133.