Asymmetric phase diagram of mixed CuInP2(SxSe1-x)6 crystals
Abstract
In this article mixed CuInP2(SxSe1-x)6 crystals were investigated by broadband dielectric spectroscopy (20 Hz - 3 GHz). The complete phase diagram has been obtained from these results. The phase diagram of investigated crystals is strongly asymmetric - the decreasing of ferroelectric phase transition temperatures in CuInP2(SxSe1-x)6 is much more flat with small admixture of sulphur then with small admixture of selenium. In the middle part of the phase diagram (x=0.4-0.9) the dipolar glass phase has been observed. In boundary region between ferroelectric order and dipolar glass disorder with small amount of sulphur (x=0.2-0.25) at low temperatures the nonergodic relaxor phase appears. The phase diagram was discussed in terms of random bonds and random fields.
pacs:
77.22.-d, 77.80.-e, 77.22.Gm, 81.30. -tI Introduction
Solid systems present many interesting types of phase transitions, with ferro, antiferro, or modulated long range order at lower temperatures. Disordered cooperative systems have also attracted a lot of attention. Nonergodic relaxor, dipolar glass phases or coexistence of ferroelectric and dipolar glass phases can appear in disordered systems at low temperatures. The nature of these phases continues to generate considerably experimental and theoretical interest.
CuInP2S6 crystals represent an unusual example of a anticollinear two-sublattice ferrielectric system maisonneuve1 ; bourdon1 ; cajipe1 ; vysochanskii1 . Here a first-order phase transition of the order-disorder type from the paraelectric to the ferrielectric phase is realized (Tc = 315 K). The symmetry reduction at the phase transition (C2/c Cc) occurs due to ordering in the copper sublattice and displacement of cations from the centrosymmetric positions in the indium sublattice. The spontaneous polarization arising at the phase transition to the ferrielectric phase is perpendicular to the layer planes. These thiophosphates consist of lamellae defined by a sulphur framework in which the metal cations and P - P pairs fill the octahedral voids; within a layer, the Cu, In, and P-P form triangular patterns maisonneuve1 ; bourdon1 ; cajipe1 . The cation off-centering, 1.6 Å for CuI and 0.2 Å for InIII, may be attributed to a second-order Jahn-Teller instability associated with the d10 electronic configuration. The lamellar matrix absorbs the structural deformations via the flexible P2S6 groups while restricting the cations to antiparallel displacements that minimize the energy costs of dipole ordering. Each Cu ion can occupy two different positions. The Cu, In and P - P form triangular patterns within the layer. Relaxational rather than resonant behaviour is indicated by the temperature dependence of the spectral characteristics, is in agreement with Xray investigations. It was suggested that a coupling between P2S6 deformation modes and CuI vibrations enables the copper ion hopping motions that lead to the loss of polarity and the onset of ionic conductivity in this material at higher temperatures vysochanskii1 . The investigation of ionic conductivity in CuInP2S6 maisonneuve2 ; banys1 have showed that follows the Arrhenius law with the activation energy EA = 0.73 eV maisonneuve2 and more detailed investigations showed EA=0.635 eV banys1 .
The results of dielectric investigations of CuInP2Se6 showed two phase transition: a second-order one at Ti= 248 K and a first-order transition at Tc =236 K vysochanskii2 . The results followed to the conclusion that an incommensurate phase occurs between Ti and Tc. However, the calorimetric investigations showed only a broad phase transition between 220 and 240 K in this compound bourdon2 . More accurate broadband dielectric investigations showed only nearly second order phase transition at Tc=226 K samulionis . From a single-crystal X-ray diffraction study follows that the high- and low-temperature structures of CuInP2Se6 (trigonal space group P-31c and P31c, respectively) are very similar to those of CuInP2S6 in the paraelectric and ferrielectric phases, with the CuI off-centering shift being smaller in the former than in the latter bourdon1 ; bourdon2 . There the thermal evolution of the cell parameters of CuInP2Se6 was obtained by full profile fits to the X-ray diffractograms. Both cell parameters a and c slightly decrease on cooling, and a parameter shows a local minimum at T=226 K. This behaviour is quite different from the anomalous increases found in the cell parameters of CuInP2S6 when heating through the transition maisonneuve1 ; bourdon1 .
The important feature of selenides is the higher covalence degree of their bonds. Evidently, for this reason the copper ion sites in the low-temperature phase of CuInP2Se6 are displaced only by 1.17 Å bourdon2 from the middle of the structure layers in comparison with the corresponding displacement 1.6 Å for CuInP2S6 maisonneuve1 . These facts enable to assume that the potential relief for copper ions in CuInP2Se6 is shallower than for its sulphide analog. Presumably, for this reason the structural phase transition in the selenide compound is observed at lower temperature than for the sulphide compound. Preliminary dielectric investigations of CuInP2(SxSe1-x)6 crystals are presented in banys2 ; vysochanskii4 . The data in vysochanskii4 is measured only at frequency 10 kHz and the paper banys2 contain data only on one compound - CuInP2(S0.7Se0.3)6.
The aim of this paper is to investigate phase diagram of mixed CuInP2(SxSe1-x)6 crystals via broadband dielectric spectroscopy. We showed that in mixed crystals with the increasing amount of impurities two smearing of ferroelectric phase transition scenarios are possible: ferroelectric - inhomogeneous ferroelectric - dipolar glass or ferroelectric - relaxor - dipolar glass.
II Experimental
Crystals of CuInP2(SxSe1-x)6 were grown by Bridgman method. For the dielectric spectroscopy the plate like crystals were used. All measurements were performed in direction perpendicular to the layers. The complex dielectric permittivity ∗ was measured using the HP4284A capacitance bridge in the frequency range 20 Hz to 1 MHz. In the frequency region from 1 MHz to 3 GHz measurements were performed by a coaxial dielectric spectrometer with vector network analyzer Agilent 8714ET. All measurements have been performed on cooling with controlled temperature rate 0.25 K/min. Silver paste has been used for contacting.
III Results and discussion
III.1 Influence of small amount of sulphur to phase transition dynamics in CuInP2Se6 crystals
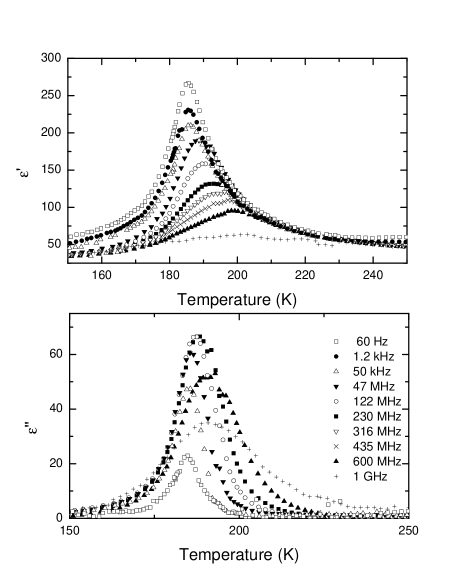
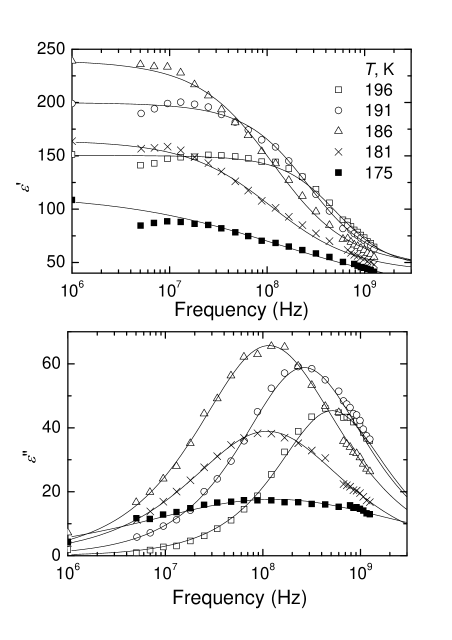
A small amount of admixture can significant changes properties of ferroelectrics. In mixed CuInP2(SxSe1-x)6 crystals with x0.1 the ferroelectric phase transition is observed (Fig. 1). Here the dielectric permittivity maximum temperature (Tm) is frequency-dependent only at higher frequencies (above 1 MHz). The phase transition temperature can be defined by Tm at low frequencies (below 1 MHz). The temperature behaviour of the dielectric dispersion of CuInP2Se6 crystals with a small admixture of sulphur (Fig. 2) is very similar to the dielectric dispersion of pure CuInP2Se6 crystals samulionis . At higher temperatures (T Tc) the dielectric dispersion reveals in 108 - 1010 Hz frequency range. With decreasing temperature the dielectric dispersion become broader and appears at lower frequencies. At lower temperatures (T Tc) the dielectric dispersion remains in the 106 - 1010 Hz frequency range and only its strength decreases on cooling.
More information about the phase transition dynamics can be obtained by analysis the dielectric dispersion with the Cole-Cole formula
| (1) |
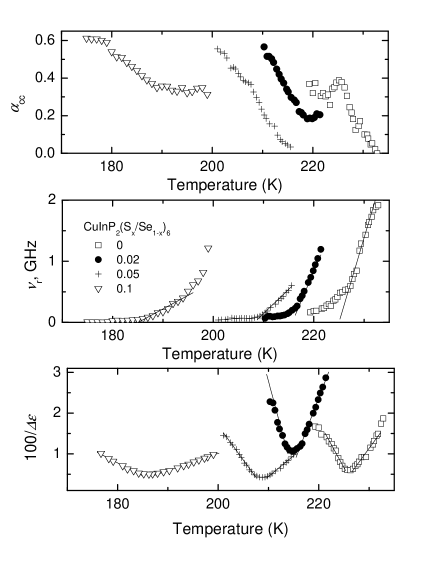
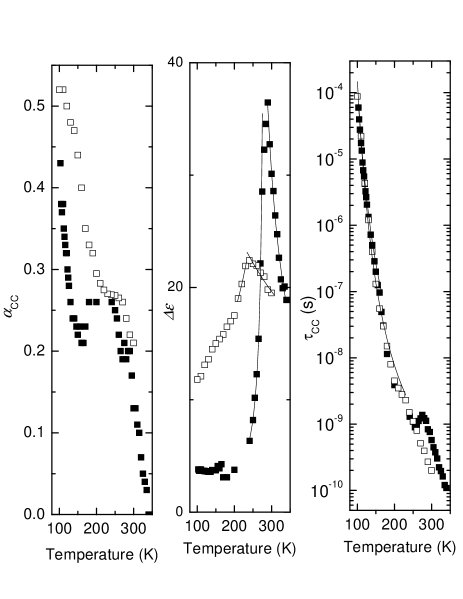
where represents dielectric strength of the relaxation, is the mean Cole-Cole relaxation time, ∞ represents the contribution of all polar phonons and electronic polarization to the dielectric permittivity and CC is the Cole-Cole relaxation time distribution parameter; when CC=0, Eq. 1 reduces to the Debye formula. Obtained parameters are presented in Fig. 3. The Cole-Cole parameters of all presented compounds show the similar behaviour: the Cole-Cole distribution parameter CC strongly increases on cooling, reciprocal dielectric strength 1/ exhibits a minimum at ferroelectric phase transition temperature, the soft mode frequency r= 1/(2CC) slows down on cooling in the paraelectric phase. The temperature dependence of the dielectric strength was fitted with the Curie-Weiss law (Fig. 3)
| (2) |
where Cp,f is the Curie-Weiss constant and TC is the Curie-Weiss temperature. The temperature dependence of soft mode frequency r in paraelectric phase was fitted with the equation
| (3) |
where A is a constant. Obtained parameters are presented in Table 1. The phase transition temperature TC in mixed crystals strongly decreases from 225 K to 185 K. For all the compounds the Cp/Cf ratio is about 1.5, for the second order phase transitions this ratio must be 2, for the first order one - higher than 2. The assumption was made that in these crystals between paraelectric and ferroelectric phase an additional incommensurate phase exists vysochanskii4 . However, in all mixed CuInP2(SxSe1-x)6 crystals with x0.1 no anomaly above the main (ferroelectric) phase transition was observed (Fig. 1).
| compound | Cp, K | Cp/Cf | A, MHz/K | TC, K |
|---|---|---|---|---|
| CuInP2Se6 from samulionis | 591.7 | 1.33 | 271.9 | 225 |
| CuInP2(Se0.98S0.02)6 | 309.6 | 1.43 | 193.4 | 215.7 |
| CuInP2(Se0.95S0.05)6 | 980.3 | 1.66 | 79.3 | 208.2 |
| CuInP2(Se0.9S0.1)6 | 2380.9 | 1.52 | 44.4 | 185 |
Below the ferroelectric phase transition temperature the dielectric dispersion is broad and part of it appears in the low frequency region (Fig. 1). This part is caused by ferroelectric domain dynamics. Therefore, the contribution of ferroelectric domain dynamics effectively raises the dielectric strength in the ferroelectric phase and Cf constant.
III.2 Nonergodic relaxor phase in mixed CuInP2(SxSe1-x)6 crystals
Recently, the relaxor-like behaviour as an embryo of the glass state is proposed in the antiferroelectric-glass phase boundary region of DRADP crystals family matsuhita1 . Here it is showed that the growth of glass ordering is in quite a different pattern from that of the ferroelectric-glass phase boundary region. In this section we shall presented two very similar CuInP2(SxSe1-x)6 compounds (x=0.2 and x=0.25), which exhibit peculiar dielectric behaviour. Each composition shows just one maximum in (T) and (T) in the range of 110 and 145 K at frequency 10 kHz vysochanskii4 .
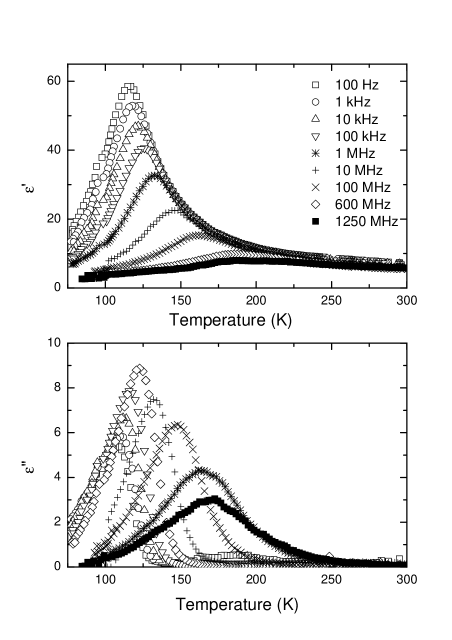
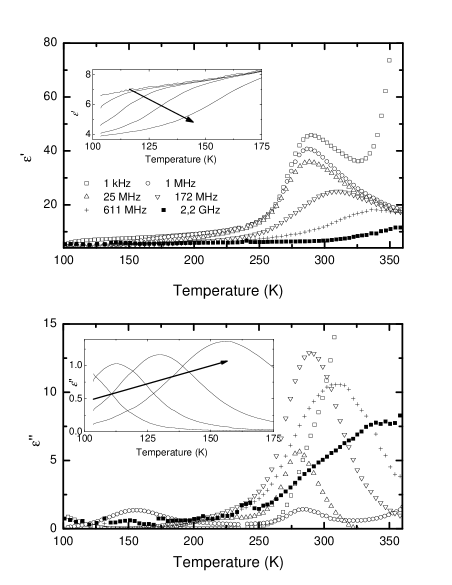
The temperature dependences of the complex dielectric permittivity at various frequencies of these crystals show typical relaxor behaviour. As an example, dielectric permittivity of CuInP2(Se0.75S0.25)6 crystal is shown in Fig. 4. There is a broad peak in the real part of dielectric permittivity is observed. With frequency Tm and the magnitude of the peak increases in the whole frequency range.
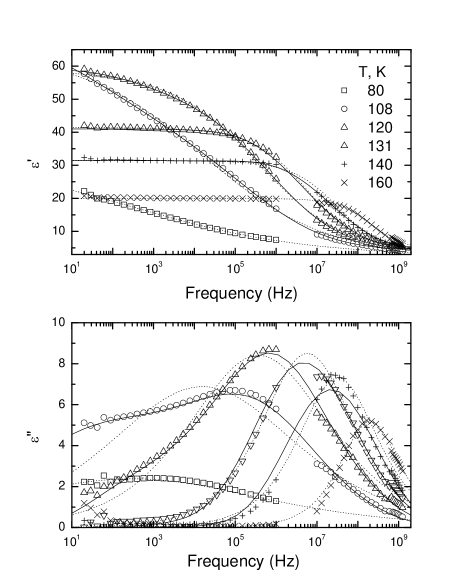
There is a strong dielectric dispersion in a radio frequency region around and below Tm at 1 kHz. The value of Tmm (the temperature of the maximum of losses) is much lower than that of Tm at the same frequency. The position of the maximum of dielectric permittivity is strongly frequency-dependent; no certain static dielectric permittivity can be obtained below and around dielectric permittivity maximum temperature Tm at 1 kHz. Such behaviour can be described by the Vogel-Fulcher relationship
| (4) |
where k is the Boltzman constant, Ef, 0, T0t are parameters of this equations. Obtained parameters are presented in Table 2.
| compound | 0, GHz | T0t, K | Ef/k, K |
|---|---|---|---|
| CuInP2(Se0.75S0.25)6 | 38.34 | 96.8 | 370 |
| CuInP2(Se0.8S0.2)6 | 10.96 | 134.5 | 150 |
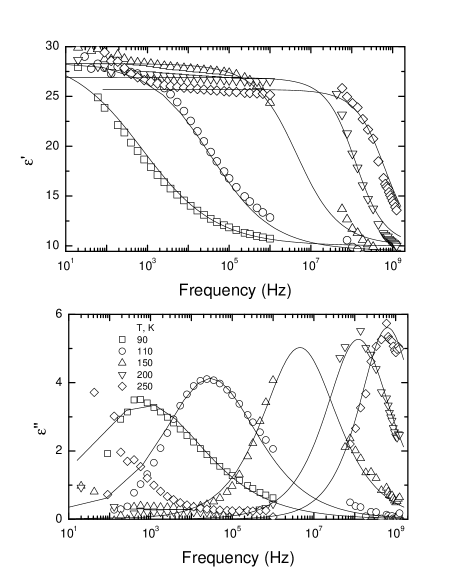
The dielectric dispersion of CuInP2(Se0.75S0.25)6 crystals show strong temperature dependence (Fig. 5): at higher temperatures the dielectric dispersion is only in 107 - 1010 Hz region, on cooling the dielectric dispersion becomes broader and more asymmetric. Strongly asymmetric and very broad dielectric dispersion is observed below dielectric permittivity maximum temperature Tm at 1 kHz. The Cole-Cole formula (Eq. 1) can describe such dielectric dispersion only at higher temperatures, due to predefined symmetric shape of the distribution of the relaxations times.
This is clearly visible in Fig. 5, where the Cole-Cole fit is shown as doted line. Not only Cole-Cole formula, however, other very well known predefined dielectric dispersion formulas, such as Havriliak-Negami, Cole-Davidson cannot adequate describe the dielectric dispersion of the presented crystals. More general approach must be used for determination of the broad continuous distribution function of relaxation times by solving a Fredholm integral equations
| (5a) | |||
| (5b) | |||
with the normalization condition
| (6) |
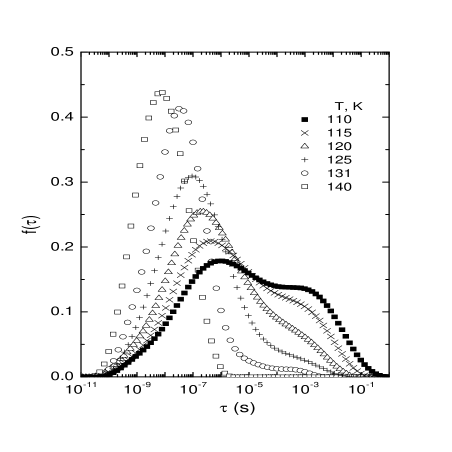
The most general method for the solution is the Tikhonov regularization tikhonov ; physrevst method. The calculated distribution of relaxation times of CuInP2(S0.25Se0.75)6 crystals is presented in Fig. 6. The symmetric and narrow distribution is observed only at higher temperature T Tm (at 1 kHz), on cooling the distributions becomes broader and more asymmetric so that below Tm (at 1 kHz) second maximum appears. Such behaviour of distribution of relaxation times have been already observed in a very well known relaxors: Pb(Mg1/3Nb2/3)O3 (PMN) grigalaitis1 , Pb(Mg1/3Nb2/3)O3-Pb(Zn1/3Nb2/3)O3-Pb(Sc1/2Nb1/2)O3 (PMN-PZN-PSN) macutkevic1 , Pb(Mg1/3Ta2/3)O3 (PMT) kamba and Sr0.61Ba0.39Nb2O6 (SBN) banys3 . From calculated distributions of relaxation times the most probable relaxation time mp, longest relaxation time max and min shortest relaxation time (the level 0.1 was chosen as sufficient accurate) has been obtained (Fig. 7). The shortest relaxation time min is about 0.1 ns for CuInP2(S0.25Se0.75)6 and about 0.01 ns for CuInP2(S0.2Se0.8)6; it increases slowly with the increase of temperature. The longest relaxation time max diverges according to the Vogel-Fulcher law
| (7) |
where T0 is the freezing temperature, Emax is the activation energy of the longest relaxation times max and 0max is the longest relaxation time at very high temperatures. The obtained parameters are presented in Table 3, however the most probable relaxation time mp diverges with good accuracy according to the Arrhenius law:
| (8) |
where Emp is the activation energy of the most probable relaxation times mp, and 0mp is the most probable relaxation time at very high temperatures. Obtained parameters are 0mp = 4.610-16 s and Emp/k = 2365.3 K for CuInP2(Se0.75S0.25)6 and 0mp = 1.210-14 s and Emp/k = 1806.3 K for CuInP2(Se0.8S0.2)6.
| compound | 0max, s | T0, K | Emax/k, K |
|---|---|---|---|
| CuInP2(Se0.75S0.25)6 | 2.5210-8 | 118.9 | 60.5 |
| CuInP2(Se0.8S0.2)6 | 1.0210-10 | 129.4 | 211.01 |
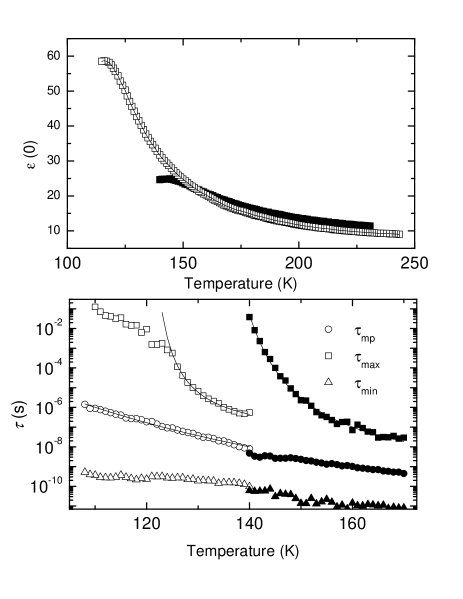
Such phenomenon can be caused by a distribution of Vogel-Fulcher temperatures T0, where 0T0Tmax0 pirc , pirc3 . In our case Tmax would correspond to a Vogel-Fulcher temperature of and 0 is the freezing temperature of the most probable relaxation time and all shorter relaxation times. The temperature dependence of the reciprocal static dielectric permittivity 1/(0) was fitted with sperical random bond random field (SRBRF)
| (9) |
where J is the mean coupling constant and qEA is Edwards-Anderson order parameter, if qEA=0 then this equation becomes the Curie-Weiss law. The Edwards-Anderson order parameter qEA for relaxor can be determined by equation blinc :
| (10) |
where J is the variance of the coupling and f is the variance of the random fields. Obtained parameters we will discussed further together with random bonds random fields parameters of other mixed crystals. We must admit that the equations of the SRBRF model describe well static dielectric properties of the presented crystals. At sulphur concentrations between x=0.25 and x=0.2, morphotropic phase boundary between the paraelectric phases C2/c (characteristic for CuInP2S6) and P-31c (characteristic for CuInP2Se6) or respectively ferrielectric phases Cc and P31c were suggested vysochanskii4 . These results were later confirmed by X-ray and Raman investigations vysochanskii5 . Therefore, the disorder in these mixed crystals is very high, and it can be reason of relaxor nature of the presented crystals.
III.3 Dipolar glass phase in mixed CuInP2(SxSe1-x)6 crystals
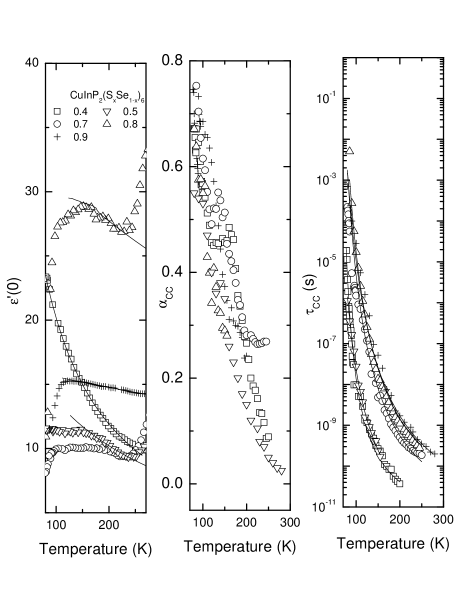
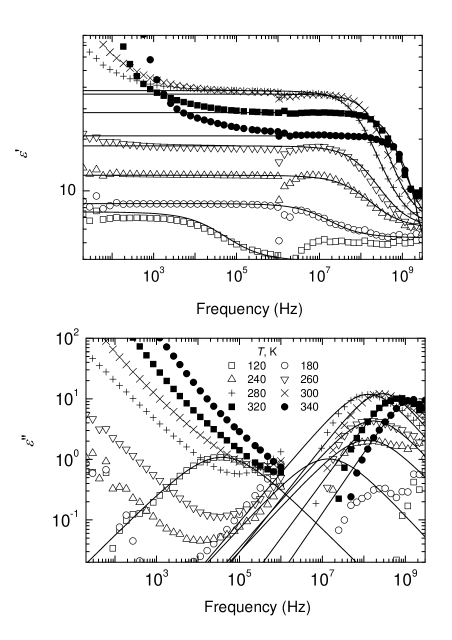
For CuInP2(SxSe1-x)6 crystals with x=0.4-0.9 no anomaly in static dielectric permittivity indicating the polar phase transition can be detected down to the lowest temperatures. The dielectric spectra of these crystals are very similar. As an example, real and imaginary parts of the complex dielectric permittivity of CuInP2(S0.8Se0.2)6 crystals are shown in Fig. 8 as a function of temperature at several frequencies.
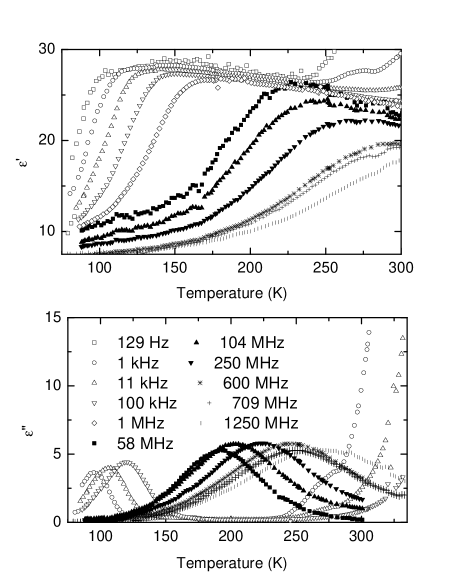
It is easy to see a broad dispersion of the complex dielectric permittivity starting from 260 K and extending to the lowest temperatures. The maximum of the real part of dielectric permittivity shifts to higher temperatures with increase of the frequency together with the maximum of the imaginary part and manifests typical behaviour of dipolar glasses. The dielectric dispersion is symmetric of all crystals under study so that it can easily be described by the Cole-Cole formula (Fig. 9).
The temperature dependence of the Cole-Cole parameters confirms typical behaviour for dipolar glasses (Fig. 10): the mean Cole-Cole relaxation time diverge according to the Vogel-Fulcher law (Eq. 7), the Cole-Cole distribution parameter CC strongly increases on cooling and reaches value 0.5 below 100 K, the static dielectric permittivity temperature dependence has no expressed maxima. Usually such behaviour is analyzed in terms of the three-dimensional random-bond random-field (3D RBRF) Ising model of Pirc et al tadic . In terms of this model, the temperature dependence of static dielectric permittivity can be described with the Eq. 9. The order parameter is defined by the two coupled self-consistent equationslopes
| (11) |
| (12) |
where P is the polarization and
| (13) |
The Equation 9 describe good enough static dielectric properties of presented dipolar glasses and obtained parameters are in good agreement with parameters obtained from Vogel-Fulcher fits, according to formula kind
| (14) |
Obtained parameters we will discuss further below together with random bonds random fields parameters of other mixed crystals.
III.4 Influence of small amount of selenium to phase transition dynamics in CuInP2S6 crystals
Temperature dependence of the dielectric permittivity of CuInP2S6 crystals with a small amount of selenium (x=0.98) is presented in Fig. 11. A small amount of selenium changes dielectric properties of CuInP2S6 crystals significantly: the temperature of the main dielectric anomaly shift from about 315 to 289 K, the maximum value of the dielectric permittivity significantly decreases from about 180 to 40 (at 1 MHz), at higher frequencies (from about 10 MHz) the peak of dielectric permittivity becomes frequency- dependent in CuInP2(S0.98Se0.02)6 crystals and a critical slowing down disappears banys1 . An additional dielectric dispersion appears at low frequencies and at low temperatures. The CuInP2(S0.95Se0.05)6 crystals exhibit qualitatively similar dielectric anomaly with Tc and shifting to lower values.
The dielectric dispersion of presented crystals is symmetric (Fig. 12) so that it can be correctly described by the Cole-Cole formula (Eq. 1). The Cole-Cole parameters are shown in Fig. 13. The parameters of the Cole-Cole distribution of relaxation CC strongly increase on cooling and reach 0.43 at low temperatures.
The temperature dependence of the dielectric strength was fitted with the Curie-Weiss law (Eq. 2). Obtained parameters are summarized in Table 4.
| compound | Cp, K | Cp/Cf | TCp, K | TCf, K |
|---|---|---|---|---|
| CuInP2(Se0.05S0.95)6 | 8587.7 | 2.99 | 137.2 | 368.7 |
| CuInP2(Se0.02S0.98)6 | 1906.5 | 7.01 | 236.9 | 282.6 |
The difference TCp-TCf and ratio Cp/Cf in these crystals indicate a first order, order-disorder phase transition. In ferroelectric phase the mean relaxation time CC decreases only in a narrow temperature region and only for CuInP2(S0.98Se0.02)6, further on cooling a significant increasing of times CC is observed. This increasing can be easily explained by the Fogel-Vulcher law (Eq. 7). These parameters are summarized in Table 5.
| compound | , s | T0, K | E/k, K |
|---|---|---|---|
| CuInP2(Se0.95S0.05)6 | 8.510-12 | 1150 | 31 |
| CuInP2(Se0.98S0.02)6 | 3.7710-11 | 1215 | 28 |
Note that all parameters of different compounds in Table 5 are close to each other. Such a behaviour is very similar to behaviour of betaine phosphite with a small amount of betaine phosphate banys4 and in RADA trybula crystals, where a proposition that a coexistence of the ferroelectric order and dipolar glass disorder appears at low temperatures was proposed. Therefore we can conclude that mixed CuInP2(SxSe1-x)6 crystals with x0.95 also exhibit at low temperatures a coexistence of ferroelectric and dipolar glass disorder.
III.5 Phase diagram
In this section we will discuss phase diagram in terms of random bonds and random fields. For ferroelectrics we assume that mean coupling constant J/k is equal to TC, because Curie-Weiss fit is accurate for these compounds and in this case Eq. 9 becomes Curie-Weiss law. Also for crystals with with x0.1, for the same reason we assume that J and f are 0. For ferroelectrics with x0.95 we obtained J from T0 (Eq. 14), we assumed that f=0.
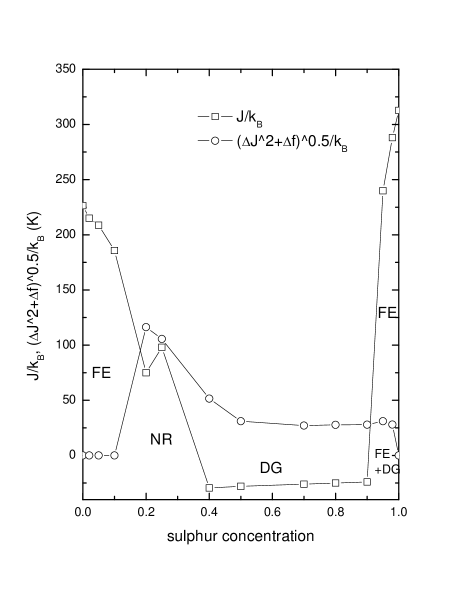
In Fig. 14 we present the obtained phase diagram of mixed crystals. In the mixed CuInP2(SxSe1-x)6 with x0.95 and x0.1 crystals the mean coupling constant J(f+J2)0.5, therefore, they undergo ferroelectric phase transition at J/k. However is significant difference between phase transition dynamics of mixed crystals with x0.95 and x0.1. In mixed crystals with x0.1 no any coexistence of ferroelectric order and dipolar glass disorder is observed down to the lowest temperature (80 K). At temperatures below 100 K the dielectric permittivity of these compounds is very low (about 3), therefore, the phase coexistence in these compounds is unlikely. In the ferroelectric phase these crystals split into domains, it is evidenced in low frequency dielectric dispersion spectra (Fig.1). However similar ferroelectric domains already are observed in pure CuInP2Se6 crystals samulionis . Really, influence of small amount of sulphur to phase transition dynamics of mixed crystals appears only by reduction TC (Table 1). The influence of small amount of selenium to phase transition dynamics is more significant - already at x=0.95 the ferroelectric phase transition in is less expressed (Fig. 13). Such influence is expressed also in other properties: rapid decreasing in TC, appearance of ferroelectric and dipolar glass phase coexistence at x=0.98 and onset of dipolar glass disorder with x between 0.9 and 0.95.
For crystals with x=0.2 and 0.25 J(f+J2)0.5 and J (f+J2)0.5 therefore the nonergodic relaxor phase appears in these crystals at low temperatures. In the presence of an external electric field E meaning coupling constant J is expected to vary as
| (15) |
For electrical field E that J(E) (f+J2)0.5, in mixed crystals should be observed relaxor to ferroelectric phase transition. The possible existence of relaxor phase in mixed ferroelectric-antiferroelectric crystals is stated in matsuhita1 ; korner . Really, no any evidence is indicated for polar nanoregions existence in mixed crystals. We try to fill this gap of information presenting two mixed crystals, where dielectric behaviour is very similar to very well known relaxors PMN levstik and SBN kleeman (the differencies are only in Tm and values). On the other hand, in phase diagram with less selenium concentration no area with nonergodic relaxor phase (Fig. 14) appears. The main cause of such phase diagram is that disorder ((f+J2)0.5) is highest at x=0.2, where mean coupling constant is also high enough. Usually, for mixed crystals is assumed that concentration dependence for f is such tadic
| (16) |
For J similar behaviour also was assumed. In this case if J has minimum at x=0.5 the nonergodic relaxor phase can not be observed. However any existing theories can not explain J and f concentration dependence.
For compounds 0.9x0.4 the relation J (f+J2)0.5 is valid, consequently in these compounds a dipolar glass phase appears at low temperatures.
IV Conclusions
The ferroelectric order in CuInP2S6 is reduced already for small (x=0.98) substitution of sulphur by selenium. By further increasing selenium concentration the dipolar glass phase appears. In contrast to in CuInP2Se6 even a high concentracion of admixture of sulphur (x=0.1) has no any influence to the feroelectric order. The some degree of ferroelectric order exist even for x=0.2 and x=0.25, however, in these crystals the ferroelectricity is broken into polar nano regions. The random bonds and random fields model clearly describe the asymmetricity of phase diagram of mixed CuInP2(SxSe1-x)6, however this model can not identified origin of the effect. To summarize, the first experimental evidence for smearing nonergodic relaxor phase into dipolar glass phase by some doping is presented. For other relaxors the search of some admixture which transforms relaxor state into dipolar glass can also be performed.
References
- (1) V. Maisonneuve, V. B. Cajipe, A. Simon, R. Von der Muhll, and J. Ravez, Phys. Rev.B 56, 10860 (1997).
- (2) V. B. Cajipe, J. Ravez, V. Maisonneuve, A. Simon, C. Payen, R. Von der Muhll and J. E. Fischer, Ferroelectrics 223, 43 (1999).
- (3) X. Bourdon, A. R. Grimmer, V. B. Cajipe, Chem. Mater. 11, 2680, (1999).
- (4) Yu. M. Vysochanskii, V. A. Stephanovich, A. A. Molnar, V. B. Cajipe, and X. Bourdon, Phys. Rev. B. 58, 9119 (1998).
- (5) V. Maisonneuve, J. M. Reau, Ming Dong, V. B. Cajipe, C. Payen, and J. Ravez, Ferroelectrics 196, 257 (1997).
- (6) J. Banys, J. Macutkevic, V. Samulionis, A. Brilingas and Yu. Vysochanskii, Phase Transitions 77, 345 (2004).
- (7) Yu. M. Vysochanskii, A. A. Molnar, M. I. Gurzan, V. B. Cajipe, X. Bourdon, Solid State Comunications 115, 13 (2000).
- (8) X. Bourdon, V. Maisonneuve, V. B. Cajipe, C. Payen, J. E. Fischer, J. Alloys Compd. 283, 122 (1999).
- (9) J. Banys, J. Macutkevic, V. Samulionis, Yu. M. Vysochanskii, Phase Transition (in press).
- (10) Yu. M. Vysochanskii, A. A. Molnar, V. A. Stephanovich, V. B. Cajipe and X. Bourdon, Ferroelectrics 226, 443 (1997).
- (11) Yu. M. Vysochanskii, A. A. Molnar, V. A. Stephanovich, V. B. Cajipe and X. Bourdon, Ferroelectrics 257, 147 (2001).
- (12) J. Banys, R. Grigalaitis, J. Macutkevic, A. Brilingas, V. Samulionis, J. Grigas and Yu. Vysochanskii, Ferroelectrics 318, 163 (2005).
- (13) E. Matsushita and K. Takahashi, Jpn. J. Appl. Phys. 41 7184 (2002).
- (14) A. N. Tikhonov and V. Y. Arsenin, Solution of ill-possed problems (J. Wiley, New York, 1977).
- (15) J. Banys, J. Macutkevic, S. Lapinskas, C. Klimm, G. Voelkel and A. Kloepperpieper, Phys. Rev. B 73, 144202 (2006).
- (16) R. Grigalaitis, J. Banys, A. Kania, A. Slodczyk, J. Phys. 4 128, 127 (2005).
- (17) J. Macutkevic, S. Kamba, J. Banys, A. Brilingas, A. Pashkin, J. Petzelt, K. Bormanis, and A. Sternberg, Phys. Rev. B 74, 104106 (2006).
- (18) S. Kamba, D. Nuzhnyy, S. Veljko, V. Bovtun, J. Petzelt, Y. L. Wang, N. Setter, J. Levoska, M. Tyunina, J. Macutkevic and J. Banys, J. Appl. Phys. 102, 074106 (2007).
- (19) J. Banys, J. Macutkevic, R. Grigalaitis and W. Kleemann, Phys. Rev. B 72, 024106 (2005).
- (20) R. Pirc, R. Blinc and R. Bobnar, Phys. Rev. B 63, 054203 (2001).
- (21) R. Pirc and R. Blinc, Phys. Rev. B 76, 020101 (2007).
- (22) R. Blinc, J. Dolinsek, A. Gregorovic, B. Zalar, C. Filipic, Z. Kutnjak, A. Levstik and R. Pirc, Phys.Rev. Lett.83, 424 (1999).
- (23) Yu. Vysochanskii, L. Beley, S. Perechinskii, M. Gurzan, O.Molnar, O.Mykajlo, V.Tovt and V.Stephanovich, Ferroelectrics 98, 361 (2004).
- (24) R. Pirc, B. Tadic and R. Blinc, Phys. Rev. B 36, 8607 (1987).
- (25) J. M. B. Lopes dos Santos, M. L. Santos, M. R. Chavez, A. Almeida and A. Klopperpieper, Phys. Rev. B 61, 8053 (2000).
- (26) R. Kind, R. Blinc, J. Dolinsek, N. Korner, B. Zalar, P. Cevc, N. S. Dalal, and J. DeLooze, Phys. Rev. B 43, 2511 (1997).
- (27) J. Banys, J. Macutkevic, A. Brilingas, J. Grigas, C. Klimm, G. Voelkel, Phase Transitions, 78, 869 (2005).
- (28) Z. Trybula, V. Hugo Schmidt, and John E. Drumheller, Phys. Rev. B 43, 1287 (1991).
- (29) N. Korner, Ch. Pfammater, and R. Kind, Phys. Rev. Lett. 70, 1283 (1993).
- (30) A. Levstik, Z. Kutnjak, C. Filipic, and R. Pirc, Phys. Rev. B 57, 11204 (1998).
- (31) W. Kleemann, J. Dec, S. Miga, Th. Woike and R. Pankrath, Phys. Rev. B 65, 220101 (2002).