The carbon-rich type Ic SN 2007gr: the photospheric phase
Abstract
The first two months of spectroscopic and photometric monitoring of the nearby type Ic SN 2007gr are presented. The very early discovery (less than 5 days after the explosion) and the relatively short distance of the host galaxy motivated an extensive observational campaign. SN 2007gr shows an average peak luminosity but unusually narrow spectral lines and an almost flat photospheric velocity profile. The detection of prominent carbon features in the spectra is shown and suggest a wide range in carbon abundance in stripped-envelope supernovae. SN 2007gr may be an important piece in the puzzle of the observed diversity of CC SNe.
1 Introduction
Massive stars (M 8 M⊙) end their lives as core-collapse supernovae (CC SNe). SNe resulting from stars that had lost their H envelopes before they collapse are called stripped-envelope CC SNe (cf. Clocchiatti et al., 1996; Filippenko, 1997) and are traditionally classified as type Ib if the He envelope was still present and type Ic if it had been lost.
Stripped-envelope CC-SNe show a large variety of observed properties (Turatto et al., 2007), depending on the physical parameters of the progenitor stars (radius, mass, chemical composition, circumstellar environment) at the time of explosion. The variety of stripped envelope CC SNe became even more evident when in the late 1990’s a few SNe Ic with extremely broad spectral features were discovered, some of which had also unusually high luminosity (e.g. Galama et al., 1998). This prompted the introduction of a new subclass, named broad-line SNe Ic (SNe BL-Ic). The broad spectral lines in SNe BL-Ic suggest high velocities of the expanding ejecta and a large kinetic energy to ejected mass ratio. Recently some objects with yet unprecedented characteristics have been discovered (e.g. SN 2006jc, Pastorello et al., 2007). In this letter we focus on the early-phase observations of SN 2007gr, another type Ic stripped-envelope CC SN with interesting properties.
2 Spectral evolution and line identification
SN 2007gr exploded in NGC 1058 (Li et al., 2007), a member of a group of nearby galaxies. The distance to NGC 925, one of the galaxies belonging to the group, was measured as 9.3 Mpc using Cepheid stars (Silbermann et al., 1996). We adopted this distance also for NGC 1058000A different distance (10.61.3 Mpc) was used by Crockett et al. (2007) in a previous work on SN 2007gr. With this distance the SN would be 0.28 magnitude brighter than calculated here.. SN 2007gr is thus one of the nearest stripped-envelope CC SNe ever observed, and a suitable target for progenitor search (Crockett et al., 2007). NGC 1058 is a prolific host of SNe: two other CC SNe (1961V and 1969L) occurred in the galaxy.
SN 2007gr was discovered on 2007 Aug 15.51 UT, but was not detected in a KAIT image taken on Aug 10.44 UT (unfiltered mag , Madison & Li, 2007). This constrains the explosion epoch to 5 days before discovery, which by itself makes of SN 2007gr a very interesting event. Based on a spectrum obtained the following night, SN 2007gr was classified as a generic SN Ib/c since it was not clear whether the line near 6350Å was really He i (as for SNe Ib) (Chornock et al., 2007). As described below, the later spectral evolution did not confirm the presence of He. SN 2007gr is thus to be classified as type Ic.
Starting the night after the discovery, we observed SN 2007gr almost every night until it reached maximum brightness, and then less frequently during the decline phase. Thanks to the good spectral coverage during the rising phase, unprecedented for a type Ic SN, the origin of the 6350Å feature can be investigated in detail. This feature is visible in the earliest spectra of several SNe Ic, sometimes partially blended with a feature near 6150Å which is often attributed to Si ii111Other ions have been also suggested for the Å feature: Ne i (Sauer et al., 2006) or detached H (Branch et al., 2006)..
Against the identification of the 6350Å feature as He i (Chornock et al., 2007) is the fact that while in SNe Ib the intensity of the helium features typically increases with time (Matheson et al., 2001), as is expected because of the increased diffusion of -rays (Mazzali & Lucy, 1998), in SN 2007gr the feature decreases and the line even disappears around maximum (see Fig. 1). A more likely identification for this line is C ii 6580 at km s-1. This interpretation is supported by the presence of another line at Å attributed to C ii 7235, which also disappears around maximum. The velocity of C ii is similar to that of the lines of other ions. The C ii features in SN 2007gr show an evolution similar to that seen in SNe Ia at similar phases (Mazzali, 2001).
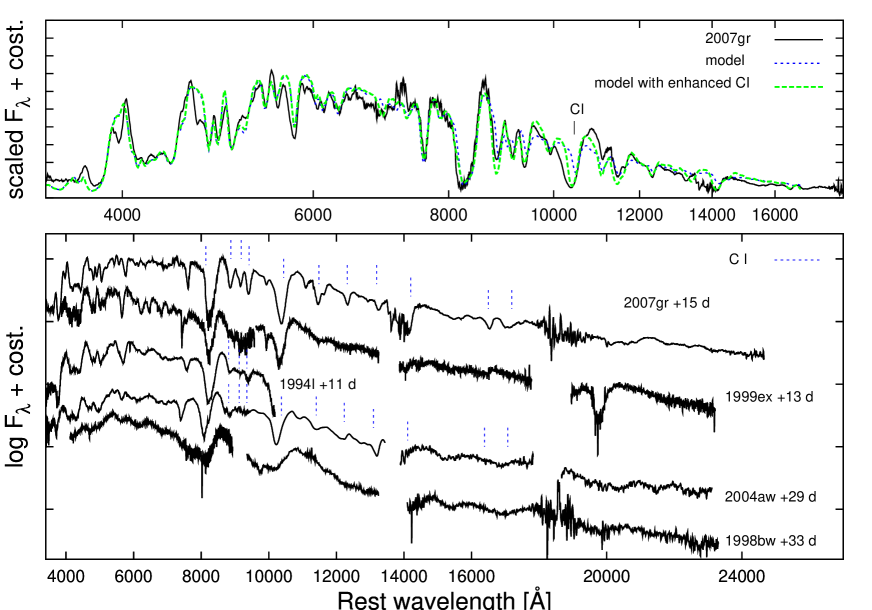
At later epochs, after the C ii features fade, strong C i lines appear in the spectra, in particular in the near infrared, indicating a decrease of the temperature. This is shown in Fig. 2 (upper panel) where the optical and infrared spectrum of SN 2007gr at two weeks past maximum is compared with synthetic spectra calculated using a Monte Carlo spectrum synthesis code (Mazzali & Lucy, 1993; Lucy, 1999; Mazzali, 2000). We assumed a power-law density profile () and a lower boundary “photospheric” velocity km s-1, with an ejecta mass above the photosphere of M⊙.
The composition was taken to be homogeneous for all elements and includes O, C, Ne, a total of Na, Mg, Si, S, and Ca, and about heavy elements (Sc, Ti, Cr, Fe, Co, and Ni).
The model (dotted line in Fig. 2) provides a reasonable fit to the observed spectrum. The absorptions seen in the IR are mostly caused by C i, but the observed line strength is not reproduced. For the density structure used in the models the depth of the C i features is relatively insensitive to the C mass fraction for mass fractions exceeding . Therefore, the simple density structure used here may need improvement, specifically at high velocities to allow more carbon to recombine than predicted by the model.
To show this more clearly, in Fig. 2, we also show (dashed line) a model where the optical depth in all C i lines is artificially enhanced at km s-1by factors of 20 to 100 at different velocities. The feature at 10,400 Å, can be explained almost entirely by C i in this way, except for blue wing that is probably due to other ions (e.g. Mg ii, Si i or He i, Gerardy et al., 2002; Filippenko et al., 1995).
In previous analyses of SN 1994I, the origin of the Å absorption was discussed, including the possibility of a contribution of C i (Millard et al., 1999; Sauer et al., 2006). SN 2007gr shows a much stronger signature of this ion than other events, which makes this identification more convincing.
A common alternative identification of this line is He i (Filippenko et al., 1995); however, none of the other He i features that are expected are present in our observed spectrum to a strength sufficiently large to support this identification. In particular, the He i line at 20580Å should be clearly visible if He i were the main contributor to the 10400Å absorption.
Incidentally, among the stripped-envelope CC SNe shown in the bottom panel of Fig. 2, only SN 1999ex (a SN Ib) shows a strong He i 20587. The other SNe are all of type Ic, and none of them show that feature. The C i features are particularly strong in SN 2007gr, while they are weaker in SNe 1994I and 2004aw and absent in SNe 1998bw, 2002ap, and 1999ex. SN 1999ex may have burned most of the progenitor’s carbon, since at the early phases it shows quite strong Mg ii features (Hamuy et al., 2002). Mg is one of the elements produced in carbon burning (Woosley et al., 2002).
The low C abundance in the BL SN Ic 2002ap is confirmed by a study of the near-IR spectra (Gerardy et al., 2002). These authors also noted the presence of C i in the infrared spectrum of the SN Ic 2000ew, and the absence of strong C i in the SN Ib 2001B.
The emerging evidence calls for a complex scenario. It is not clear why some SNe Ib and BL SNe Ic show weak (if any) carbon features, while normal SNe Ic show a wide range in C/O optical lines. The low carbon abundance in BL SNe Ic could be due to more massive and/or lower metallicity progenitors (Woosley et al., 2002) than for standard SNe Ic. However, it is difficult to place SNe Ib in the same context.
3 Narrow lines and photospheric velocity
The identification of C i in the infrared spectra of SN 2007gr is facilitated by the fact that the spectral features in this SN are narrower than in other SNe Ic (for instance, the Fe ii features at 4924, 5018, 5170Å are unblended, which is very uncommon for type Ic SNe).
The narrow lines are probably related to the particularly slow evolution of the photospheric expansion velocity of SN 2007gr which ranges from 11000 km s-1 one week after explosion to 4800 km s-1 at days after explosion. The small range of velocities at which the lines could form makes them narrow compared to other SNe Ic. By contrast, SN 2002ap reaches even lower velocities than SN 2007gr at late phases, but it still shows broad features. This is due to the shallow density gradient and the huge velocity range at which the lines can form in SN 2002ap. In fact, at early phases the velocity derived for SN 2002ap is km s-1 higher than that obtained for SN 2007gr. No data are available for other stripped-envelope CC SNe Ic at such an early epoch.
The fact that at days after explosion SN 2007gr is still optically thick inside 5000 km s-1 and that there is not enough material outside 11000 km s-1 to form lines may suggest that SN 2007gr is a compact object inside km s-1, with a sharp tail out to 11000 km s-1.
4 Light curve
SN 2007gr reached maximum on Aug 28 at . Adopting a distance modulus of 29.84, a galactic extinction of E(B-V)=0.062 (Schlegel et al., 1998), and a host galaxy extinction of E(B-V)=0.03, the absolute R magnitude is -17.3 (see Fig. 4). The estimate of the host galaxy extinction is derived from the relative intensity of the galactic and host galaxy interstellar Na i D1 absorption lines, assuming that the galactic and host galaxy dust properties are similar. Equivalent widths of 0.31 and 0.13 Å were measured for the galactic and host galaxy components of Na i D, respectively, in a high-resolution spectrum obtained with the FIES Echelle spectrograph at NOT.
The rise time of SN 2007gr is constrained by the KAIT telescope non-detection of 10 August. Thus the rise time to R maximum turns out to be 14-18 days. The rise time to B maximum (which occurred on 24 August) is 10-14 days, intermediate between those of SN 2002ap (8 days, Foley et al., 2003) and SN 1999ex (18 days, Stritzinger et al., 2002). After maximum, the luminosity decline rate is similar to that of SNe 2002ap and 1999ex, while SNe 2004aw and 1998bw are slower, and SN 1994I is faster.
5 Discussion
From the light curve comparison and the photospheric velocity evolution, we can get some estimates for the physical parameters of SN 2007gr.
The absolute R maximum of SN 2007gr, is similar to that of SN 2002ap (). Therefore these SNe likely produced a similar amount of 56Ni ( 0.07-0.1 M⊙), SN 2007gr possibly slightly more than SN 2002ap owing to the longer rise time.
The width of the light curve and the photospheric velocity around maximum depend on the ejected mass and the kinetic energy (Arnett, 1982, 1996) as follows:
and .
Since the photospheric velocity of SN 2007gr around maximum is similar to that of SN 1994I, while the peak of the light curve is 1.5 times broader, we expect an ejected mass of M⊙, and a kinetic energy erg222The ejected mass and kinetic energy are derived scaling the values obtained by Sauer et al. (2006) and Mazzali et al. (2007) for SNe 1994I and 2002ap, respectively..
A more robust estimate of the ejected mass and kinetic energy will be derived from the nebular data and their detailed modelling (e.g. Mazzali et al., 2007), but our preliminary estimates already suggest that SN 2007gr resembles SN 2002ap in terms of mass ejected even though the kinetic energy is a factor of two smaller. This combination makes SN 2007gr similar to SN 1994I with respect to the ratio of kinetic energy to ejected mass, but with a steeper density profile, resulting in narrow lines.
The analysis of the photospheric phase of SN 2007gr confirms the wide variety of Ic SNe, not only in light-curve shape and width of the spectral features, but also in the range of carbon abundances and the shape of underlying density profiles.
If asymmetry is the key to explain this heterogeneity, the similar light curves of SN 2007gr and SN 2002ap combined with the different density profiles (compact for SN 2007gr and extended for SN 2002ap) may suggest that SN 2007gr and SN 2002ap were asymmetric bipolar explosions observed close to the minor and major axis, respectively. Nebular spectra may provide important information to corroborate this hypothesis. Other scenarios to explain the heterogeneity of stripped-envelope CC SNe (different progenitor, radius, mass, chemical composition, circumstellar environment) cannot be excluded on the basis of the present data.
References
- Arnett (1982) Arnett, W. D. 1982, ApJ, 253, 785
- Arnett (1996) Arnett, D. 1996, Supernovae, Princeton, NJ: Princeton University Press.
- Branch et al. (2006) Branch, D., Jeffery, D. J., Young, T. R., & Baron, E. 2006, PASP, 118, 791
- Chornock et al. (2007) Chornock, R., Filippenko, A. V., Li, W., Foley, R. J., Reitzel, D., & Rich, R. M. 2007, CBET, 1036, 1
- Clocchiatti et al. (1996) Clocchiatti, A., Wheeler, J. C., Benetti, S., & Frueh, M. 1996, ApJ, 459, 547
- Crockett et al. (2007) Crockett, R. M., et al. 2007, ArXiv e-prints, 709, arXiv:0709.2354
- Filippenko et al. (1995) Filippenko, A. V., et al. 1995, ApJL, 450, L11
- Filippenko (1997) Filippenko, A. V. 1997, ARA&A, 35, 309
- Foley et al. (2003) Foley, R. J., et al. 2003, PASP, 115, 1220
- Galama et al. (1998) Galama, T. J., et al. 1998, Nature, 395, 670
- Gerardy et al. (2002) Gerardy, C. L., Marion, G. H., Fesen, R. A., Höflich, P., Wheeler, J. C., Nomoto, K., & Motohara, K. 2002, BAAS, 34, 1204
- Hamuy et al. (2002) Hamuy, M., et al. 2002, AJ, 124, 417
- Heger et al. (2003) Heger, A., Fryer, C. L., Woosley, S. E., Langer, N., & Hartmann, D. H. 2003, ApJ, 591, 288
- Iwamoto et al. (1998) Iwamoto, K., et al. 1998, Nature, 395, 672
- Li et al. (2007) Li, W., Cuillandre, J.-C., van Dyk, S. D., & Filippenko, A. V. 2007, CBET, 1041, 1
- Lucy (1991) Lucy, L. B. 1991, ApJ, 383, 308
- Lucy (1999) Lucy, L. B. 1999, A&A, 345, 211
- Madison & Li (2007) Madison, D., & Li, W. 2007, CBET, 1034, 1
- Matheson et al. (2001) Matheson, T., Filippenko, A. V., Li, W., Leonard, D. C., & Shields, J. C. 2001, AJ, 121, 1648
- Mazzali & Lucy (1993) Mazzali, P. A. & Lucy, L. B. 1993, A&A, 279, 447
- Mazzali & Lucy (1998) Mazzali, P. A. & Lucy, L. B. 1998, MNRAS, 295, 428
- Mazzali (2000) Mazzali, P. A. 2000, A&A, 363, 705
- Mazzali (2001) Mazzali, P. A. 2001, MNRAS, 321, 341
- Mazzali et al. (2002) Mazzali, P. A., et al. 2002, ApJ, 572, L61
- Mazzali et al. (2007) Mazzali, P. A., et al. 2007, ArXiv e-prints, 708, arXiv:0708.0966
- Millard et al. (1999) Millard, J., et al. 1999, ApJ, 527, 746
- Pastorello et al. (2007) Pastorello, A., et al. 2007, Nature, 447, 829
- Patat et al. (2001) Patat, F., et al. 2001, ApJ, 555, 900
- Podsiadlowski (1996) Podsiadlowski, P. 1996, Hydrogen Deficient Stars, 96, 419
- Richmond et al. (1996) Richmond, M. W., et al. 1996, AJ, 111, 327
- Sauer et al. (2006) Sauer, D. N., Mazzali, P. A., Deng, J., Valenti, S., Nomoto, K., & Filippenko, A. V. 2006, MNRAS, 369, 1939
- Schlegel et al. (1998) Schlegel, D. J., Finkbeiner, D. P., & Davis, M. 1998, ApJ, 500, 525
- Silbermann et al. (1996) Silbermann, N. A., et al. 1996, ApJ, 470, 1
- Stritzinger et al. (2002) Stritzinger, M., et al. 2002, AJ, 124, 2100
- Taubenberger et al. (2006) Taubenberger, S., et al. 2006, MNRAS, 371, 1459
- Turatto et al. (2007) Turatto, M., Benetti, S., & Pastorello, A. 2007, American Institute of Physics Conference Series, 937, 187
- Valenti et al. (2007) Valenti, S., et al. 2007, ArXiv e-prints, 710, arXiv:0710.5173
- Woosley et al. (2002) Woosley, S. E., Heger, A., & Weaver, T. A. 2002, Reviews of Modern Physics, 74, 1015
- Yoshii et al. (2003) Yoshii, Y., et al. 2003, ApJ, 592, 467