Present address: ]Institute of Applied Physics, University of Tsukuba
Ultrafast Electron-Phonon Decoupling in Graphite
Abstract
We report the ultrafast dynamics of the 47.4 THz coherent phonons of graphite interacting with a photoinduced non-equilibrium electron-hole plasma. Unlike conventional materials, upon photoexcitation the phonon frequency of graphite upshifts, and within a few picoseconds relaxes to the stationary value. Our first-principles density functional calculations demonstrate that the phonon stiffening stems from the light-induced decoupling of the non-adiabatic electron-phonon interaction by creating the non-equilibrium electron-hole plasma. Time-resolved vibrational spectroscopy provides a window on the ultrafast non-equilibrium electron dynamics.
pacs:
78.47.+p, 63.20.-Kr, 71.15.Mb, 81.05.UwGraphite possesses highly anisotropic crystal structure, with strong covalent bonding of atoms within and weak van der Waals bonding between the hexagonal symmetry graphene sheets. The layered lattice structure translates to a quasi-2D electronic structure, in which the electronic bands disperse linearly near the Fermi level () and form point-like Fermi surfaces. The discovery of massless relativistic behavior of quasiparticles at of graphene and graphite has aroused great interest in the nature of carrier transport in these materials Novoselov et al. (2005); Geim and Novoselov (2007); Zhou et al. (2006). Because of the linear dispersion of the electronic bands, the quasiparticle mass associated with the charge carrier interaction with the periodic crystalline lattice nearly vanishes, leading to extremely high electron mobilities and unusual half-integer quantum Hall effect in graphene Novoselov et al. (2005); Geim and Novoselov (2007). Since graphite has a quasi-2D band structure very similar to that of graphene, these electronic properties may be expressed also in graphite.
The electron-phonon (e-p) interaction contributes to the carrier mass near and limits the high-field transport through the carrier scattering. The strong e-p interaction in graphite is a distinctive characteristic of ineffective screening of the Coulomb interaction in semimetals DiVincenzo and Mele (1984); Spataru et al. (2001). It is expressed in the phonon frequency shift by carrier doping Dresselhaus and Dresselhaus (1982), electron scattering-mediated vibrational spectrum Thomsen and Reich (2000) and strong electronic renormalization of the phonon bands (Kohn anomalies) Piscanec et al. (2004). Time-resolved measurements on the optically generated non-thermal electron-hole (e-h) plasma in graphite provide evidence for the carrier thermalization within 0.5 ps both through electron-electron (e-e) scattering and optical phonon emission Kampfrath et al. (2005). The non-thermal carriers decay non-uniformly in phase space because of the anisotropic band structure of graphite Moos et al. (2001); Spataru et al. (2001). Quasiparticle correlations in non-thermal plasmas can also be probed from the perspective of the coherent optical phonons. In the present study we probe the transient changes in the e-p coupling induced by the optical perturbation of the non-adiabatic Kohn anomaly through the time-dependent complex self-energy (frequency and lifetime) of the 47 THz phonon of graphite.
To probe the ultrafast response of the coherent phonons we perform transient anisotropic reflectivity measurements Hase et al. (2003); Ishioka et al. (2006) on a natural single crystal and highly oriented pyrolytic graphite (HOPG) samples. HOPG has long range order along the c-axis, but each layer consists of m-size domains with random azimuthal orientation. Because the phonon properties were identical, we report the results for HOPG only, whose better surface optical quality gave superior signal-to-noise ratio. The light source for the pump-probe reflectivity measurements is a Ti:sapphire femtosecond laser oscillator with 10 fs pulse duration. The fundamental output is frequency-doubled in a -barium borate crystal to obtain 395 nm excitation light. The 3.14 eV photons excite vertical transitions from the valence () to the conduction () bands near the K point Maeda et al. (1988). A spherical mirror brings parallel linearly polarized pump and probe beams to a common 10 m focus on the sample with angles of 20∘ and 5 from the surface normal, respectively. Pump power is varied between 5 and 50 mW (pulse fluence of 0.1 - 1mJ/cm2), while probe power is kept at 2 mW. Isotropic reflectivity change (R) gives a straightforward polarization dependence, while anisotropic reflectivity change () eliminates the mostly isotropic electronic response to isloate the much weaker anisotropic contribution, which is dominated by the coherent phonon response Hase et al. (2003). Time delay t between the pump and probe pulses is modulated at 20 Hz to enable accumulation and averaging of up to 25,000 scans with a digital oscilloscope. The delay scale is calibrated with recording the interference fringes of a He-Ne laser Ishioka et al. (2006).
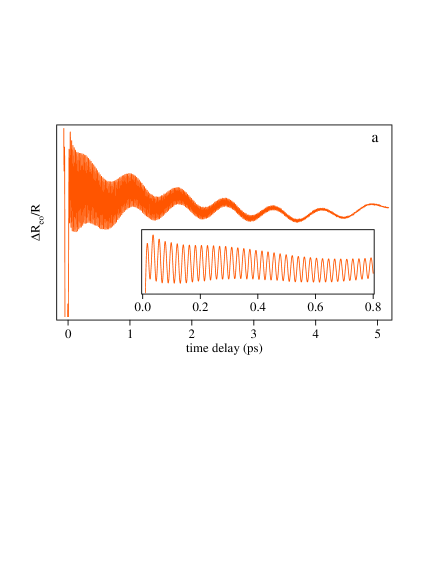
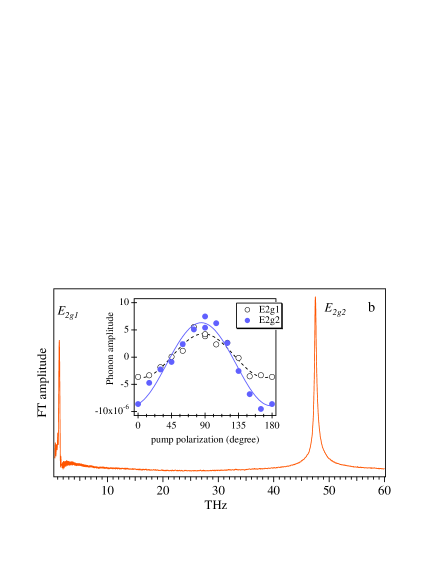
Figure 1a shows the anisotropic reflectivity change of graphite, , normalized to the reflectivity without pump pulse. After a fast and intense electronic response at t=0, the reflectivity is modulated at two disparate periods of 21 and 770 fs. The slower coherent oscillation was previously assigned to the Raman active interlayer shear phonon ( mode) Mishina et al. (2000). The faster oscillation of 47.4 THz or 1580 cm-1 is the in-plane carbon stretching mode Dresselhaus and Dresselhaus (1982) corresponding to the G-peak in the Raman spectra of graphitic materials. After decay of the electronic response, the reflectivity signal for 100 fs can be fitted approximately to a sum of damped oscillations: . The amplitudes of both phonons, and , exhibit a dependence on the pump polarization angle with respect to the optical plane, as shown in the inset of Fig. 1b, confirming their generation through the Raman mechanism Mishina et al. (2000). Hereafter we focus on the previously unobserved dynamics of the fast phonon.
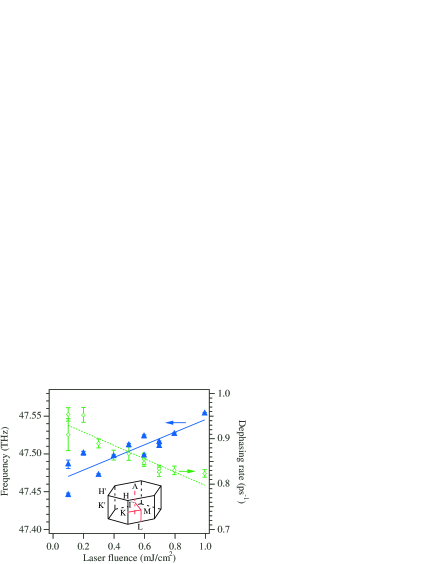
We measure the laser fluence dependence of the coherent phonon amplitude , dephasing rate , and frequency of the phonon that are extracted from the fit of to the damped oscillator model. The amplitude increases linearly with the fluence as expected for a transition with a single photon. As shown in Fig. 2, the dephasing rate decreases as the laser fluence is increased, which is contrary to the coherent phonon response observed for other materials Hase et al. (2002); Murray et al. (2005); Zijlstra et al. (2006). The frequency upshift at higher fluence in Fig. 2 is equally exceptional. Laser heating can be excluded as the origin, because the frequency downshifts with temperature Tan et al. (1998). In fact, the frequency upshift under intense optical excitation has not been observed experimentally or predicted theoretically for graphite or any other solid.
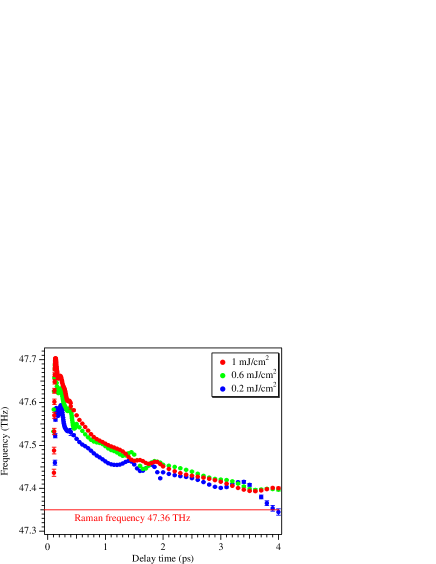
To further characterize the unexpected frequency upshift, in Fig. 3 we analyze the transient reflectivity response with a time-windowed Fourier transform (FT). This analysis reveals that the phonon frequency blue-shift occurs promptly (its dynamics are obscured by the strong electronic response for delays of 100 fs), and recovers to its near-equilibrium value after several picoseconds. With increasing laser fluence the initial blue-shift increases, while the asymptotic value converges on the 47.4 THz Raman frequency. The experimental phonon frequency for 100 fs follows a biexponential recovery, , with time constants of =210 fs and =2.1 ps, independent of excitation density. The time scales for the recovery are in reasonable agreement with the analysis of transient terahertz spectroscopy, which gave 0.4 and 4 ps, respectively for the carrier thermalization and carrier-lattice equilibration Kampfrath et al. (2005). The time evolution of the frequency implicates the interaction of coherent phonons with the photoexcited non-equilibrium carriers, as will be discussed below.
It is only recently that the observed anomalous dispersion of the high-energy phonon branches of graphite Maultzsch et al. (2004) could be explained theoretically by a momentum dependent e-p interaction (a Kohn anomaly), which leads to the renormalization (softening) of the phonon frequency Piscanec et al. (2004). Standard use of the adiabatic approximation in the previous study, however, predicted that perturbing the electronic system by electron doping would result in a downshift of phonons at the point. Recent experiments and theoretical calculations have shown this approach to be inappropriate as the “non-adiabatic” electronic effects, where electrons near cannot respond instantaneously to the lattice distortion, become important for low dimensional materials such as graphene and nanotubes Pisana et al. (2007); Lazzeri and Mauri (2006); Piscanec et al. (2007).
We perform density functional theory (DFT) calculations for a single sheet of photoexcited graphite with a new computational method that accounts for the non-adiabatic effects. We use DFT in the local-density approximation (LDA) as implemented in the code ABINIT Gonze et al. (2002). Core electrons are described by Trouiller-Martins pseudopotentials and the wave-functions are expanded in plane waves with energy cutoff at 35 Hartree. For the present work the specific form of the exchange-correlation functional (LDA or GGA) does not change the emerging physical picture. For reasons of computational feasibility, we have performed calculations on single-layer graphene, as it is often done for the description of the optical phonons of graphite Maultzsch et al. (2004); Wirtz and Rubio (2004). In order to ensure convergence of the phonon mode to within 0.01 THz, we use a large 6161 two-dimensional -point sampling. The phonons are computed using density-functional perturbation theory Baroni et al. (2001). “Non-adiabatic effects” are accounted for by keeping the electronic population fixed when computing the dynamical matrix. This means that the occupation of each electronic level is specified in the input of the calculation and is kept constant upon the displacement of the atoms. We neglect the effects of lattice relaxation on the phonon frequency since we checked that the effect of neutral excitation on the bond-length is very weak ( 0.001 Å) for the appropriate excitation densities. Our approach is similar to the time-dependent perturbation scheme Pisana et al. (2007); Lazzeri and Mauri (2006); Piscanec et al. (2007) for the inclusion of non-adiabaticity in the combined treatment of phonons and electrons in graphite. Furthermore, it enables us to calculate the effect of an arbitrary electron occupation far from equilibrium such as created by the vertical excitation of e-h pairs with 3.1 eV photons.
Because the photoexcited electron distribution is time-dependent and, in principle, not known exactly, we employ three different limiting distributions. “As excited” distribution (AED), correspondiing to the vertical excitation of e-h pairs with 3.1 eV photons within an energy window of 0.2 eV, simulates the distribution right after excitation with a laser pulse having a finite spectral width. The laser fluence determines the amount of charge transferred from to bands. Non-thermal distribution (NTD), in which electrons are completely depopulated in an small energy window from top of the valence band to the bottom of conduction band, mimics the e-h distribution after the ultrafast (100 fs Moos et al. (2001); Manzoni et al. (2005)) decay of the primary excitation into the secondary e-h pairs around . The width of the energy window is determined by the excited charge density. Hot thermal distribution (TD), in which the occupation follows the Fermi-Dirac distribution with a high electronic temperature, simulates the distribution after thermalization of the electronic system (0.5 ps Kampfrath et al. (2005)). To compare with the effect of static doping reported previously Pisana et al. (2007); Lazzeri and Mauri (2006); Piscanec et al. (2007), we also present calculations with an ionized distribution (ID), in which electrons are removed from the top of the band.
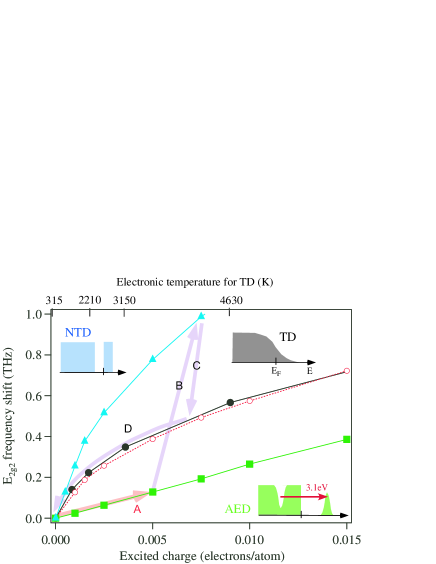
Figure 4 shows that all the three excited state distributions, as well as the statically doped one, lead to a stiffening of the phonon. For a fixed density of the excited charge, the closer the e-h pairs are to the , the more pronounced is their non-adiabatic interaction with the lattice, and therefore, the stronger is their effect on the phonon stiffening. We note that the stiffening is not accompanied by lattice deformation for the three excited distributions, contrary to the case of ID, for which the lattice both stiffens and contracts. The lattice stiffening for ID can be attributed to the depopulation of orbitals around the K and H points, which (i) suppresses the non-adiabaticity in the e-p coupling and (ii) removes electrons with strong anti-bonding admixture Lazzeri and Mauri (2006); Pisana et al. (2007). Because the effect (ii) should also lead to a lattice contraction, the C-C bond stiffening under the three excited distributions is attributed to the effect (i). This implies that the stiffening is causedd by transfer cold electrons and holes from near the to a hot population, which increases the ability of the electronic system to follow the ions adiabatically. In contrast to the static doping studies Lazzeri and Mauri (2006); Pisana et al. (2007), our observations on a neutral but non-equilibrium system address a phonon frequency shift solely of the electronic origin.
The strong dependence of the phonon stiffening on the e-h distribution in Fig. 4 justifies interpretation of the experimental ultrafast phonon frequency changes in terms of the temporal evolution of the photoexcited e-h plasma. The photoexcitation of carriers weakens the non-adiabatic e-p coupling. The reduced real part (frequency) and the increased imaginary part (decay rate) of the self-energy of e-p interaction increases the frequency and reduces the dephasing rate of the mode. The frequency recovers biexponentially on the time scales of electron thermalization and energy transfer to the lattice. Thus, we conclude that the experimentally observed time evolution of the phonon frequency is governed by the relaxation processes of the highly non-thermal electronic population created at =0 near the -point (arrow A in Fig. 4). The very efficient e-e scattering first brings the non-thermal e-h carriers close to the Fermi level (near point) within a few tens of fs (arrow B), and then to electronic-thermalization in about 0.2 ps (arrow C). This hot-thermal distribution equilibrates with the lattice through optical phonon emission on 2 ps time scale (arrow D).
In summary, we have explored the influence of the non-equilibrium e-h plasma on the femtosecond dynamics of the in-plane coherent phonon of graphite. The time-dependent phonon frequency probes sensitively the time evolution of the transient electronic occupation distributions. The unusual electronic stiffening of the phonon can be attributed to the excitation-induced reduction of the e-p coupling due to quasi-2D electronic structure. Our results offer a new paradigm of e-p coupling, where non-equilibrium electrons impart exceptional properties to the lattice. Similar interactions are likely to govern the e-p coupling in related graphitic materials, such as carbon nanotubes and graphene, that are of topical interest for high-performance, nanometer scale carbon-based electronic devices.
The authors thank O.V. Misochko for supplying single crystal graphite. Calculations are performed at IDRIS (project 061827), Barcelona Supercomputing Center and UPV/EHU (SGIker Arina). This work is supported by Kakenhi-18340093, the EU Network of Excellence Nanoquanta (NMP4-CT-2004-500198), Spanish MEC (FIS2007-65702-C02-01), French ANR, EU projects SANES (NMP4-CT-2006-017310), DNANANODEVICES (IST-2006-029192), and the NSF CHE-0650756. H.P. thanks Donostia International Physics Center and Ikerbasque for support during the writing of this manuscript.
References
- Novoselov et al. (2005) K. S. Novoselov, A. K. Geim, S. V. Morozov, D. Jiang, M. I. Katsnelson, I. V. Grigorieva, S. V. Dubonos, and A. A. Firsov, Nature 438, 197 (2005).
- Geim and Novoselov (2007) A. K. Geim and K. S. Novoselov, Nature Materials 6, 183 (2007).
- Zhou et al. (2006) S. Y. Zhou, G. H. Gweon, J. Graf, A. V. Fedorov, C. D. Spataru, R. D. Diehl, Y. Kopelevich, D. H. Lee, S. G. Louie, and A. Lanzara, Nature Physics 2, 595 (2006).
- DiVincenzo and Mele (1984) D. P. DiVincenzo and E. J. Mele, Phys. Rev. B 29, 1685 (1984).
- Spataru et al. (2001) C. D. Spataru, M. A. Cazalilla, A. Rubio, L. X. Benedict, P. M. Echenique, and S. G. Louie, Phys. Rev. Lett. 87, 246405 (2001).
- Dresselhaus and Dresselhaus (1982) M. S. Dresselhaus and G. Dresselhaus, in Light Scattering in Solids III, edited by M. Cardona and G. Güntherodt (Springer, Berlin, 1982), vol. 51 of Topics in Applied Physics, p. Ch. 2.
- Thomsen and Reich (2000) C. Thomsen and S. Reich, Phys. Rev. Lett. 85, 5214 (2000).
- Piscanec et al. (2004) S. Piscanec, M. Lazzeri, F. Mauri, A. C. Ferrari, and J. Robertson, Phys. Rev. Lett. 93, 185503 (2004).
- Kampfrath et al. (2005) T. Kampfrath, L. Perfetti, F. Schapper, C. Frischkorn, and M. Wolf, Phys. Rev. Lett. 95, 187403 (2005).
- Moos et al. (2001) G. Moos, C. Gahl, R. Fasel, M. Wolf, and T. Hertel, Phys. Rev. Lett. 87, 267402 (2001).
- Hase et al. (2003) M. Hase, M. Kitajima, A. M. Constantinescu, and H. Petek, Nature 426, 51 (2003).
- Ishioka et al. (2006) K. Ishioka, M. Hase, M. Kitajima, and H. Petek, Appl. Phys. Lett. 89, 231916 (2006).
- Maeda et al. (1988) F. Maeda, T. Takahashi, H. Ohsawa, S. Suzuki, and H. Suematsu, Phys. Rev. B 37, 4482 (1988).
- Mishina et al. (2000) T. Mishina, K. Nitta, and Y. Masumoto, Phys. Rev. B 62, 2908 (2000).
- Hase et al. (2002) M. Hase, M. Kitajima, S. Nakashima, and K. Mizoguchi, Phys. Rev. Lett. 88, 067401 (2002).
- Murray et al. (2005) E. D. Murray, D. M. Fritz, J. K. Wahlstrand, S. Fahy, and D. A. Reis, Phys. Rev. B 72, 060301(R) (2005).
- Zijlstra et al. (2006) E. S. Zijlstra, L. L. Tatarinova, and M. E. Garcia, Phys. Rev. B 74, 220301(R) (2006).
- Tan et al. (1998) P. H. Tan, Y. M. Deng, and Q. Zhao, Phys. Rev. B 58, 5435 (1998).
- Maultzsch et al. (2004) J. Maultzsch, S. Reich, C. Thomsen, H. Requardt, and P. Ordejón, Phys. Rev. Lett. 92, 075501 (2004).
- Pisana et al. (2007) S. Pisana, M. Lazzeri, C. Casiraghi, K. S. Novoselov, A. K. Geim, A. Ferrari, and F. Mauri, Nature Materials 6, 198 (2007).
- Lazzeri and Mauri (2006) M. Lazzeri and F. Mauri, Phys. Rev. Lett. 97, 266407 (2006).
- Piscanec et al. (2007) S. Piscanec, M. Lazzeri, J. Robertson, A. C. Ferrari, and F. Mauri, Phys. Rev. B 75, 035427 (2007).
- Gonze et al. (2002) X. Gonze, J.-M. Beuken, R. Caracas, F. Detraux, M. Fuchs, G.-M. Rignanese, L. Sindic, M. Verstraete, G. Zerah, F. Jollet, et al., Comp. Mat. Sci. 25, 478 (2002).
- Wirtz and Rubio (2004) L. Wirtz and A. Rubio, Solid State Commun. 131, 141 (2004).
- Baroni et al. (2001) S. Baroni, S. de Gironcoli, A. D. Corso, and P. Giannozzi, Rev. Mod. Phys. 73 (2001).
- Manzoni et al. (2005) C. Manzoni, A. Gambetta, E. Menna, M. Meneghetti, G. Lanzani, and G. Cerullo, Phys. Rev. Lett. 94, 207401 (2005).