C, N, O Abundances in the Most Metal-Poor Damped Lyman alpha Systems††thanks: Based in part on data obtained at the W.M. Keck Observatory, which is operated as a scientific partnership among the California Institute of Technology, the University of California, and NASA, and was made possible by the generous financial support of the W.M. Keck Foundation. Based in part on UVES observations made with the European Southern Observatory VLT/Kueyen telescope at Paranal, Chile, obtained in programme 078.A-0185(A) and from the public data archive.
Abstract
This study focuses on some of the most metal-poor damped Ly absorbers known in the spectra of high redshift QSOs, using new and archival observations obtained with UV-sensitive echelle spectrographs on the Keck and VLT telescopes. The weakness and simple velocity structure of the absorption lines in these systems allow us to measure the abundances of several elements, and in particular those of C, N, and O, a group that is difficult to study in DLAs of more typical metallicities. We find that when the oxygen abundance is less than of solar, the C/O ratio in high redshift DLAs and sub-DLAs matches that of halo stars of similar metallicity and shows higher values than expected from galactic chemical evolution models based on conventional stellar yields. Furthermore, there are indications that at these low metallicities the N/O ratio may also be above simple expectations and may exhibit a minimum value, as proposed by Centurión and her collaborators in 2003. Both results can be interpreted as evidence for enhanced production of C and N by massive stars in the first few episodes of star formation, in our Galaxy and in the distant proto-galaxies seen as QSO absorbers. The higher stellar yields implied may have an origin in stellar rotation which promotes mixing in the stars’ interiors, as considered in some recent model calculations. We briefly discuss the relevance of these results to current ideas on the origin of metals in the intergalactic medium and the universality of the stellar initial mass function.
keywords:
1 Introduction
The neutral hydrogen clouds which give rise to damped Lyman alpha systems (DLAs; Wolfe, Gawiser, & Prochaska 2005) in the spectra of high redshift QSOs provide important information on the early chemical evolution of galaxies, complementing that obtained from more traditional studies of metal-poor stars and H ii regions in the Milky Way and nearby galaxies (Pettini 2004; Henry & Prochaska 2007). The relatively simple physics of interstellar line formation (Strömgren 1948) makes the determination of ion column densities and corresponding element abundances straightforward, and the rich variety of resonant transitions at rest-frame ultraviolet wavelengths allows a detailed picture of the chemical composition of many DLAs to be assembled (e.g. Prochaska, Howk, & Wolfe 2003; Rix et al. 2007). The elements carbon, nitrogen and oxygen have, however, been comparatively little studied so far in DLAs, despite the key role they play in stellar nucleosynthesis. C and O are abundant elements with intrinsically strong atomic transitions; in combination, these two factors result in resonance absorption lines which are strongly saturated—and thus unusable for abundance determinations—even at the low metallicities of most DLAs. The problem is particularly acute for C. For O some weaker transitions are available at far-UV wavelengths; these, however, can only be accessed from the ground at redshifts . The absorption lines of N, on the other hand, tend to be weak and are often blended with intergalactic Ly forest lines; nevertheless, the abundance of N in DLAs has been the subject of several studies since attention was first drawn to it by Pettini, Lipman & Hunstead (1995).
| QSO | or | Telescope/ | Wavelength | Resolution | Integration Time | S/Nb | (H i) | ||
|---|---|---|---|---|---|---|---|---|---|
| (mag) | Instrument | Range (Å) | (km s-1) | (s) | (cm-2) | ||||
| Q0913072 | 17.1 | 2.785 | 2.61843 | VLT/UVES | 3310–9280c | 6.7 | 77 500 | 60 | |
| SDSS J1016+4040 | 19.5 | 2.991 | 2.81633 | Keck i/HIRESb | 3190–5970c | 7.5 | 15 000 | 12 | |
| SDSS J1558+4053 | 18.7 | 2.635 | 2.55332 | Keck i/HIRESb | 3190–5970c | 7.5 | 25 200 | 18 | |
| Q2206199 | 17.3 | 2.559 | 2.07624 | VLT/UVES & | 3100–10 000c | 6.5 | 68 500 | 100 | |
| Keck i/HIRESr |
aMagnitudes are for SDSS objects and for other QSOs.
bIndicative signal-to-noise ratio at 5000 Å.
cWith some wavelength gaps
The relative abundances of C, N, and O at low metallicities hold clues to the nature of the stars responsible for their production in the earliest stages of nucleosynthesis in galaxies, and their measurement in DLAs has the potential of clarifying some unresolved questions raised by recent stellar work, as discussed in detail later. The marked increase in the number of known DLAs afforded by the Sloan Digital Sky Survey (Prochaska, Herbert-Fort, & Wolfe 2005) makes it possible to search for damped systems with the characteristics which facilitate the measurement of the abundances of C, N, and O, primarily low metallicity and simple velocity structure. In this paper we report new high resolution spectroscopic observations of four such absorption systems,111Three DLAs and one sub-DLA, according to the conventional distinction between the two at neutral hydrogen column densities (H i) cm-2. all with metallicities [O/H] .222As usual, [O/H] O/H)O/H)⊙. When combined with published measurements in two similar systems, this data set—although modest—sheds new light on the nucleosynthesis of C, N, and O in the low metallicity regime.
2 Observations and Data Reduction
2.1 Target Selection
The four QSOs observed were selected based on the weakness of metal lines in DLAs already known to be present in their spectra, either from the trawl of the SDSS QSO sample by Prochaska et al. (2005) or from earlier published studies. It has now become apparent that metallicity and strong metal line widths are correlated in DLAs (e.g. Ledoux et al. 2006a; Murphy et al. 2007a; Prochaska et al. 2007). Thus, an efficient way to preselect for further study the most metal-poor DLAs is to focus on DLAs in which the associated strongest metal lines, which are nearly always saturated, have very low values of equivalent width—so low as to remain undetected at the moderate resolution and signal-to-noise ratio (S/N) of most SDSS spectra. In addition, the simple kinematic structure of the absorbing gas implied by the low equivalent widths simplifies the abundance analysis compared with the more usual occurrence of multiple absorption components spread over 100–200 km s-1.
Using this method, we have discovered two of the most metal-poor DLAs, with oxygen abundance [O/H] , in the spectra of the QSOs SDSS J1016+4040 and SDSS J1558+4053; high resolution observations of these systems are reported here for the first time. We have also reobserved two QSOs with known low-metallicity, narrow-line DLAs: Q0913+072 and Q2206199; the new data add significantly to those already available in the literature thanks to the very high S/N ratio achieved.
2.2 Observations
The observations were performed with the HIRES (Vogt et al. 1994) and UVES (Dekker et al. 2000) echelle spectrographs on, respectively, the Keck i and VLT2 telescopes. Relevant details are collected in Table 1. For the SDSS QSOs we used the refurbished HIRES with its UV-sensitive cross-disperser, covering the wavelength range 3190–5970 Å. The UVES observations of Q0913+072 and Q2206199 used a variety of dichroics and wavelength settings to cover essentially all of the optical wavelength range from Å to Å. The resolution is FWHM km s-1 for spectra recorded with either spectrograph. The S/N ratio varies considerably along the spectrum, particularly for the UVES data where a given portion of the spectrum may have been covered with a number of different instrument settings; in the penultimate column of Table 1 we list an indicative value of S/N at 5000 Å.
2.3 Data reduction
The reduction of the two dimensional images into co-added one-dimensional spectra followed standard procedures. The HIRES spectra were reduced with the makee pipeline software kindly maintained by T.A. Barlow, while for the UVES spectra we used the pipeline reduction provided by the European Southern Observatory but with modifications which improve the accuracy of the wavelength calibration and flux extraction (see Murphy et al. 2007b). These pipelines take care of the initial stages of bias subtraction, flat-fielding, wavelength calibration, extraction of individual echelle orders, and flux calibration. The individual spectra of each QSO were averaged and the echelle orders merged with purpose-built software333Available from http://astronomy.swin.edu.au/mmurphy/UVES_popler designed to maximise the signal-to-noise ratio of the final spectrum which was binned onto a linear, vacuum heliocentric wavelength scale with approximately three bins per resolution element.
2.4 Abundance Measurements
Absorption lines from each DLA were identified and their profiles fitted with Voigt profiles generated by the VPFIT (version 8.02) software package, as described by Pettini et al. (2002a) and Rix et al. (2007). Briefly, VPFIT uses minimisation to deduce the values of redshift , column density (cm-2), and Doppler parameter (km s-1) that best reproduce the observed absorption line profiles. VPFIT takes into account the instrumental broadening function in its minimisation and error evaluation.444VPFIT is available from http://www.ast.cam.ac.uk/~rfc/vpfit.html We used the compilation of laboratory wavelengths and -values by Morton (2003) with recent updates by Jenkins & Tripp (2006).
The DLAs observed are among those with the simplest kinematic structure, generally consisting of only two or three absorption components separated by km s-1; this fact, coupled with the high resolution and generally high S/N of the spectra, made the profile fitting procedure straightforward and its results unambiguous. Another consequence of the unusually simple line profiles is that the same set of ‘cloud’ parameters, and , was found to reproduce well all the absorption lines considered in each DLA; naturally, lines arising from the same ground state of a given ion were fitted together to give the best-fitting value of the column density (Xi), where (Xi) is the ith ion stage of element X. In each DLA, the column density of neutral hydrogen was determined by fitting the damping wings of the Ly line which are its most sensitive measure; we also checked that the resulting value of (H i) provides a good fit to the higher order Lyman lines covered by our spectra.
Element abundances were deduced from the observed ratios (X n)/(H i), where (X n) denotes the column density of the ion stage which contains the dominant fraction of element X in H i regions of the Milky Way interstellar medium (e.g. Morton et al. 1973). For the elements considered here, these are either the neutrals (O i, N i) or the first ions (C ii, Al ii, Si ii and Fe ii). However, we have also measured the column densities of higher ions stages, when their absorption lines are present in our spectra, in order to assess the corrections, if any, that need to be applied to our abundance determinations to account for the possible contributions by ionised gas to the absorption lines observed. When element abundances are referred to the solar scale, we have used the compilation by Asplund, Grevesse, & Sauval (2005).
3 Individual Absorption Systems
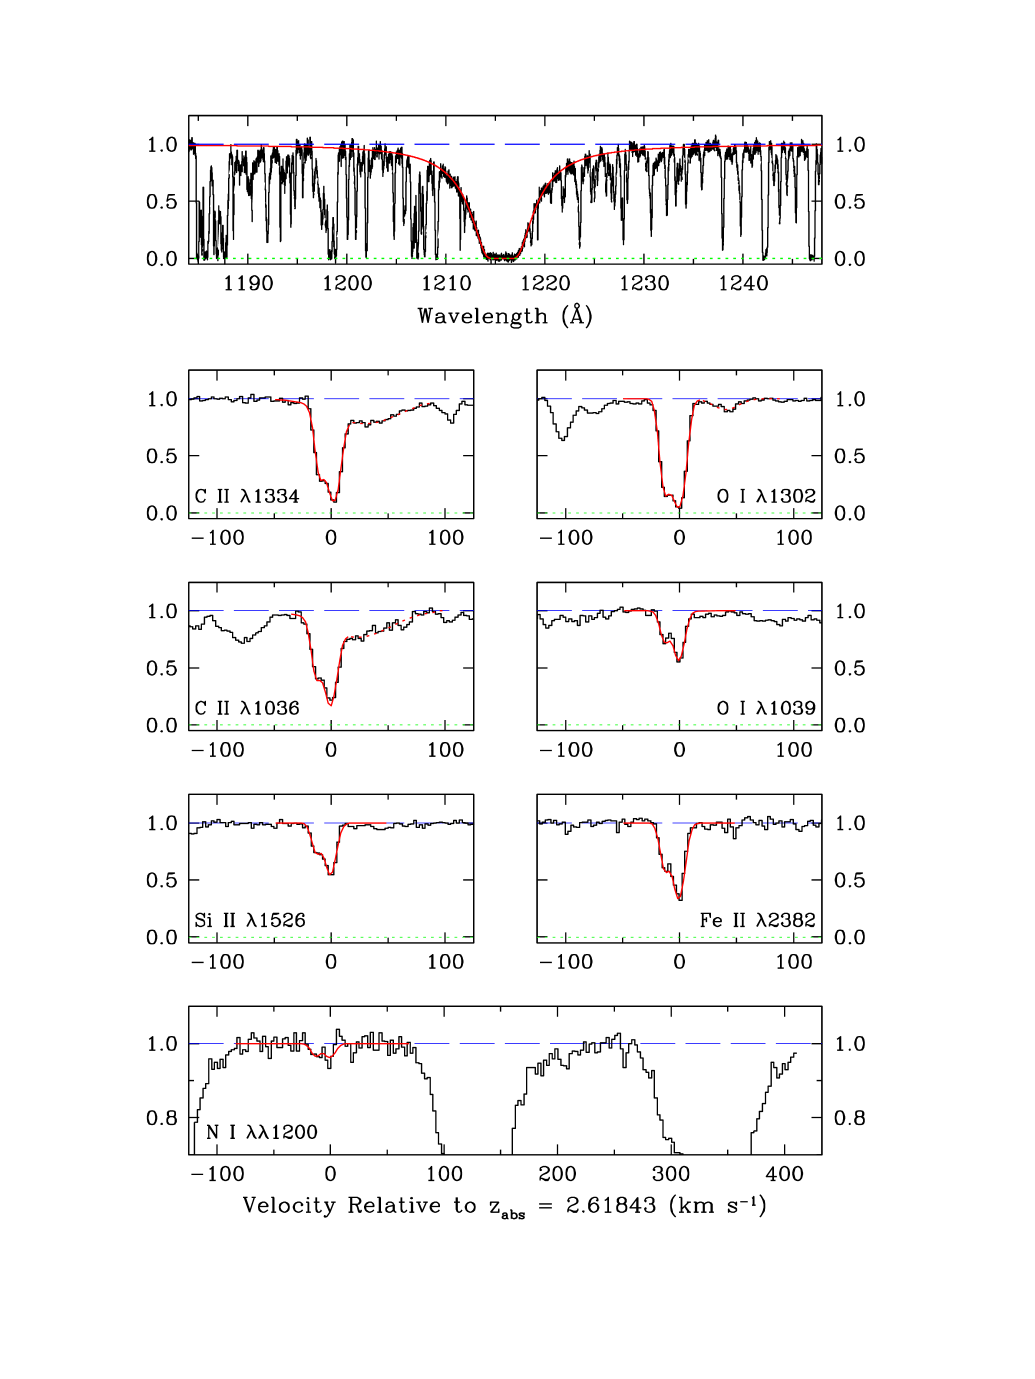
3.1 Q0913+072; DLA at
The metal-poor DLA in front of this bright QSO has been known since the survey by Pettini et al. (1997). It was subsequently studied at higher spectral resolution by Ledoux et al. (1998) and Erni et al. (2006) who considered it to be ‘the most metal-deficient DLA known’ and drew attention to its role as a probe of early nucleosynthesis. As part of a programme to measure the primordial abundance of deuterium, we re-observed this QSO with UVES in 2007. Including a few spectra downloaded from the UVES data archive, the total exposure time devoted to Q0913+072 is 77 500 s; the corresponding signal-to-noise ratio near 5000 Å is S/N (see Table 1).
| Component | Fractiona | ||
|---|---|---|---|
| Number | (km s-1) | ||
| 1 | 2.61828 | 3.7 | 0.28 |
| 2 | 2.61843 | 5.4 | 0.72 |
aFraction of the total column density of Si ii.
| Ion | Transitions used | (X) |
|---|---|---|
| H i | 1215 | |
| C ii | 1036, 1334 | |
| N i | 1199 | |
| O i | 1039, 1302 | |
| Al ii | 1670 | |
| Al iii | 1854 | |
| Si ii | 1190, 1193, 1260, 1304, 1526 | |
| Fe ii | 1608, 2344, 2374, 2382 |
A selection of the absorption lines in this DLA is shown in Figure 1. The metal lines consist of two closely spaced components; profile decomposition with VPFIT returns -values of 3.7 and 5.4 km s-1 and a velocity separation of 12.4 km s-1 (see Table 2). Table 3 lists the absorption lines analysed and the corresponding values of column density; the errors on (X) are the formal values returned by VPFIT. Most of the metal lines in this DLA are weak; in particular, from Figure 1 it can be seen that both C ii and C ii are unsaturated (these lines are nearly always saturated in DLAs), as is O i . Although both C ii lines are partially blended with broad absorption at longer wavelength (modelled by VPFIT with two components), the impact of these contaminating features on the determination of (C ii) is relatively minor: a conservative estimate of the error on (C ii) deduced from several VPFIT trials is .
We have a definite () detection of N i in both velocity components; the two other, weaker, members of the N i triplet are blended with Ly forest lines.
Turning to absorption lines from ionised gas, C iii , Si iii , and Fe iii are blended with Ly forest lines, while N ii is undetected (which is unsurprising given the weakness of the N i lines). We do, however, have a tentative detection of Al iii ; given the weakness of this feature, we consider the column density of Al iii to be an upper limit.
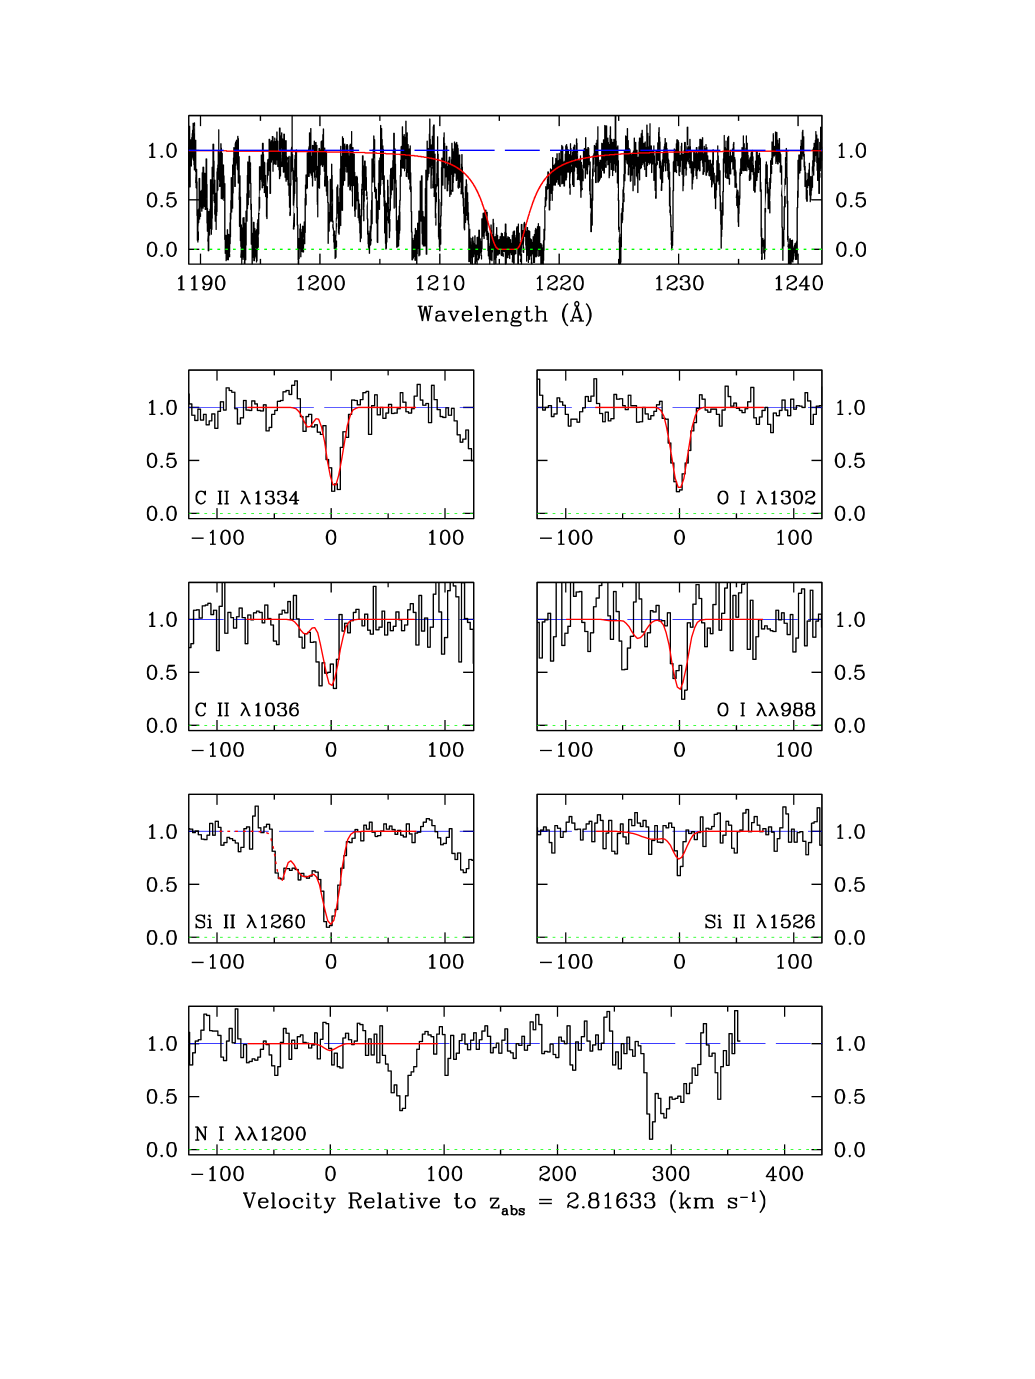
3.2 SDSS J1016+4040; DLA at
This QSO is one order of magnitude fainter than Q0913+072. We recorded its spectrum from 3190 Å to 5970 Å on the night of 2007 May 6 with the refurbished HIRES spectrograph on the Keck i telescope, using the UV cross-disperser and UV sensitive CCD array. With a total exposure time of 15 000 s we achieved a modest S/N near 5000 Å. As can be seen from Figure 2, what appears as a likely damped Ly line in the low resolution SDSS spectrum breaks up into three distinct components at the higher resolution of the HIRES data. However, the central one of these three absorption lines does exhibit damping wings; we deduce (H i) cm-2. Such systems are sometimes referred to as sub-DLAs since their column densities are lower than the historical definition of a DLA as a system with (H i) cm-2 (Wolfe et al. 1986).
All the metal lines in this DLA are weak (see Figure 2). The first ions exhibit two narrow velocity components with and 6.9 km s-1 separated by 23 km s-1, with the latter accounting for % of the total column density (see Table 4). The former, at , probably arises in ionised gas since it is not detected in the O i and lines (the latter being the strongest member of the O i triplet shown in Figure 2). Therefore, we have not included this component in the values of (C ii) and (Si ii) attributed to the DLA in Table 5. N i is below our detection limit; similarly, absorption lines from higher ion stages than those dominant in H i regions are either blended (e.g. Si iii ), or undetected.
| Component | Fractiona | ||
|---|---|---|---|
| Number | (km s-1) | ||
| 1 | 2.81604 | 5.0 | 0.11 |
| 2 | 2.81633 | 6.9 | 0.89 |
aFraction of the total column density of C ii.
| Ion | Transitions used | (X) |
|---|---|---|
| H i | 1215 | |
| C ii | 1334, 1036 | |
| N i | 1199.5 | |
| O i | 1302, 988.77 | |
| Si ii | 1260, 1526 |
3.3 SDSS J1558+4053; DLA at
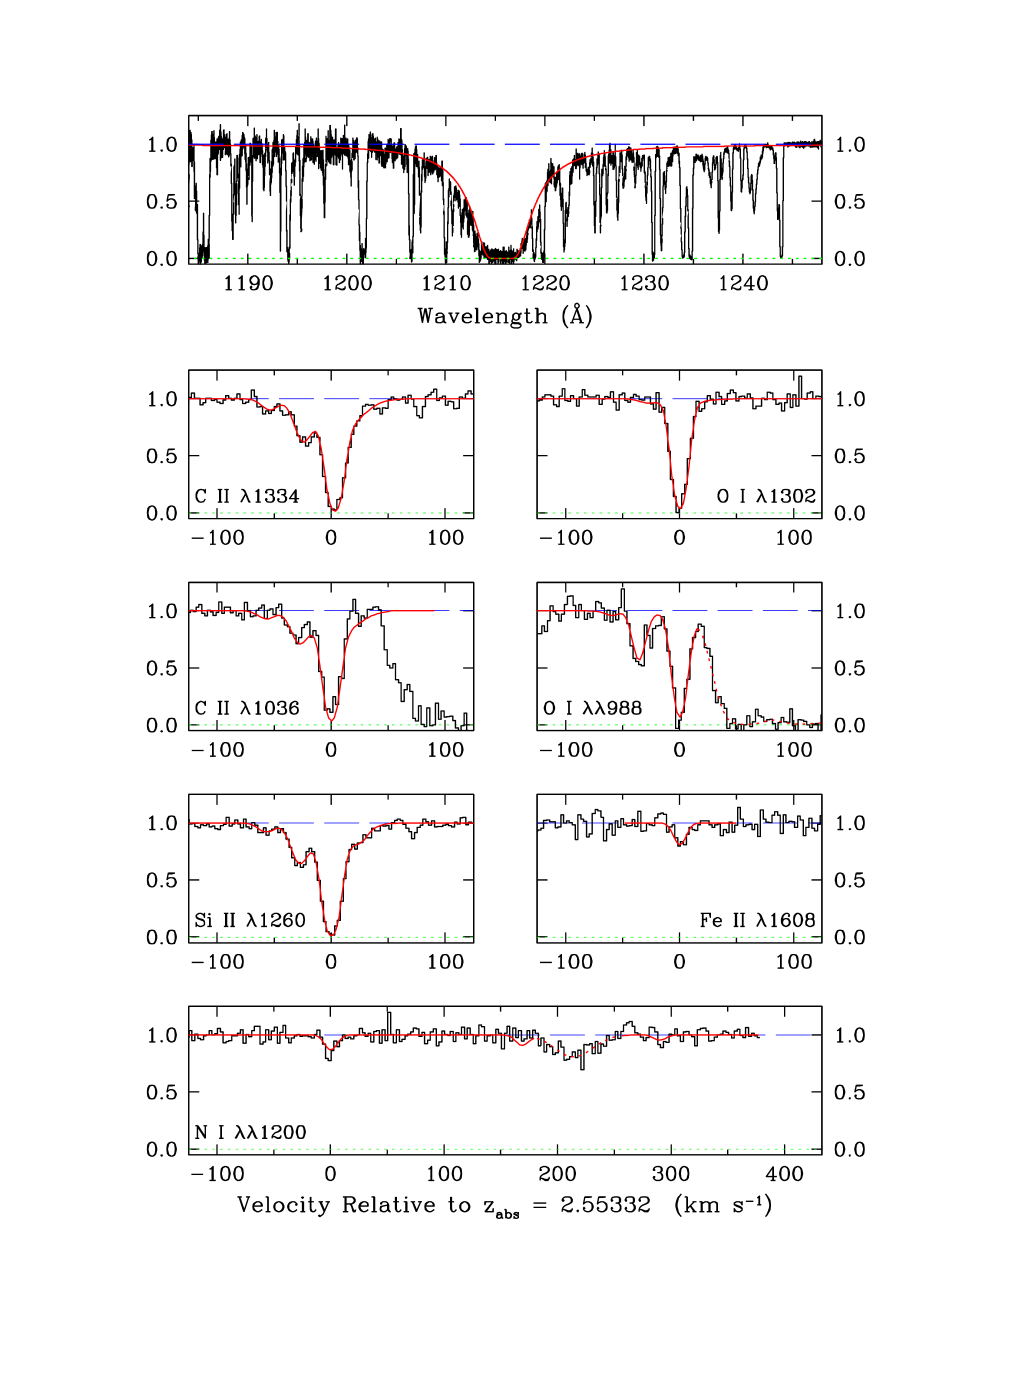
We observed this QSO with HIRES on the night of 2006 June 17, achieving S/N near 5000 Å with a 25 200 s exposure. The echelle data confirm that the strong absorption feature near 4320 Å in the discovery SDSS spectrum is indeed a damped Ly line with (H i) cm-2 (see Figure 3).
The neutral gas is concentrated in a single, narrow ( km s-1) component at ; other, weaker, components are seen at positive and negative velocities in C ii and Si ii and probably originate in ionised gas (Figure 3 and Table 6). The entries in Table 7 are for the neutral component only. The absorption lines in this DLA are stronger than in the previous two cases. Nevertheless, we cover at least one unsaturated transition for every species considered except possibly for C ii: both and are just saturated. Even for C ii, however, we can determine the column density with confidence because: (i) the absorption profile (of the central, dominant component) is well fitted by the same -value which fits best all the other lines; (ii) larger values of are incompatible with the observed width of the line which is resolved in our data. Note that while we cannot exclude, in principle, that narrower components may be present within the marginally saturated C ii line profiles, their unrecognised presence would lead to an underestimate of [C/H] and C/O, further strengthening the main conclusion of our analysis of the behaviour of the C/O ratio at low metallicities, as discussed in Section 5.
As for the case of the DLA in SDSS J1016+4040, we are unable to deduce reliable column densities of higher ionisation stages than those listed in Table 7 because the relevant absorption lines are either blended, undetected, or outside the wavelength range of our HIRES spectrum.
| Component | Fractiona | ||
|---|---|---|---|
| Number | (km s-1) | ||
| 1 | 2.55264 | 9.1 | 0.01 |
| 2 | 2.55298 | 8.8 | 0.06 |
| 3 | 2.55332 | 6.1 | 0.80 |
| 4 | 2.55334 | 25.1 | 0.13 |
aFraction of the total column density of Si ii.
| Ion | Transitions used | (X) |
|---|---|---|
| H i | 1215 | |
| C ii | 1334, 1036 | |
| N i | 1199.5, 1200.2, 1200.7 | |
| O i | 1302, 988.77, 988.65 | |
| Al ii | 1670 | |
| Si ii | 1190, 1193, 1260, 1304, 1526 | |
| Fe ii | 1096, 1144, 1260, 1608, |
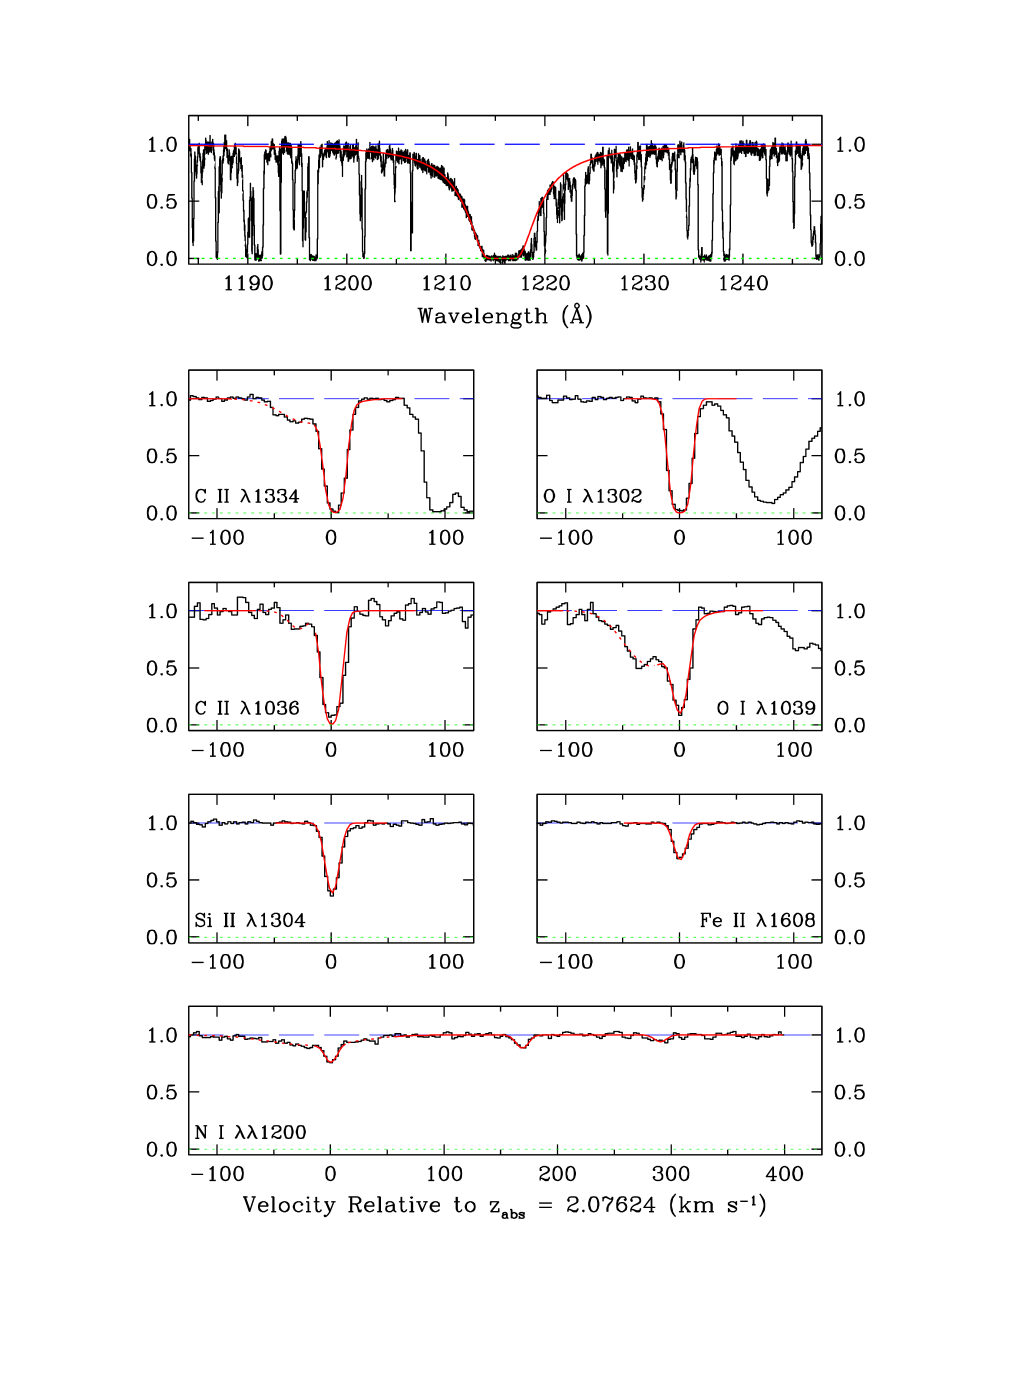
3.4 Q2206199; DLA at
The metal-poor DLA in this QSO has been known since the early echelle observations by Pettini et al. (1990) and by Prochaska & Wolfe (1997). Here we combine spectra from the UVES and HIRES data archives to achieve S/N at 5000 Å and extensive spectral coverage from Å to m.
Even at this high resolution and signal-to-noise ratio this DLA appears to consist of a single, narrow component: the profiles of all the absorption lines from species which are dominant in H i regions are well reproduced by a model ‘cloud’ with km s-1 (Figure 4 and Tables 8 and 9). The availability of a number of transitions with differing -values for most ions ensures that the column densities are well determined. The C ii lines are just saturated but, for the reasons outlined above, this is unlikely to affect our conclusions concerning the relative abundances of C and O. Thanks to its high S/N ratio and wide wavelength coverage, our combined UVES+HIRES spectrum does cover a number of transitions from ions that only occur in H ii regions (N ii, Al iii, and Si iii; see Table 9); their column densities are lower than those of the corresponding H i region species. Finally, it can be seen from Figure 4 that we have a clear detection of all three lines of the N i triplet.
| Component | Fractiona | ||
|---|---|---|---|
| Number | (km s-1) | ||
| 1 | 2.07624 | 6.5 | 1.00 |
aFraction of the total column density of Si ii.
| Ion | Transitions used | (X) |
|---|---|---|
| H i | 1215 | |
| C ii | 1334, 1036 | |
| N i | 1199.5, 1200.2, 1200.7 | |
| N ii | 1083 | |
| O i | 1302, 1039 | |
| Al ii | 1670 | |
| Al iii | 1854, 1862 | |
| Si ii | 1193, 1260, 1304, 1808 | |
| Si iii | 1206 | |
| Fe ii | 1121, 1260, 1608, 2344, 2374, 2382, 2600 |
4 Element Abundances
Our abundance measurements in the four DLAs are collected in Table 10. We have searched the literature for other examples of DLAs (or sub-DLAs) where the C ii and O i absorption lines are unsaturated, so that the corresponding column densities can be determined, and found only two other cases, also included in Table 10, from the work by Dessauges-Zavadsky et al. (2003) and Péroux et al. (2007). Both of these cases are of somewhat lower hydrogen column density and at higher redshifts than the four reported here but, given the paucity of C/O measurements up to now, we shall consider them in the present analysis.
As can be seen from Table 10, all four DLAs in the present work have metallicities of less than 1/100 of solar. The DLA in front of Q0913+072 remains the most metal-poor in [Fe/H], but its oxygen abundance of solar is similar to those of the two newly discovered DLAs from the SDSS. With [O/H] and [C/H] to , these DLAs have attained a level of metal enrichment comparable to that typical of intergalactic Ly forest clouds at the same redshifts (e.g. Simcoe et al. 2004). Although the source of these intergalactic metals is still somewhat controversial (see Ryan-Weber et al. 2006 and references therein), it seems likely that such metal-poor DLAs have experienced very little, if any, star formation in situ.
It is also interesting to note that no DLA has yet been found with metallicity less than 1/1000 solar, despite the fact that such metal-poor stars do exist in the halo of our Galaxy. In drawing such comparisons, however, it must be borne in mind that such extremely metal-poor stars constitute a tiny fraction of the stellar populations of the Milky Way. It may simply be the case that with only a few hundred metallicity measurements in DLAs so far, we simply do not have the statistics necessary to pick out such outliers in the metallicity distribution.
Finally, we draw attention to the fact that in the four systems in which this ratio could be measured, [O/Fe] to (see Table 10) consistent with the enhancement of the alpha-capture elements relative to iron seen in halo stars of similar metallicity. At these low DLA metallicities, the depletion of Fe onto dust grains is expected to be minimal (Vladilo 2004; Akerman et al. 2005) so that the observed (O i)/(Fe ii) ratio gives a good indication of inherent departures from the solar relative abundances of these two elements. As we show in section 4.1, differential ionisation corrections between O i and Fe ii are also unlikely to account for this effect.
| QSO | (H i) | [O/H]a | (C/O)b | (N/O)c | [Al/H]a | [Si/H]a | [Fe/H]a | |
|---|---|---|---|---|---|---|---|---|
| Q0913072 | 2.61843 | 20.34 | ||||||
| SDSS J1016+4040 | 2.81633 | 19.90 | … | … | ||||
| SDSS J1558+4053 | 2.55332 | 20.30 | ||||||
| Q2206199 | 2.07624 | 20.43 | ||||||
| Other Objects: | ||||||||
| J01374224d | 3.665 | 19.11 | … | … | … | |||
| J21551358e | 4.21244 | 19.61 | … |
a[X/H] . Solar abundances from Asplund et al. (2005).
bThese values are not referred to the solar abundance. For reference, (Asplund et al. 2005).
cThese values are not referred to the solar abundance. For reference, (Asplund et al. 2005).
dPéroux et al. (2007).
eDessauges-Zavadsky et al. (2003).
4.1 Ionisation Corrections
As explained in section 2.4, the relative element abundances listed in Table 10 were derived by dividing the column densities (X n) by (H i), where (X n) is the dominant ionisation stage of element X in H i regions. Strictly speaking, this commonly adopted assumption only holds true for O out of the elements considered here. It has been known for a long time that charge-exchange reactions keep (O i)/(H i) very close to O/H for a wide range of physical conditions (e.g. Field & Steigman 1971). For elements which in H i regions are mostly singly ionised—that is, C, Al, Si and Fe in our case—the possibility exists that some H ii gas—at the same velocity as the H i and thus indistinguishable kinematically—may contribute to column densities of their first ions; if true, this would lead to an overestimate of the corresponding element abundances.555It is worthwhile pointing out here that the neutral atoms of these species, which we have neglected, make negligible contributions to the abundance measurements, because even in H i regions (C i) (C ii), and similar inequalities apply to Al, Si and Fe. Conversely, N may be overionised relative to H, so that even in H i regions (N i)/(H i) (N/O) leading to an underestimate of the N abundance.
Of course, one of the major motivations for using DLAs in abundance studies, is the fact that when the column density of neutral gas exceeds (H i) cm-2 such ionisation corrections are expected to be small and comparable to other sources of error, as concluded by a number of detailed analyses (e.g. Viegas 1995; Vladilo et al. 2001). Given the importance of this point for the measurement of the C/O ratio, however, we verified that this is indeed the case for the two DLAs in our small sample where column densities of ions from H ii regions could be measured in our spectra.
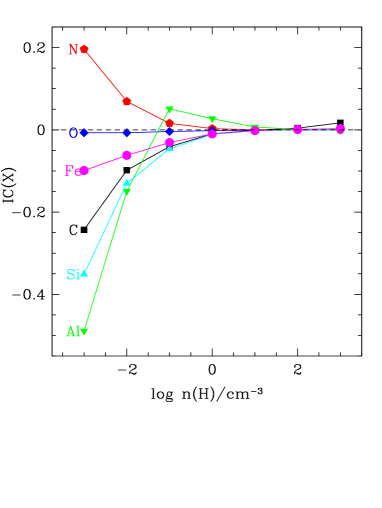
Specifically, we run a series of photoionization models with the software package cloudy (Ferland et al. 1998; Ferland 2000)666http://www.nublado.org/, approximating the DLAs as slabs of constant density gas irradiated by the metagalactic ionising background (Haardt & Madau 2001) and the cosmic microwave background. We assumed a metallicity of 1/100 solar and no differential depletions due to dust grains (Akerman et al. 2005), but the results of the computations are not sensitive to these assumptions. We varied the gas volume density from to and stopped the calculation when the measured column density of neutral gas in each DLA was reached. From the cloudy output we then calculated for each element observed the ionization correction
| (1) |
which is negative when the abundance of an element has been overestimated by neglecting the ionized gas.
Figure 5 illustrates the results of this exercise for the DLA in Q2206199 (the conclusions are similar for the other DLAs considered here). As expected, O i tracks H i very closely at all densities. At very low densities N is overionised relative to H (that is some N is present as N ii even in H i regions), while the column densities of the other elements considered have some contribution from ionised gas so that, for example, (C ii)/(H i) C/H. However, for the elements which are the focus of the present work, C, N (and O), the ionisation corrections amount to less than dex provided the gas density is greater than (H) cm-3. When (H) cm-3, the ionisation corrections for all the elements in Table 10 are dex.
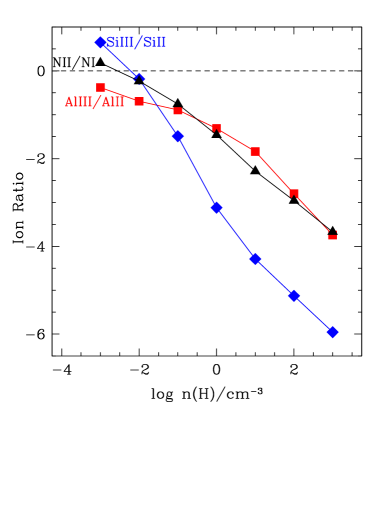
We can obtain an indication of the density which applies to the gas in the DLAs from consideration of the ratios of different ions stages, since they also depend on the density, once the radiation field has been fixed (see Figure 6). The DLA which provides the most extensive information in this respect is the one in line to Q2206199. Comparing the measured (N ii)/(N i), (Al iii)/(Al ii), and (Si iii)/(Si ii) ratios in Table 9 (all these ratios are ) with the values computed by cloudy for different densities, we find that in this DLA (H)/cm so that the ionisation corrections for carbon and nitrogen are . This is also the case for the DLA in Q0913+072, although in this case we rely solely on the (Al iii)/(Al ii) ratio. Péroux et al. (2007) and Dessauges-Zavadsky et al. (2003) reached similar conclusions for the two sub-DLAs included in Table 10, based on similar photoionisation analyses. For the two DLAs in the SDSS QSOs we have no comparable information and therefore cannot come to definite conclusions concerning ionisation corrections. However, even in these two cases, it is unlikely that to . Larger ionisation corrections would imply volume densities (H) cm-3 and therefore linear sizes for the absorbing structures in excess of kpc (for (H i) cm-2); it seems unlikely that gas in such large volumes would maintain internal velocity dispersions of only a few km s-1 as required by the narrow line widths.
In summary, our best estimates of the ionisation structure of the sample of six DLAs and sub-DLAs considered here leads us to conclude that the measured ratios (C ii)/(O i) and (N i)/(O i) reflect the true values of C/O and N/O in the DLAs to within 0.2 dex and probably to within 0.1 dex in most cases.
5 The C/O ratio at low metallicities
One of the aims of the present work is to investigate the behaviour of the C/O ratio at low metallicities, motivated by the results of Akerman et al. (2004) and Spite et al. (2005) which we now summarise. Akerman et al. (2004) measured the abundances of C and O in 34 halo stars of metallicities from [Fe/H] to and combined such data with analogous measurements in disk stars from the literature. The pattern that emerged from their study is illustrated in Figure 7. Briefly, in halo stars [C/O] (corresponding to an observed since in the Sun ; Asplund et al. 2005).777Note that in the earlier compilation by Grevesse & Sauval (1998) the solar ratio of C and O had a similar value ; thus the C/O ratio appears to be robust the 3D and non-LTE effects which have introduced significant changes to the individual abundances of C and O. At the higher metallicities of most disk stars, C/O rises to solar proportions; in the Galactic chemical evolution models considered by Akerman et al. (2004) this rise is interpreted as the additional contribution to carbon enrichment of the interstellar medium from the winds of Wolf-Rayet stars —whose mass loss rates are known to increase with metallicity—and, to a lesser extent, from the delayed evolution of low and intermediate mass stars.
More puzzling is the apparent upturn in [C/O] with decreasing metallicity when [O/H] , since conventional stellar yields would predict the opposite behaviour: the expected time lag in the production of C relative to O in the first episodes of star formation should cause the [C/O] ratio to decrease dramatically as we move to the lowest metallicities in Figure 7 (interested readers are referred to the extensive discussion of the relevant chemical evolution models by Akerman et al. 2004). Akerman et al. speculated that the trend towards higher, rather than lower, values of [C/O] when [O/H] may be due to remaining traces of high carbon production by the first stars to form in the halo of the Milky Way proto-galaxy. Indeed, some calculations of nucleosynthesis by Population III stars (e.g. Chieffi & Limongi 2002) do entertain high carbon yields (relative to oxygen) that can reproduce the observations in Figure 7. More recently, Chiappini et al. (2006) have proposed that the observed behaviour can also be explained if stars of lower metallicity rotate faster: the higher rotation speeds greatly increase the yields of C (and N) by the massive stars which are the main source of O.
Some uncertainty in the interpretation of the results in Figure 7 is introduced by the fact that Akerman et al. (2004) based their abundance measurements on one-dimensional, local thermodynamical equilibrium (LTE), stellar atmosphere models. The authors pointed out themselves the possibility that the neglect of non-LTE corrections to the high excitation C i and O i lines used for abundance determinations may mimic (or at least enhance) the rise in [C/O] with decreasing [O/H]. An initial investigation of such effects by Fabbian et al. (2006) seemed to dilute the significance of the results by Akerman et al. (2004) by showing that non-LTE corrections to the C i lines can be as high as dex in stars of [Fe/H] . A more recent study by the same group, however, has uncovered even larger corrections to the abundance of O at very low metallicities (Fabbian et al. 2008a), so that the case for a rise in [C/O] when [O/H] is actually reinforced when non-LTE effects on the formation of the stellar C i and O i lines are taken into account (Fabbian et al. 2008b).
This discussion highlights the important role that low metallicity DLAs can play in clarifying the early nucleosynthetic sources of carbon. The physics of absorption line formation in diffuse interstellar clouds is considerably simpler than that pertaining to stellar atmospheres; we do not have to take into account the geometry of the absorbers nor their exact thermodynamical conditions. The only two limiting factors to the accuracy with which we can measure the C/O ratio are: (i) line saturation and (ii) ionisation corrections. In the preceding sections we have shown that the former, if present at all in the data considered here, would lead us to underestimate the value of C/O, while the latter would work in the opposite direction but the effect is unlikely to be greater than 0.1 dex for the DLAs in the present study.
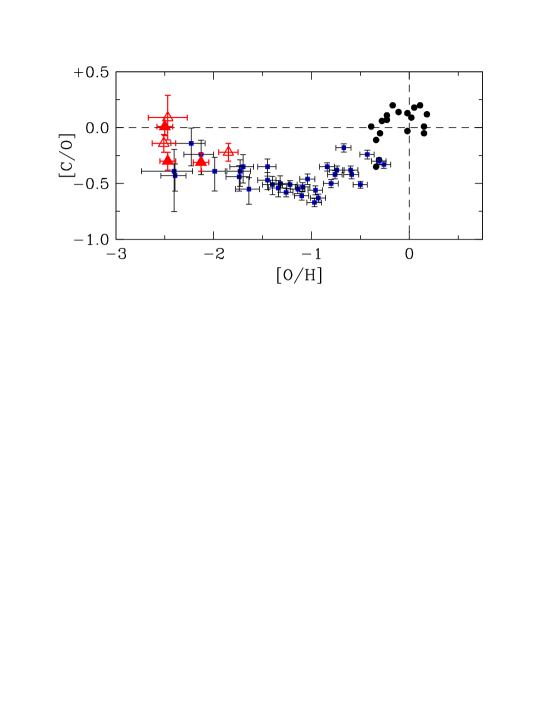
When the values of [C/O] measured in the six DLAs/sub-DLAs in the present sample are compared with those of Galactic stars as in Figure 8, it appears that both sets of data paint a consistent picture.888The values of [C/O] plotted in Figure 8 were deduced from the values of listed in Table 10 after subtracting the solar value from the compilation by Asplund et al. (2005). The errors shown were obtained by combining in quadrature the errors in the column densities (C ii) and (O i) returned by VPFIT and listed in Tables 3, 5, 7 and 9, or given by the original authors for the two DLAs from the literature. In all cases, a minimum column density uncertainty of 0.05 dex was assumed. The DLA measurements corroborate the conclusion by Akerman et al. (2004) in showing relatively high values of C/O in the low metallicity regime and complement the still very limited statistics of this ratio in stars of metallicity [O/H] .
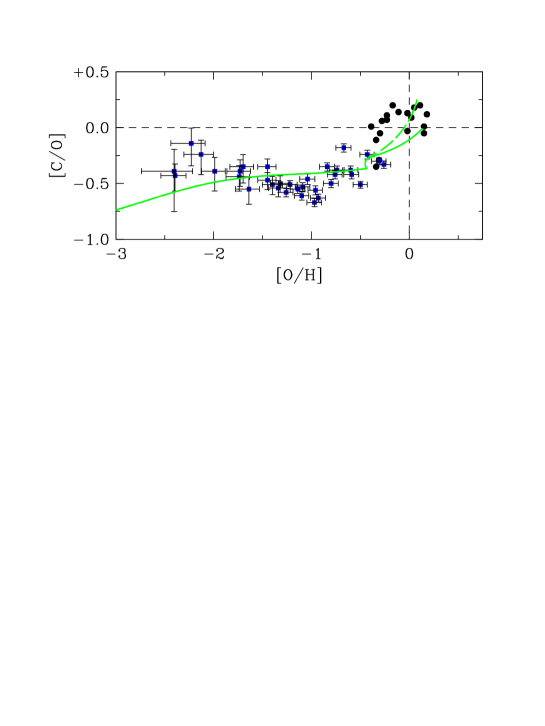
Although the high redshift DLAs and the halo stars appear to constitute a continuous sequence in Figure 8, we warn against such a simplistic interpretation. The chemical enrichment histories of the Milky Way halo and of the galaxies giving rise to DLAs need not be the same. Therefore it may well be that, as chemical evolution progresses, different DLAs follow different paths in the [C/O] vs. [O/H] plane, some similar to that of the Milky Way stellar populations while others may be different. Such a variety of behaviours has already been seen (in other elements) in Local Group galaxies (e.g. Pritzl et al. 2005). What our data show is that at metallicities below 1/100 of solar DLAs and Galactic stars concur in showing elevated ratios of C/O. Akerman et al. (2004) speculated that an approximately solar value of C/O might be recovered when [O/H] ; the new data presented here are certainly consistent with this extrapolation of the Galactic measurements.
6 The N/O ratio at low metallicities
In contrast with the paucity of carbon measurements, several studies have targeted the abundance of N in DLAs since the first determination of the N/O ratio in a metal-poor DLA by Pettini, Lipman, & Hunstead (1995). These authors pointed out the potential of such data for clarifying the nucleosynthetic origin of N and unravelling the chemical enrichment history of the galaxies giving rise to damped systems. Henry & Prochaska (2007) and Petitjean, Ledoux, & Srianand (2008) provide recent discussions of these issues and comprehensive reviews of earlier literature.
At present, there are 35 DLAs with reliable measurements (or useful upper limits) of N/O, collected in Table 11.999In most of these cases S is used as a proxy for O because, unless far-UV O i lines are accessible (and these are often blended in the Ly forest), the strong O i line is saturated in most DLAs. The use of S as a proxy for O is justified by the fact that S behaves like a typical alpha-capture element in Galactic stars (e.g. Nissen et al. 2007). Despite this body of data, it is still instructive to consider the three measurements of N/O reported here, as they refer to some of the most metal-poor DLAs known. In order to understand their importance, it is necessary to summarise current ideas on the production of N in stars of different masses—we refer the interested reader to Henry & Prochaska (2007), Pettini et al. (2002a), and references therein for more detailed treatments.
| QSO | (H i) | (N i) | (O i) | (S ii) | Ref.b | ||||
|---|---|---|---|---|---|---|---|---|---|
| (cm-2) | (cm-2) | (cm-2) | (cm-2) | ||||||
| Q00002620 | 3.3901 | 21.41 | 14.73 | 16.45 | … | 7.04 | 1 | ||
| Q0100+1300 | 2.30903 | 21.37 | 15.03 | … | 15.09 | 7.22 | 2 | ||
| Q0112306 | 2.41844 | 20.50 | 13.16 | 14.95 | … | 6.45 | 3 | ||
| Q0201+1120 | 3.38639 | 21.26 | 15.33 | … | 15.21 | 7.45 | 4 | ||
| J03074945 | 4.46658 | 20.67 | 13.57 | 15.91 | … | 7.24 | 5 | ||
| Q03473819 | 3.02485 | 20.73 | 14.64 | 16.45 | 14.74 | 7.72 | 3 | ||
| Q04074410 | 2.5505 | 21.13 | 14.55 | … | 14.82 | 7.19 | 6 | ||
| Q04074410 | 2.5950 | 21.09 | 15.07 | … | 15.19 | 7.60 | 6 | ||
| Q05282505 | 2.1410 | 20.95 | 14.58 | … | 14.83 | 7.38 | 7 | ||
| HS0741+4741 | 3.01740 | 20.48 | 13.98 | … | 14.01 | 7.03 | 8 | ||
| 0841+1256 | 2.37452 | 20.99 | 14.60 | … | 14.69 | 7.20 | 9 | ||
| 0841+1256 | 2.47621 | 20.78 | 13.94 | 16.15 | 14.48 | 7.37 | 9 | ||
| J0900+4215 | 3.2458 | 20.30 | 14.15 | … | 14.65 | 7.85 | 8 | ||
| Q0913+072 | 2.61843 | 20.34 | 12.29 | 14.63 | … | 6.29 | 10 | ||
| Q0930+2858 | 3.2353 | 20.18 | 13.82 | … | 13.67 | 6.99 | … | 11 | |
| Q1108077 | 3.60767 | 20.37 | 15.37 | … | 7.00 | 3 | |||
| Q1210+17 | 1.89177 | 20.63 | 14.71 | … | 14.96 | 7.83 | 9 | ||
| Q1232+0815 | 2.33772 | 20.80 | 14.63 | … | 14.83 | 7.53 | 7 | ||
| Q1331+170 | 1.77637 | 21.14 | … | 15.08 | 7.44 | 2 | |||
| Q1337+113 | 2.79581 | 21.00 | 13.99 | 15.74 | … | 6.74 | 3 | ||
| Q1409+095 | 2.45620 | 20.54 | 15.15 | … | 6.61 | 12 | |||
| J1435+5359 | 2.3427 | 21.05 | 14.67 | … | 14.78 | 7.23 | … | 8 | |
| J1443+2724 | 4.224 | 20.95 | 15.52 | … | 15.52 | 8.07 | 13 | ||
| SDSS J15580031 | 2.70262 | 20.67 | 14.46 | 15.87 | 14.07 | 7.20 | 14 | ||
| SDSS J1558+4053 | 2.55332 | 20.30 | 12.66 | 14.54 | … | 6.24 | 10 | ||
| GB1759+7539 | 2.62530 | 20.76 | 15.11 | … | 15.24 | 7.98 | 8 | ||
| Q2059360 | 3.08293 | 20.98 | 13.95 | 16.09 | 14.41 | 7.11 | 3 | ||
| Q2206199 | 2.07624 | 20.43 | 12.79 | 15.05 | … | 6.62 | 10 | ||
| Q2230+02 | 1.8644 | 20.85 | 15.02 | … | 15.29 | 7.94 | 9, 8 | ||
| Q2231002 | 2.06616 | 20.53 | … | 15.10 | 8.07 | 2 | |||
| HE22436031 | 2.33000 | 20.67 | 14.88 | … | 15.02 | 7.85 | 15 | ||
| Q2332094 | 3.05723 | 20.50 | 13.73 | 15.95 | 14.37 | 7.45 | 3 | ||
| Q2342+342 | 2.9082 | 21.10 | 14.92 | … | 15.19 | 7.59 | 8 | ||
| Q2343+1232 | 2.43125 | 20.35 | 15.22 | … | 14.86 | 8.01 | 16 | ||
| Q23481444 | 2.27939 | 20.59 | 13.35 | … | 13.75 | 6.66 | 9 |
aWhen the oxygen abundance is not available, S has been used as a proxy for O by assuming the solar ratio (Asplund et al. 2005).
bReferences—1: Molaro et al. (2000); 2: Dessauges-Zavadsky et al. (2004); 3: Petitjean, Ledoux, & Srianand (2008); 4: Ellison et al. (2001); 5: Dessauges-Zavadsky et al. (2001); 6: Lopez & Ellison (2003); 7. Centúrion et al. (2003); 8. Henry & Prochaska (2007). 9. Dessauges-Zavadsky et al. (2006); 10: This work; 11. Lu, Sargent, & Barlow (1998); 12. Pettini et al. (2002a). 13. Ledoux et al. (2006b). 14. O’Meara et al. (2006). 15: Lopez et al. (2002); 16: D’Odorico, Petitjean, & Cristiani (2002).
c(N/O) ratio only for components in common between N i and O i.
The key points are as follows. There is general agreement that the main pathway for the production of N in stellar interiors is a six step process in the CN branch of the CNO cycle which takes place in the stellar H burning layer, with the net result that 14N is synthesised from 12C and 16O. Less well established, however, are the N yields of stars of different masses and metallicities. The issue is complicated by the fact that N can be of either ‘primary’ or ‘secondary’ origin, depending on whether the seed carbon and oxygen are those manufactured by the star during helium burning, or were already present when the star first condensed out of the interstellar medium (ISM).
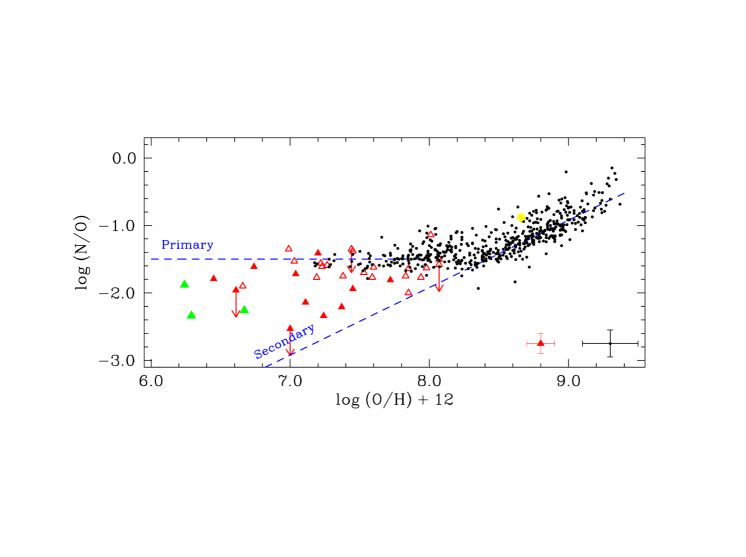
This dual nature is revealed when the abundances of N and O in extragalactic H ii regions (these are the main source of measurements of these two elements in the nearby universe) are compared as in Figure 9.101010See Pettini et al. (2002a) for the sources of the H ii region measurements reproduced in Figure 9. Although much more extensive data sets have become available recently through large scale surveys such as the Sloan Digital Sky Survey (e.g. Mallery et al. 2007; Liang et al. 2007—see also Nava et al. 2006), the locus occupied by H ii regions in the log (N/O) vs. log (O/H) plane has not changed significantly. When the oxygen abundance is greater than about half solar, that is when adopting from Asplund et al. (2005), N/O rises steeply with increasing O/H; this is the regime where N is predominantly secondary.111111Henry, Edmunds, & Köppen (2000) pointed out that the rise in N/O with O/H is steeper than would be normally expected for a purely secondary element and proposed that it is augmented by a decreasing O yield with increasing metallicity. At lower metallicities on the other hand (), N is mostly primary and its abundance tracks that of O; this results in the flat plateau at evident in Figure 9.
Primary N is thought to be synthesised most effectively by intermediate mass stars on the asymptotic giant branch; consequently, its release into the interstellar medium presumably takes place some time after the massive stars which are the main source of oxygen have exploded as Type II supernovae. Henry et al. (2000) calculated the delay to be Myr for a ‘standard’ stellar initial mass function (IMF) and published stellar yields.
Damped Ly systems add information that can be of value in assessing the validity of this overall picture. First of all, they offer measures of the abundances of O and N in entirely different environments from nearby star-forming galaxies. Second, they sample low metallicity regimes which are rare today. And third, by virtue of their being at high redshift, they can in principle provide a better sampling of the time delay in the production of primary N relative to O—the canonical Myr is a much larger fraction of the time available for star formation at than today. In other words, the chances of ‘catching’ a galaxy in the interim period following a burst of star formation, when the O from Type II supernovae has already dispersed into the interstellar medium but lower mass stars have yet to release their primary N, are considerably higher in DLAs than in metal-poor star-forming galaxies in the local universe. Such a situation should manifest itself as a displacement below the primary plateau in the log (N/O) vs. log (O/H) plane in Figure 9.
The number of DLAs with reliable measures of the N and O abundances has slowly grown since the first determination by Pettini et al. (1995); the current total of 35 such systems (Table 11) provides a moderate size sample with which to confront the above scenario. When DLAs are compared with present-day galaxies, as in Figure 9, it can be seen that in most cases their values of N/O fall close to the plateau defined by metal-poor H ii regions. If primary N and O are synthesised by stars of different masses, as generally believed, the good agreement between local and distant galaxies attests to the universality of the IMF—a top-heavy IMF in DLAs would result in lower values of N/O, contrary to observations.
Out of the 35 DLAs in our sample, 12 (%) lie more than 0.3 dex [twice the typical error in the determination of ] below the primary plateau. For comparison, at the mean of the 35 DLAs in Table 11, where is the age of the universe at redshift (in today’s consensus cosmology). The difference between these two fractions is probably not significant, given that the DLA sample in Table 11 is somewhat biased towards chemically unevolved DLAs and that the age of the universe is in any case an upper limit to the time available for star formation. Certainly, the current DLA statistics are consistent with a time delay of a few years and allay earlier concerns based on more limited samples (e.g. Pettini et al. 2002a).
Figure 9 also emphasises the importance of extending measurements of N/O to the lowest metallicity DLAs: as the gap between secondary and primary N production widens, it becomes easier to recognise additional sources of primary nitrogen, if they exist. That is, if intermediate mass stars are the sole producers of primary N, it should be possible to find DLAs with values of N/O close to the secondary line in Figure 9. On the other hand, if massive stars were able to synthesise some primary N, we might expect to see a minimum value of N/O, corresponding to the N ejected into the ISM at the same time as O. This idea was first proposed by Centurión et al. (2003—see also Molaro 2003) and recent work on stellar yields including the effects of rotation (e.g. Hirschi et al. 2007) suggests that it may be plausible. In this respect, the new data presented here (shown by the green triangles in Figure 9) add some weight to the suggestion by Centurión et al. (2003): the lowest metallicity DLAs show values of N/O as low as, but no lower than, the lowest previously measured (in more metal-rich DLAs). While the statistics are still very limited, the available data are at least consistent with a ‘floor’ in the value of N/O at . If this does indeed reflect the primary N yield by massive stars, it would imply that at these metallicities massive stars can account for % of the total primary N production. Clearly, it will be of interest to test the validity of this interpretation as more metal-poor DLAs are studied at high spectral resolution and the sample of N/O measurements at [O/H] increases in the years ahead.
7 Summary and Conclusions
In this paper we have presented new observations of four damped absorption systems (three DLAs and one sub-DLA according to the conventional division between the two at (H i) ) which are among the least metal-enriched known. We have focussed in particular on the clues which the abundance patterns of these DLAs provide on the nucleosynthesis of the C, N, O group at low metallicities. Our main conclusions are as follows.
-
1.
DLAs at the low end of the metallicity distribution can be preselected from medium resolution QSO spectra by targeting damped Ly lines which apparently have no associated metal absorption lines. As expected, such systems turn out to have narrow metal lines when observed at higher spectral resolution, consisting of only a few components spread out over a few tens of km s-1.
-
2.
The most metal-poor DLAs known have oxygen abundances of solar ([O/H] ), and ‘metallicities’ which are lower by factors of when measured in carbon and iron. This level of chemical enrichment is similar to that typical of intergalactic Ly forest clouds and suggest that these DLAs have experienced very little, if any, local star formation activity. No DLAs have yet been discovered with [Fe/H] , comparable to the iron abundance of the most metal-deficient stars in the Galactic halo, but such stars are very rare and larger samples of DLAs may be required to intersect such pristine clouds of neutral gas at high redshift.
-
3.
Together with two sub-DLAs from earlier published studies, we have assembled a small sample of six absorption systems where the C/O ratio can be measured with confidence. We find good agreement between the relatively high values of C/O in these metal-poor DLAs and those measured by Akerman et al. (2004) in halo stars of similar oxygen abundance. The DLA determinations are less ambiguous than their stellar counterparts. The agreement we have found suggests that corrections to the stellar abundances of C and O resulting from more sophisticated treatments of the stellar atmospheres (including 3-D and non-LTE effects) are likely to be of similar magnitude for the lines analysed by Akerman et al. (2004), so that the net corrections to the values of C/O they derived may not be large. The apparent rise of the C/O ratio as we move from stars with [O/H] to lower metallicities points to an additional source of carbon from the massive stars responsible for early episodes of nucleosynthesis, in the Milky Way halo and in high redshift DLAs.
-
4.
The data presented here extend the growing sample of N/O measurements in DLAs to lower oxygen abundances, where the distinction between secondary and primary channels widens. Our results strengthen earlier suggestions of a ‘floor’ in the value of N/O at (or of the solar N/O ratio), although larger samples of metal-poor DLAs are necessary to establish its reality. If this floor reflects the small primary production of N by massive stars, it amounts to % of the total primary N yield integrated along the IMF. If most of the primary N is from intermediate mass stars, the generally good agreement in N/O between most DLAs and nearby low metallicity galaxies is an indication that the IMF does not vary significantly between these different environments and cosmic epochs. More generally, our results add weight to the universality of the stellar yields of C, N, and O (Henry 2004), given the consistency in the ratios C/O and N/O between high redshift DLAs, Galactic stars, and nearby H ii regions.
What is still unclear is where and when these trace metals, which account for less than of the baryons by mass, were synthesised. The element ratios in the most metal-poor DLAs offer clues which may also be relevant to the origin of the metals polluting the intergalactic medium (IGM), where abundances are less well determined (as they rely on photoionisation models) but appear to be similar to those deduced here.
In particular, it is now well established that star-forming galaxies at drive large-scale gas outflows into their surroundings (Adelbeger et al. 2005; Steidel et al. in preparation); the metallicity of the outflowing material is likely to be within a factor of a few of solar (Pettini et al. 2002b; Erb et al. 2006a). A novel suggestion recently put forward by Schaye, Carswell, & Kim (2007) is that the low metallicities commonly deduced for the IGM are misleading, resulting from the poor mixing between small parcels of ejected gas of near-solar composition and true intergalactic gas of primordial origin on much larger scales. The relatively high C/O values we have uncovered in the DLAs studied here could be viewed in this context, as they are not dissimilar to those also measured in disk stars with [O/H] (see Figure 8). In this case, the good agreement with metal-poor halo stars with [O/H] would be coincidental. A more extensive set of C/O measurements in both stars and DLAs should clarify the situation; for example, a definite trend of increasing C/O with decreasing [O/H] would not be expected on the basis of the model proposed by Schaye et al. (2007).
The few DLAs with the lowest values of N/O are more discriminatory in this respect. The median ages of the galaxies which support the outflows at are between and Myr (Shapley et al. 2001; Papovich et al. 2001; Erb et al. 2006b), comparable to, or somewhat larger than, the time delay for the release of primary N from intermediate mass stars. But even in the younger galaxies, the secondary N produced when the metallicity is high ([O/H] , Erb et al. 2006a) would result in N/O ratios significantly higher than observed in the most metal-poor DLAs. For example, in the young Lyman break galaxy MS1512-cB58, where [O/H] (Teplitz et al. 2000), Pettini et al. (2002b) deduced , a factor of higher than the ‘floor’ at exhibited by DLAs. Taken together, the C/O and N/O measurements reported here favour an origin of these elements in stars of genuinely low metallicity, rather than in diluted ejecta from galaxies which have already attained high levels of chemical enrichment.
In this case, our data hint to the possibility that massive stars may contribute significantly to the nucleosynthesis of both C and N, as well as O, at the lowest metallicities. Stellar rotation may be the common factor here, through the mixing it induces in the stars’ interiors, but it remains to be established if physically motivated metallicity-dependent C, N, and O yields can reproduce the relative abundances of these elements measured in DLAs, when incorporated into appropriate chemical evolution models. From an observational point of view, it should be possible with current instrumentation and some dedicated effort to increase the numbers of absorption systems with reliable measures of C/O and N/O and place the conclusions reached here on stronger statistical footing. We look forward to such developments in the years ahead.
Acknowledgments
We are grateful to the Keck and ESO time assignment committees for their support of this programme and to the staff astronomers at the Keck and VLT observatories for their help in conducting the observations. Tom Barlow, Bob Carswell, Thiago Gonçalves, Michael Murphy, and Sam Rix kindly helped with different aspects of the data reduction and analysis. Martin Asplund, Damian Fabbian, Dick Henry, Poul Nissen and an anonymous referee made valuable suggestions which improved the paper. We thank the Hawaiian people for the opportunity to observe from Mauna Kea; without their hospitality, this work would not have been possible. CCS’s research is partly supported by grant AST-0606912 from the US National Science Foundation. Some of this work was carried out during a visit by Fred Chaffee to the Institute of Astronomy, Cambridge, supported by the Institute’s visitor grant.
References
- Adelberger et al. (2005) Adelberger, K. L., Shapley, A. E., Steidel, C. C., Pettini M., Erb, D. K. & Reddy, N. A. 2005, ApJ, 629, 636
- Akerman et al. (2004) Akerman, C. J., Carigi, L., Nissen, P. E., Pettini, M., & Asplund, M. 2004, A&A, 414, 931
- Akerman et al. (2005) Akerman, C. J., Ellison, S. L., Pettini, M., & Steidel, C. C. 2005, A&A, 440, 499
- Asplund et al. (2005) Asplund, M., Grevesse, N., & Sauval, A. J. 2005, in Cosmic Abundances as Records of Stellar Evolution and Nucleosynthesis, T. G. Barnes III & F. N. Bash eds. (San Francisco: Astronomical Society of the Pacific), 25
- Centurión et al. (2003) Centurión, M., Molaro, P., Vladilo, G., Péroux, C., Levshakov, S. A., & D’Odorico, V. 2003, A&A, 403, 55
- Chiappini et al. (2006) Chiappini, C., Hirschi, R., Meynet, G., Ekström, S., Maeder, A., & Matteucci, F. 2006, A&A, 449, L27
- Chieffi & Limongi (2002) Chieffi, A., & Limongi, M. 2002, ApJ, 577, 281
- Dekker et al. (2000) Dekker, H., D’Odorico, S., Kaufer, A., Delabre, B., & Kotzlowski, H. 2000, Proc SPIE, 4008, 534
- Dessauges-Zavadsky et al. (2004) Dessauges-Zavadsky, M., Calura, F., Prochaska, J. X., D’Odorico, S., & Matteucci, F. 2004, A&A, 416, 79
- Dessauges-Zavadsky et al. (2001) Dessauges-Zavadsky, M., D’Odorico, S., McMahon, R. G., Molaro, P., Ledoux, C., Péroux, C., & Storrie-Lombardi, L. J. 2001, A&A, 370, 426
- Dessauges-Zavadsky et al. (2003) Dessauges-Zavadsky, M., Péroux, C., Kim, T.-S., D’Odorico, S., & McMahon, R. G. 2003, MNRAS, 345, 447
- Dessauges-Zavadsky et al. (2006) Dessauges-Zavadsky, M., Prochaska, J. X., D’Odorico, S., Calura, F., & Matteucci, F. 2006, A&A, 445, 93
- D’Odorico et al. (2002) D’Odorico, V., Petitjean, P., & Cristiani, S. 2002, A&A, 390, 13
- Ellison et al. (2001) Ellison, S. L., Pettini, M., Steidel, C. C., & Shapley, A. E. 2001, ApJ, 549, 770
- Erb et al. (2006a) Erb, D. K, Shapley, A. E., Pettini, M. Steidel, C. C., Reddy, N. A., & Adelberger, K. L. 2006a, ApJ, 644, 813
- Erb et al. (2006b) Erb, D. K, Steidel, C. C., Shapley, A. E., Pettini, M., Reddy, N. A., & Adelberger, K. L. 2006b, ApJ, 646, 107
- Erni et al. (2006) Erni, P., Richter, P., Ledoux, C., & Petitjean, P. 2006, A&A, 451, 19
- Fabbian et al. (2006) Fabbian, D., Asplund, M., Carlsson, M., & Kiselman, D. 2006, A&A, 458, 899
- Fabbian et al. (2008a) Fabbian, D., Asplund, M., Carlsson, M., & Kiselman, D. 2008a, A&A, submitted
- Fabbian et al. (2008b) Fabbian, D., Nissen, P. E., Asplund, M., Pettini, M., & Akerman, C. J. 2008b, A&A, submitted
- Ferland (2000) Ferland, G. J. 2000, in Revista Mexicana de Astronomia y Astrofisica Conference Series, ed. S. J. Arthur, N. S. Brickhouse, & J. Franco, 153
- Ferland et al. (1998) Ferland, G. J., Korista, K. T., Verner, D. A., Ferguson, J. W., Kingdon, J. B., & Verner, E. M. 1998, PASP, 110, 761
- Field & Steigman (1971) Field, G. B., & Steigman, G. 1971, ApJ, 166, 59
- Grevesse & Sauval (1998) Grevesse, N., & Sauval, A. J. 1998, Space Science Reviews, 85, 161
- Haardt & Madau (2001) Haardt, F., & Madau, P. 2001, in Clusters of Galaxies and the High Redshift Universe Observed in X-ray, eds. D. M. Neumann & J. T. V. Tran, (astro-ph/0106018)
- (26) Henry, R. B. C. 2004, in Origin and Evolution of the Elements, ed. A. McWilliam & M. Rauch (Cambridge: Cambridge University Press), 43
- Henry et al. (2000) Henry, R. B. C., Edmunds, M. G., & Köppen, J. 2000, ApJ, 541, 660
- Henry & Prochaska (2007) Henry, R. B. C., & Prochaska, J. X. 2007, PASP, 119, 962
- Hirschi et al. (2007) Hirschi, R., Chiappini, C., Meynet, G., Ekström, S., & Maeder, A. 2007, (arXiv:0709.1886)
- Jenkins & Tripp (2006) Jenkins, E. B., & Tripp, T. M. 2006, ApJ, 637, 548
- Ledoux et al. (1998) Ledoux, C., Petitjean, P., Bergeron, J., Wampler, E. J., & Srianand, R. 1998, A&A, 337, 51
- Ledoux et al. (2006a) Ledoux, C., Petitjean, P., Fynbo, J. P. U., Møller, P., & Srianand, R. 2006a, A&A, 457, 71
- Ledoux et al. (2006b) Ledoux, C., Petitjean, P., & Srianand, R. 2006b, ApJL, 640, L25
- Liang et al. (2007) Liang, Y. C., Hammer, F., Yin, S. Y., Flores, H., Rodrigues, M., & Yang, Y. B. 2007, A&A, 473, 411
- Lopez & Ellison (2003) Lopez, S., & Ellison, S. L. 2003, A&A, 403, 573
- Lopez et al. (2002) Lopez, S., Reimers, D., D’Odorico, S., & Prochaska, J. X. 2002, A&A, 385, 778
- Lu et al. (1998) Lu, L., Sargent, W. L. W., & Barlow, T. A. 1998, AJ, 115, 55
- Mallery et al. (2007) Mallery, R. P., et al. 2007, ApJ, in press (arXiv:0706.0238)
- Melbourne et al. (2004) Melbourne, J., Phillips, A., Salzer, J. J., Gronwall, C., & Sarajedini, V. L. 2004, AJ, 127, 686
- Molaro (2003) Molaro, P. 2003, in CNO in the universe, C. Charbonnel, D. Schaerer, & G. Meynet eds., (San Francisco: Astronomical Society of the Pacific), 304, 221
- Molaro et al. (2000) Molaro, P., Bonifacio, P., Centurión, M., D’Odorico, S., Vladilo, G., Santin, P., & Di Marcantonio, P. 2000, ApJ, 541, 54
- Morton (2003) Morton, D. C. 2003, ApJS, 149, 205
- Morton et al. (1973) Morton, D. C., Drake, J. F., Jenkins, E. B., Rogerson, J. B., Spitzer, L., & York, D. G. 1973, ApJL, 181, L103
- Murphy et al. (2007a) Murphy, M. T., Curran, S. J., Webb, J. K., Ménager, H., & Zych, B. J. 2007a, MNRAS, 376, 673
- Murphy et al. (2007b) Murphy, M. T., Tzanavaris, P., Webb, J. K., & Lovis, C. 2007b, MNRAS, 378, 221
- Nava et al. (2006) Nava, A., Casebeer, D., Henry, R. B. C., & Jevremovic, D. 2006, ApJ, 645, 1076
- Nissen et al. (2007) Nissen, P. E., Akerman, C. J., Asplund, M., Fabbian, D., Kerber, F., Kaufl, H. U., & Pettini, M. 2007, A&A, 469, 319
- O’Meara et al. (2006) O’Meara, J. M., Burles, S., Prochaska, J. X., Prochter, G. E., Bernstein, R. A., & Burgess, K. M. 2006, ApJL, 649, L61
- Papovich et al. (2001) Papovich, C., Dickinson, M. E., & Ferguson, H. C. 2001, ApJ, 559, 620
- Péroux et al. (2007) Péroux, C., Dessauges-Zavadsky, M., D’Odorico, S., Kim, T.-S., & McMahon, R. G. 2007, MNRAS, 924,
- (51) Petitjean, P., Ledoux, C., & Srianand, R. 2008, A&A, in press
- (52) Pettini, M. 2004, in Cosmochemistry: The Melting Pot of Elements, C. Esteban, A. Herrero, R. Garcia-Lopez, and F. Sanchez eds. (Cambridge: Cambridge University Press), 257
- Pettini et al. (2002a) Pettini, M., Ellison, S. L., Bergeron, J., & Petitjean, P. 2002a, A&A, 391, 21
- Pettini et al. (1990) Pettini, M., Hunstead, R. W., Smith, L. J., & Mar, D. P. 1990, MNRAS, 246, 545
- Pettini et al. (1995) Pettini, M., Lipman, K., & Hunstead, R. W. 1995, ApJ, 451, 100
- Pettini et al. (2002b) Pettini, M., Rix, S. A., Steidel, C. C., Adelberger, K. L., Hunt, M. P., & Shapley, A. E. 2002b, ApJ, 569, 742
- Pettini et al. (1997) Pettini, M., Smith, L. J., King, D. L., & Hunstead, R. W. 1997, ApJ, 486, 665
- Pritzl et al. (2005) Pritzl, B. J., Venn, K. A., & Irwin, M. 2005, AJ, 130, 2140
- Prochaska et al. (2007) Prochaska, J. X., Chen, H.-W., Wolfe, A. M., Dessauges-Zavadsky, M., & Bloom, J. S. 2007, ApJ, in press (arXiv:astro-ph/0703701)
- Prochaska et al. (2005) Prochaska, J. X., Herbert-Fort, S., & Wolfe, A. M. 2005, ApJ, 635, 123
- Prochaska et al. (2003) Prochaska, J. X., Howk, J. C., & Wolfe, A. M. 2003, Nature, 423, 57
- Prochaska & Wolfe (1997) Prochaska, J. X., & Wolfe, A. M. 1997, ApJ, 474, 140
- Rix et al. (2007) Rix, S. A., Pettini, M., Steidel, C. C., Reddy, N. A., Adelberger, K. L., Erb, D. K., & Shapley, A. E. 2007, ApJ, 670, 15
- Ryan-Weber et al. (2006) Ryan-Weber, E. V., Pettini, M., & Madau, P. 2006, MNRAS, 371, L78
- Schaye et al. (2007) Schaye, J., Carswell, R. F., & Kim, T.-S. 2007, MNRAS, 379, 1169
- Shapley et al. (2001) Shapley, A. E., Steidel, C. C., Adelberger, K. L., Dickinson, M., Giavalisco, M., & Pettini, M. 2001, ApJ, 562, 95
- Simcoe et al. (2004) Simcoe, R. A., Sargent, W. L. W., & Rauch, M. 2004, ApJ, 606, 92
- Spite et al. (2005) Spite, M., et al. 2005, A&A, 430, 655
- Strömgren (1948) Strömgren, B. 1948, ApJ, 108, 242
- Teplitz et al. (2000) Teplitz, H. I., et al. 2000, ApJL, 533, L65
- Viegas (1995) Viegas, S. M. 1995, MNRAS, 276, 268
- Vladilo (2004) Vladilo, G. 2004, A&A, 421, 479
- Vladilo et al. (2001) Vladilo, G., Centurión, M., Bonifacio, P., & Howk, J. C. 2001, ApJ, 557, 1007
- Vogt et al. (1994) Vogt, S. S., et al. 1994, Proc SPIE, 2198, 362
- Wolfe et al. (2005) Wolfe, A. M., Gawiser, E., & Prochaska, J. X. 2005, ARA&A, 43, 861
- Wolfe et al. (1986) Wolfe, A. M., Turnshek, D. A., Smith, H. E., & Cohen, R. D. 1986, ApJS, 61, 249