Radio-Optical Study of Double-Peaked AGNs. I. 3C 390.3
Abstract:
We aim to test the model proposed to explain the correlation between the flux density at 15 GHz of a stationary component in the parsec-scale jet and the optical continuum emission in the radio galaxy 3C 390.3. In the model, the double-peaked emission from 3C 390.3 is likely to be generated both near the disk and in a rotating subrelativistic outflow surrounding the jet, due to ionization of the outflow by the beamed continuum emission from the jet. This scenario is chosen since broad-emission lines are observed to vary following changes in the inner radio jet. For recent epochs we have imaged and modelled the radio emission of the inner jet of 3C 390.3, which was observed with very long baseline interferometry at 15 GHz, 22 GHz and 43 GHz, to image the inner part of the parsec-scale jet, locate the exact region where the bulk of the continuum luminosity is generated and search for the mechanism that drives the double-peaked profile emission. We present the preliminary results of testing the model using data from 11 years of active monitoring of 3C 390.3.
1 Inner Jet Structure in the Double-Peaked AGN 3C 390.3
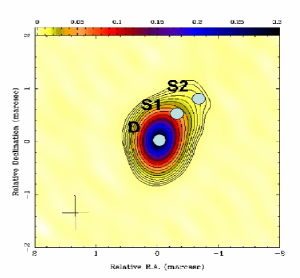
Among the variety of types and species in the AGNs “zoo”, there is a small fraction of AGNs showing unusual broad and double-peaked profiles of Balmer and Mg II emission lines, hereafter double-peaked (DP) AGNs. The widths of the DP profiles range from several thousands to 40000 km s-1 . The first DP emission line profile was discovered in the H profile of the broad-line radio galaxy 3C 390.3, whose parsec-scale radio jet has been monitored at 15 GHz since 1995 with the Very Long Baseline Array (VLBA). The compact jet can be modelled by circular Gaussian components (see Figure 1). The features D (at r=0 mas), S1 (at r=0.3 mas) and S2 (at r=1.5 mas) are stationary components, whilst the other features are moving. We have measured flux densities of all the jet components and used back-extrapolation of linear fits to the component trajectories to calculate the epochs of ejection from the nucleus (D) and the epochs of passage through the closest stationary feature (S1). Most of the observations with very long baseline interferometry (VLBI) have been extracted from the MOJAVE survey [3].
2 Results
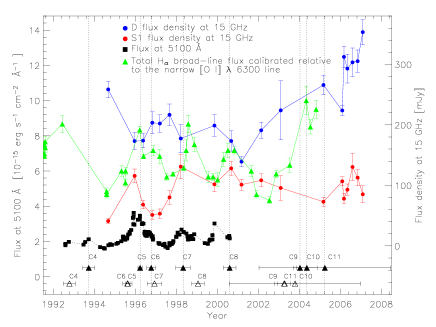
Arshakian et al. (2006) found a significant correlation with the flux density at 15 GHz of the stationary component S1 in the parsec-scale jet and the optical continuum emission in 3C 3903. This strongly implies that the jet emission from component S1 is the main source of the optical continuum driving the DP emission line variability. We imaged and model fitted the VLBI data at 15 GHz for recent epochs (2001-2007), finding four new features (C8, C9, C10, C11). We used measures of the H broad line [2] to follow the variations between the jet components and the nuclear optical emission. We back-extrapolated the trajectories of the features identified in the jet, the components C5-C10 passed through the location of the stationary feature S1 shortly after local optical maxima (green line in Figure 2). The null hypothesis that this happens by chance is rejected at a confidence level of 99.99 % . The H light curve shows a correlation with the flux density of the stationary feature S1 at a high confidence level, whilst there is no such correlation for any other component. In Figure 2 is shown the apparent anticorrelation between the flux variability of the component D at the base of the jet and the stationary component S1 becoming dramatic for the most recent epochs.
3 Discussion and Future work
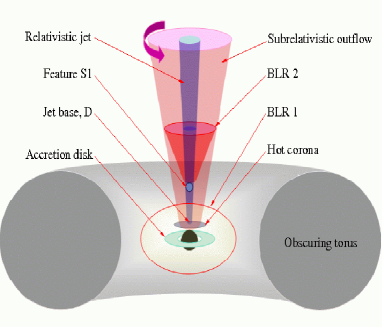
We found a correlation between the S1 jet component and the H optical emission using 11 years of VLBI and H broad-emission line monitoring, supporting the idea that the optical nuclear emission in 3C 390.3 has a non-thermal origin. Figure 2 shows the suggested scheme that explains the basic properties of the optical emission (continuum and broad H) driven by the inner jet. The multi-frequency analysis and the spectrophotometric monitoring for 3C 390.3 still in progress.
References
- [1] T. G. Arshakian et al., The Source of Variable Optical Emission is Localized in the Jet of the Radio Galaxy 3C 390.3, in proceedings of Relativistic Astrophysics and Cosmology - Einstein’s Legacy meeting, November 7-11, 2005, Munich, Germany, eddited by B. Aschenbach, V. Burwitz, G. Hasinger, and B. Leibundgut (2005) [astroph/06020016]
- [2] S. Gezari et al., Long-Term Profile Variability of Double Peaked Emission Lines in Active Galactic Nuclei (2007), ApJS 169 167
- [3] K.I. Kellerman et al., Sub-Milliarcsecond Imaging of Quasars and Active Galactic Nuclei. III. Kinematics of Parsec-Scale Radio Jets (2004), ApJ 609 539
- [4] A.I. Shapovalova et al., Intermediate Resolution of H and Photometric Monitoring of 3C 390.3. I.Further Evidence of a Nuclear Accretion Disk (2001), A&A, 376 775