The dynamics of non-linear optical absorption
Abstract
On traversing materials with absorbing dyes, weak optical beams develop a Beer (exponential) profile, while intense beams develop a spatially initially linear and then finally an exponential profile. This anomalous, deep penetration due to photo-bleaching of surface layers is important for heavy dye-loading and intense beams, for instance in photo-actuation. We address the problem of the evolution in time from initial Beer’s Law to deeply penetrating optical profiles in dyes. Our solution of the coupled, non-linear, partial differential equations governing the spatio-temporal decay of the Poynting flux and the non-linear dynamics of the trans-cis conversion is applicable to general systems of photo-active molecules under intense irradiation, for instance in biology, in spectroscopy and in opto-mechanical devices.
Light absorption can optically switch the nematic phase of liquid crystals to the disordered, isotropic state: rodlike dye molecules transform from their linear trans to their bent cis isomers and thereby disrupt the orientational order of their nematic hosts. Although an interesting optical effect in its own right, when such a host is part of a nematic elastomer, then the solid responds with stresses Cviklinski et al. (2002) or huge (100s%) optically-induced strains Camacho-Lopez et al. (2004); Harris et al. (2005). Optical actuation offers advantages over electrical, thermal and solvent mediated response, being of large amplitude, easily reversible, sensitive to polarisation and susceptible to remote application.
Two mysteries attend photoisomerisation, seen for instance in actuation. For linear absorptive processes at low light intensities (and therefore exponential profiles with depth, i.e. Beer’s Law), and for mechanical contraction proportional to trans-cis conversion, one can show Warner and Mahadevan (2004) that optimal bend of a photo-cantilever obtains at where is the cantilever thickness and the penetration depth in Beer’s Law with the Poynting flux at depth in the cantilever. For only a thin skin of material near the front face contracts and the remaining material resists bend. This limit of little penetration is that of high dye loading and in practice is often employed van Oosten et al. (2007). Non-linear absorption at high light intensities, where Beer’s law gives way to a linear and more penetrating profile for Statman and Janossy (2003), has been suggested as a mechanism Corbett and Warner (2007a, b) to explain the bending of cantilevers with . The second mystery concerns the dynamical response, which is often initially slow and then proceeds quickly Serra and Terentjev (2008), especially in heavily dye-loaded systems. It is this second mystery that we address in this paper.
In considering trans and cis populations and their dynamics, we assume for simplicity that transitions are only optically-induced in the forward, tc direction and that the ct back-reaction is not optically, but only thermally induced (at rate ), as is often the case Eisenbach (1978); see also Statman and Janossy (2003). We return to the case of an optically stimulated back-reaction briefly at the end of the paper. Given these optical transitions, the spatial decay of the Poynting flux of a light beam, , is governed by
| (1) |
where is the local number fraction of trans dye molecules and depends on time and space (through ). The Beer length is that depends on the material parameters (proportional to the number density of chromophores and the energy each tc transition absorbs from the beam) and on which determines the tc transition rate as we also see in the dynamical equation for :
| (2) |
The cis number fraction is . We reduce intensity by the incident value to give . The combination gives a characteristic intensity, a material constant related to the trans photo response. If is reduced by , then is a measure of how intense the incident beam is. The above equations then reduce to:
| (3) |
At short times conversion has not yet proceeded and . Then the first of (3) easily integrates to Beer’s Law .
At long times (equilibrium) and thus . For weak beams () and again (3) gives Beer’s Law. At high intensities one has non-linear absorption Statman and Janossy (2003). Then , at least before depths such that the beam attenuates to . Then in (3) one has and hence (for ). The intensity profile is initially linear until depths where rises to being significantly greater than and absorption is then important. The surface layer is in effect photo-bleached and lets much light down to depths ; see Corbett and Warner (2007a, b) for a detailed discussion, including of the role of optical backreaction. We consider here for simplicity non mesogenic dyes and thus avoid dye rotation rather than cis formation as a route to bleaching (see Yager and Barrett (2006) for this possibility). With the equilibrium form of inserted into the first part of (3), we can integrate to give the full, non-linear, equilibrium profile:
| (4) |
The long-time limit ( in practice) of our dynamical profiles will display the linear rather than exponential forms until depths much greater than . The Mathematica defined function ProductLog gives Corbett and Warner (2007a, b) the solution: .
We are concerned here with the dynamics of the transition from Beer’s law initially to the above equilibrium profile for intense beams. The absorbance is the usual measured quantity and reflects the absorber number in the optical path. Rearranging the first of eqns (3) to and integrating and , one obtains for all times and incident intensities (recall for all ):
| (5) |
where is the mean trans number fraction through the sample. In the non-linear limit, is not independent of and hence is no longer a simple, material-dependent extinction coefficient.
The dynamics of is often observed and analysed assuming exponential behaviour:
Note that exactly and that the non-linear limit of is given by the ProductLog solution to eqn (4) for . However, this is not a solution to the differential eqns (3) and becomes a bad dynamical estimate for thick samples, , that are only traversed by intense beams because of bleaching. The characteristic time is shorter than thermal times when the driving is large (intense beams), but clearly depends on position in thick samples and there is a spectrum of times and the overall response is not exponential.
To solve the problem exactly, use as the variable. Denote partial spatial and temporal derivatives of by and respectively. Differentiating eqn (5) with respect to and using the second of eqns (3) for under the integral yields:
Now use , , and :
| (6) | |||||
| (7) |
A final quadrature gives :
| (8) |
The initial absorption obtains from the vanishing of each side of (8), and is Beer’s Law.
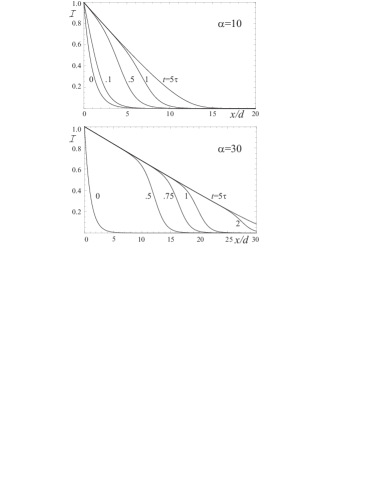
Figure 1 first shows for reduced intensity as a function of for a set of times . Initially at , the profile is exponential, and at long times () the profile is essentially linear out to , then decays exponentially. At intermediate times the profile first saturates (bleaches) at small , that is it approaches the initial part of the equilibrium profile. Then as the surface layers let more light through, the profile deeper down also approaches the non-Beer form. For even higher , higher incident intensity, ultimate penetration is deeper and the approach to the bleached state, as time advances, even sharper. A front of bleaching propagates through the sample. Compare the two graphs at a given , say. The more intense case, , sees a much quicker achievement of the bleached state than the case, and over times considerably shorter than , as the approximate analysis suggested. For either , a sample with thickness , say, would see an intensity of emerging light far in excess of any Beer expectation, the rate build up of which we now examine.
Although these curves of Fig. 1 are vital to understanding the build up (and possible decay) of optically-induced curvature in heavily dye-doped solid nematics, the intensity profile is not in general directly observable. It is more feasible to measure the dynamics of the build-up of intensity of the light emerging at the back face of a sample, . Figure 2 reveals for various fixed thicknesses , for two reduced incident intensities .
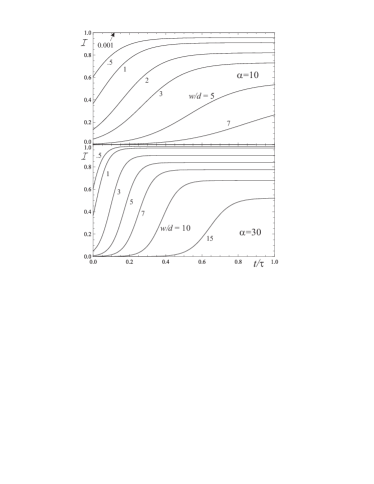
The initial () value is just that from Beer penetration, . Finally rises to the long-time, bleached value shown at the corresponding in Figs 1. The rise is naturally slower for thicker samples. Such dynamics of light penetration has been seen by Serra and Terentjev Serra and Terentjev (2008).
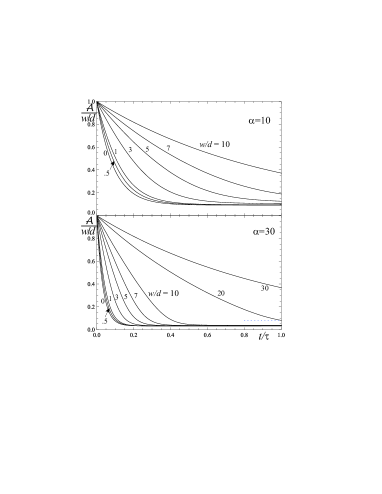
Thick () beams give initially exponentially small emergent fluxes that give way to large fluxes as the linear profile is set up. Such data are accommodated in the usual logarithmic way, here by dividing the absorbance by the thickness which is not a material-dependent constant (an extinction) in this non-linear limit. Figure 3 shows for various fixed thicknesses , for incident intensities .
The initial increase of intensity away from the Beer value in Fig. 2 is whereupon using (7) for at where , one obtains for initial slope
| (9) |
For intense beams () on thick () samples, the initial intensities at the back face on irradiating the front face are small, . The rates of increase are also initially very small, , but then rise sharply with time, see the example with .
Two other processes are sometimes important in non-linear absorption, those of host absorption and of cis absorption, that is optically-stimulated back reaction. Both are discussed in detail in the non-linear static case Corbett and Warner (2007b). Moderate host absorption can be successfully divided out and plays a limited role. Back reaction occurs if the tc and ct absorption lines begin to overlap. This is sometimes the case and has the effect of reducing deep penetration Statman and Janossy (2003).
In eqn (1) host absorption gives another term, , while cis depletion of the beam gives . Optical back reaction also effects the dynamics. An additional term from the decay ct acts in eqn (2) to replenish the trans population. There is a characteristic intensity analogous to that of the trans species, and thus another measure of the incident beam intensity. Now the coupled, non-linear partial differential equations (3) become:
| (10) | |||||
| (11) |
The changes, even if only one of these influences is introduced at a time, add difficulty to the solution of the equations. Proceeding as before, one differentiates eqn (10) with respect to time and uses (11) to eliminate . Where appears, it can be eliminated in favour of by using eqn (10) again. Terms do not quite all integrate totally as in going from (6) to (7) because eqn (10) has additional new constant terms.
Spatially integrating gives:
| (12) | |||||
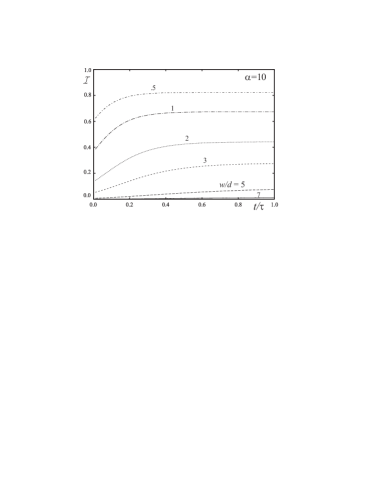
where is an effective absorption length arising from the simple combination of dye and host absorptions in the Beer limit. It is interesting that although (and thus ) and enter eqns (10) and (11) in entirely different ways, their effects can be scaled on to each other in the resultant equation for dynamical non-linear absorption (12). Remember however that depends on and so lengths are not quite equivalently effected by this interchange of sources of extra absorption. We show just the effect of adding in optical back-reaction into the dynamical equations, that is and lengths are still reduced by . For and, say, , the curves are indistinguishable from those in upper Fig. 2 which have . Figure 4 shows the behaviour for which should be compared with upper Fig. 2. The starting values are of course the same; the final values are lower because acts to lower the final penetration. The upward curvature at short times is lost. Thicker samples are much more drastically affected.
We have shown that the dynamics of penetration of intense light beams into heavily absorbing media is complex and strongly dependent upon incident intensity. A practical experiment to observe this effect via the emergent light from the sample is proposed. There is evidence from large amplitude photo-mechanics that non-linear effects are important in practice.
Acknowledgements. We are grateful to Kees Bastiaansen, Dick Broer, Francesca Serra and Eugene Terentjev for useful discussions, and to David Statman for guidance on non-linear statics and dynamics.
References
- Cviklinski et al. (2002) J. Cviklinski, A. R. Tajbakhsh, and E. M. Terentjev, Eur. Phys. J. E 9, 427 (2002).
- Camacho-Lopez et al. (2004) M. Camacho-Lopez, H. Finkelmann, P. Palffy-Muhoray, and M. Shelley, Nature Materials 3, 307 (2004).
- Harris et al. (2005) K. Harris, R. Cuypers, P. Scheibe, C. van Oosten, C. Bastiaansen, J. Lub, and D. Broer, J. Mat. Chem. 15, 5043 (2005).
- Warner and Mahadevan (2004) M. Warner and L. Mahadevan, Phys. Rev. Lett. 92, 134302 (2004).
- van Oosten et al. (2007) C. van Oosten, K. Harris, C. Bastiaansen, and D. Broer, Euro. Phys. J. E 23, 329 (2007).
- Statman and Janossy (2003) D. Statman and I. Janossy, J. Chem. Phys. 118, 3222 (2003).
- Corbett and Warner (2007a) D. Corbett and M. Warner, Phys. Rev. Lett. 99, 174302 (2007a).
- Corbett and Warner (2007b) D. Corbett and M. Warner, Phys. Rev. E submitted, mm (2007b).
- Serra and Terentjev (2008) F. Serra and E. Terentjev, arxiv.org/pdf/0801.1641 (2008).
- Eisenbach (1978) C. Eisenbach, Makromol. Chem. 179, 2489 (1978).
- Yager and Barrett (2006) K. Yager and C. Barrett, in Encyclopedia of NanoScience and NanoTechnology, edited by H. S. Nalwa and S. Miyata (CRC Press, Boca Raton, Florida, 2006).