Dimensions, Maximal Growth Sites and Optimization in the Dielectric Breakdown Model
Abstract
We study the growth of fractal clusters in the Dielectric Breakdown Model (DBM) by means of iterated conformal mappings. In particular we investigate the fractal dimension and the maximal growth site (measured by the Hoelder exponent ) as a function of the growth exponent of the DBM model. We do not find evidence for a phase transition from fractal to non-fractal growth for a finite -value. Simultaneously, we observe that the limit of non-fractal growth () is consistent with . Finally, using an optimization principle, we give a recipe on how to estimate the effective value of from temporal growth data of fractal aggregates.
pacs:
PACS number(s): 61.43.Hv, 05.45.Df, 05.70.FhI Introduction
Laplacian growth and the formation of complex patterns has been the subject of numerous theoretical and experimental works. The classical examples are the ramified pattern appearing in a Hele-Shaw cell when a less viscous fluid is injected into a more viscous fluid Feder and the fractal structures emerging from the particle aggregation in Diffusion-limited Aggregation (DLA) 81WS . In the latter example mono-disperse particles are released one-by-one from a remote source and diffuse until they hit and irreversibly adhere to a seed cluster at the center of coordinates. The cluster slowly expands as particles are added. Statistically, the motion of a single particle is described by the harmonic potential satisfying the Laplace equation and the probability of sticking to the cluster at a specific site, , is given by the harmonic measure . The formulation of DLA is contained within a more general model, the Dielectric Breakdown Model (DBM) 84NPW ; 01Ha , where the growth probability at the cluster interface is proportional to the harmonic measure raised to a power , . Despite intensive research in Laplacian growth, fundamental questions regarding the scaling properties still have no answer. The growth laws of DLA and DBM are extremely simple and in apparent disparity to the complex patterns they produce. The complex patterns arise from a strong correlation between the position of already aggregated particles and the influx of new particles. As the outermost tips advance the probability for particles to reach the parts left behind diminishes and the harmonic measure broadens and becomes even multifractal 02JLMP . For increasing values of the growth probability will concentrate around the tips and the fractal dimension gets closer to unity and ultimately, in the limit of infinite , the particle cluster loses fractality. Recently, it has been speculated that in two dimensions this transition from fractal to non-fractal growth may happen at a finite critical value of and numerically, this value has been found to be 93SGSHL ; 01Ha . In the vicinity of such a critical point it may be safe to disregard the noise giving rise to local density fluctuations along the branches 02H . For that reason, the dominating stochastic component in the cluster growth is the rate at which growing tips split in two or more branches. While growing, neighboring branches compete and if one branch quickly dies after a tip-splitting the growth will stay non-fractal. It has been shown 01H that in the idealized case of straight growing branches, tip-splitting is suppressed for supporting that . Based on the idealized branch growth model a renormalization group approach has been used in an expansion around . Although an expansion provides important information for small values of it may provide little information on DLA (). In this article we test the hypothesis of a critical point at performing extensive numerical simulations. We provide detailed figures on the dependence of the fractal dimension, and the exponent . Moreover, we propose a method for extracting effective -exponents given either experimental or numerical data series. For that purpose we make use of iterated conformal maps 98HL which have proven a convenient tool for generating conformal mappings of domains of arbitrary shape 06MPST , see section II. In Section III a method is proposed for extracting effective exponents by optimization. In section IV we present results pro et con a phase transition in DBM, the maximal growth sites and the fractal dimensions.
II Iterated conformal mappings
The conformal invariance of the Laplace equation reduces the problem of finding the harmonic measure, , around any simply connected domain in the complex plane to that of finding a conformal transformation of the domain to the unit disc
| (1) |
The method of iterated conformal mappings provides a general framework to construct such transforms as well as a simple procedure to grow DLA clusters. Assume that a DLA cluster of particles is mapped to the unit disc by . An extra particle is added to the cluster by first adding a small bump of size to the unit disc using a mapping and subsequently applying the inverse mapping . Finally, the composed mapping transforms the unit disc into a cluster of particles. The basic mapping is defined by two parameters the position and size of the bump, the position, , is random in DLA since the measure is uniform around the circle. The size of the ’th bump is controlled by the condition that
Consequently, the particles (transformed bumps) will all to linear order have the same size . The full recursive dynamics is written as iterations of the basic map
| (2) |
Note that this structure is unusual in the sense that the order of iterates is inverted compared to standard dynamical systems.
For DBM the growth measure along the cluster interface, parameterized by , is given by
| (3) |
which for is not conformally invariant. On the unit circle, parameterized by , the growth measure transforms into
| (4) |
In the simulations we choose according to the distribution using standard Monte Carlo samplings of the measure. The number of samples needed for an accurate estimate of the distribution increases with and is chosen according to
| (5) |
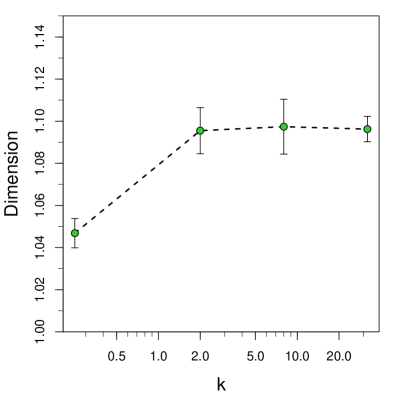
By choosing , the site of maximal measure will on the average be visited more than once during the sampling. It turns out that there is no visible change in the scaling of the clusters when choosing , see Fig. 1 for a test of convergence as function of ; in the results presented below, we use .
III Extracting effective exponents by optimization
Consider an interface growing at a rate determined by some unknown function of the harmonic measure. The method of iterated conformal mappings is readily turned into a framework for estimating this function. More specifically, it is here demonstrated on numerical simulation data of the DBM that the value of can be extracted from a careful tracking of the cluster growth. The general idea is to utilize the iteration scheme in tracking the motion of the interface by gradually expanding the mapping, see 06MPST for further details. The harmonic measure is recorded as the interface evolves and from a maximum likelihood principle the value of the growth is extracted. The probability for growth to occur at a site at the interface is in a given growth step approximated by the sum
| (6) |
From this expression, more ways exist to estimate the value used in the simulation. Assuming that the ’th growth event occurred at the site , a direct estimate of follows from maximizing with respect to . Naturally, this will lead to dramatic fluctuations in the estimates and therefore maximizing products of over several growth steps provides a better estimate,
| (7) |
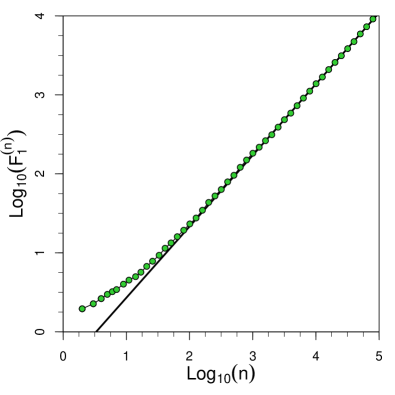
In Fig. 2, we show how this product varies as function of and with the number of factors used. With an increasing number of factors the maximum becomes more pronounced and the value used in the simulations is easily recovered. These products confirms that the number of Monte Carlo samples used in Eq. (5) are appropriate and more importantly that the method is directly applicable to experimental data for estimating an effective value or more generally the boundary condition function determining the growth rate.


IV Dimension and
The dimension of a cluster grown by this conformal mapping technique is determined by the first term in the Laurant expansion of , , which will scale like 98HL . The dimension is thus estimated by a direct fit of this scaling law as demonstrated in Fig. 3 for a cluster 80000 particles and .
Using the conformal mapping technique we have grown clusters up to sizes 80000 particles with varying values of in the interval . Fig. 4 shows the results for the value of the dimension versus . As is clear from the figure, the value of the dimension decreases smoothly with , from the DLA value for down towards for . Hastings 01H presented arguments in favor of an upper critical dimension for which the clusters become one-dimensional. We however do not observe indications of this transition. As seen in Fig. 4 it is quite clear that the data smoothly bends away before reaching the point and only approaching the one-dimensional growth in the limit of large -values. We thus conclude that there do not exist a critical point at a finite .
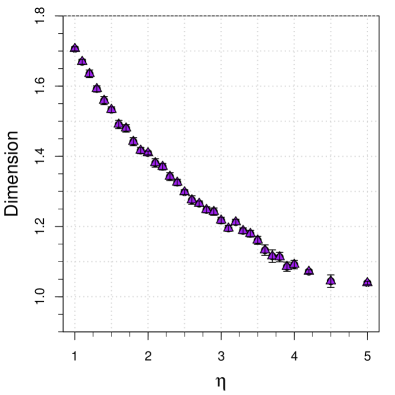
Halsey 02H has computed a first-order correction to for , obtaining . This relation predicts a linear variation of slope around . As seen in Fig. 4 we do not observe this behavior.
It is well know that the growth measure of a DBM model exhibits multifractal properties with a spectrum of growth exponents measured by local Hoelder exponents 02JLMP . The points of highest growth measures are characterized by the minimum -value, . We have earlier determined this value using the iterated conformal mapping technique 03JMP and extend it here to the DBM model. In this method, it is very easy to keep track of where the maximum growth probability is located as more particles are added. Let us assume that at the (-1)’th growth step the site with the largest probability is located at the angle on the unit circle, i.e. for all
| (8) |
When we add a new bump in the ’th growth step the position of maximal probability may not change (up to reparameterization of the angle ), or move to the new bump. We can easily find the reparameterized angle and determine the new position from
| (9) |
If is located at we put in the ’th growth step. Using conformal mappings, we have also previously estimated the critical branching angle as a function of in the DBM model 02MJ .
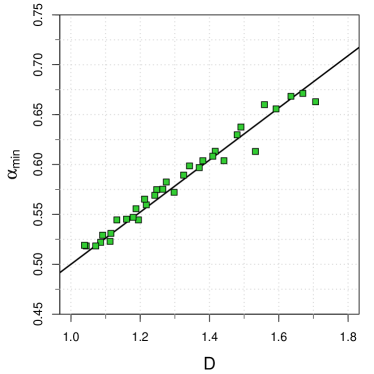
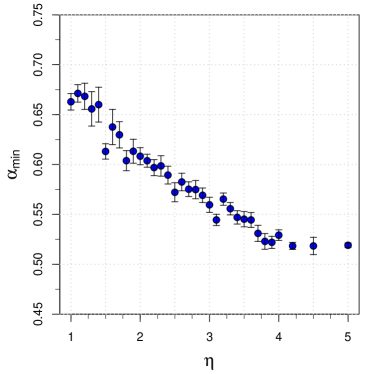
Fig. 5 shows the results of vs. and we observe that decreases from the DLA values down to . It is obvious that corresponds to the Hoelder exponent for a line. In consistency with the results in Fig. 4 we observe that the curve bends smoothly and that the one-dimensional growth is only obtained in the limit . The last figure, Fig. 6, shows plotted vs. . By extrapolation (as indicated by the line) we see that assumes its minimal value 0.5 at a dimension .
V Conclusions
The conclusions of our paper are twofold. Firstly, we have presented a method to extract the effective value of the growth exponent , for a time series of a growing aggregates, assuming an underlying mechanism based on the Dielectric Breakdown Model (DBM) model. The estimate is based on a maximum likelihood method and converges rather well for the numerical data presented here. We believe this method should be directly applicable to experimental data when it is possible to extract intermediate steps in the formation of the aggregates. We urge the method to be used in for example viscous fingering experiments in random media 04L . Secondly, we have thoroughly investigated the scaling structure of DBM clusters as a function of the growth exponent . Based on extensive numerical simulations we do not find support for the conjecture that the growth becomes one-dimensional at the critical value 01H ; 02H . On the contrary, our results indicate that there do not exist a critical point for at finite -value and that the scaling exponent of the maximal growth site assumes its minimal value 0.5 when the growth becomes non-fractal.
VI Acknowledgements
We thank Knut Joergen Maaloy and Stephane Santucci for interesting discussions at an early stage of this work. This project was funded by Physics of Geological Processes, a Center of Excellence at the University of Oslo, the Danish National Research Foundation and the VILLUM KANN RASMUSSEN Foundation for support.
References
- (1) J. Feder, ”Fractals”, Plenum, New York (1988).
- (2) T.A. Witten and L.M. Sander, Phys. Rev. Lett. 47, 1400 (1981).
- (3) L. Niemeyer, L. Pietronero, H.J. Wiesmann, Phys. Rev. Lett. 52 1033 (1984).
- (4) M.B. Hastings, Phys. Rev. Lett. 87, 175502 (2001); arXiv:cond-mat/0103312.
- (5) M. H. Jensen, A. Levermann, J. Mathiesen, and I. Procaccia, Phys. Rev. E 65, 046109 (2002); arXiv:cond-mat/0110203.
- (6) A. Sánchez, F. Guinea, L.M. Sander, V. Hakim, E. Louis, Phys. Rev. E 48, 1296 (1993).
- (7) T.C. Halsey, Phys. Rev. E 65, 021104 (2002); arXiv:cond-mat/0105047.
- (8) M.B. Hastings, Phys. Rev. E 64, 046104 (2001); arXiv:cond-mat/0104344.
- (9) M.B. Hastings and L.S. Levitov, Physica D 116, 244 (1998);arXiv:cond-mat/9607021.
- (10) J. Mathiesen, I. Procaccia, H.L. Swinney, and M. Thrasher, Euro. Phys. Lett., 76, 257 (2006); arXiv:cond-mat/0512274.
- (11) M.H. Jensen, J. Mathiesen, and I. Procaccia, Phys. Rev. E 67, 042402 (2003); arXiv:cond-mat/0212177.
- (12) J. Mathiesen and M.H. Jensen, Phys. Rev. Lett. 88, 235505 (2002); arXiv:cond-mat/0112218v1.
- (13) Grunde Løvoll, Yves Meheust, Renaud Toussaint, Jean Schmittbuhl, and Knut Jørgen Maloy, Phys. Rev. E 70, 026301 (2004); arXiv:cond-mat/0310204.