Corresponding Author: ] htwong@phys.sinica.edu.tw; Tel:+886-2-2789-6789; FAX:+886-2-2788-9828.
TEXONO Collaboration
New limits on spin-independent and spin-dependent couplings of low-mass WIMP dark matter with a germanium detector at a threshold of 220 eV
Abstract
An energy threshold of (22010) eV was achieved at an efficiency of 50% with a four-channel ultra-low-energy germanium detector each with an active mass of 5 g. This provides a unique probe to WIMP dark matter with mass below 10 GeV. With a data acquisition live time of 0.338 kg-day at the Kuo-Sheng Laboratory, constraints on WIMPs in the galactic halo were derived. The limits improve over previous results on both spin-independent WIMP-nucleon and spin-dependent WIMP-neutron cross-sections for WIMP mass between 36 GeV. Sensitivities for full-scale experiments are projected. This detector technique makes the unexplored sub-keV energy window accessible for new neutrino and dark matter experiments.
pacs:
95.35.+d, 29.40.-n, 98.70.VcThere is compelling evidence from cosmological and astrophysical observations that about one quarter of the energy density of the universe can be attributed to Cold Dark Matter(CDM), whose nature and properties are still unknownpdgcdm . Weakly Interacting Massive Particles (WIMP, denoted by ) are the leading candidates for CDM. There are intense experimental effortswimpexpt to look for WIMPs through direct detection of nuclear recoils in NN elastic scattering or in the studies of the possible products through annihilations.
Supersymmetric(SUSY) particlespdgsusy are the leading WIMP candidates. The popular SUSY models prefer WIMP mass() in the range of 100 GeV, though light neutralinos remain a possibilitylightsusy . Most experimental programs optimize their design in the high-mass region and exhibit diminishing sensitivities for , where an allowed region due to the annual modulation data of the DAMA experimentdamaallowed ; damasdep further reinforced by the first DAMA/LIBRA resultsdamalibra remains unprobed. Simple extensions of the Standard Model with a singlet scalar favors light WIMPssmscalar . Detectors with sub-keV threshold are needed for probing this low-mass region and studying WIMPs bound in the solar systemsolarwimp , and non-pointlike SUSY candidates like Q-ballsqball . This presents a formidable challenge to both detector technology and background control. Only the CRESST-I experiment has set limitscresst1 with sapphire()-based cryogenic detector at a threshold of 600 eV.
The Kuo-Sheng(KS) Laboratorytexonoprogram is located at 28 m from a 2.9 GW reactor core with an overburden of about 30 meter-water-equivalence. Limits on neutrino magnetic moments()munureview with a 1.06-kg germanium detector(HPGe) at a threshold of 5 keV were reportedtexonomagmom . These data also allowed the studies of reactor electron neutrinosrnue and reactor axionsraxion . A background level of (cpkkd) at 20 keV, comparable with those of underground CDM experiments, was achieved. The current goal is to develop detectors with kg-scale target mass, 100 eV-range threshold and low-background specifications for the studies of WIMPs, and neutrino-nucleus coherent scatteringstexonocohsca .
Ultra-low-energy germanium detectors(ULEGe) is a matured technique for sub-keV soft X-rays measurements. They typically have modular mass of 510 g while detector arrays of up to 30 elements have been constructed. Compared with , Ge provides enhancement in N spin-independent couplings() due to the dependencepdgcdm ; cdmmaths , where A is the mass number of the target isotopes. The isotope 73Ge (natural isotopic abundance of 7.73%) comprises an unpaired neutron such that it can provide additional probe to the spin-dependent couplings of WIMPs with the neutrons(). The nuclear recoils from N interactions in ULEGe only give rise to 20% of the observable ionizations compared with electron recoils at the same energy. The suppression ratio is called the quenching factor(QF)qftheory . For clarity, all ULEGe measurements discussed hereafter in this article are electron-equivalent-energy, unless otherwise stated.
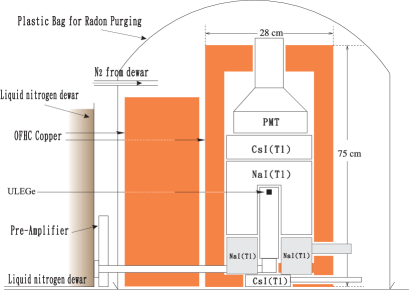
The ULEGe array consists of 4-element each having an active mass of 5 gulege . Standard ultra-low-background specifications were adopted in its construction and choice of materials. It has identical external dimensions as the 1-kg HPGe of Ref. texonomagmom . Apart from swapping between the two detectors, data taking was performed with all other hardware components, shieldings configuration, electronics and data acquisition (DAQ) systemseledaq kept identical. The schematic diagram of the experimental setup inside the shieldings is depicted in Figure 1.
The ULEGe signals were provided by built-in pulsed optical feedback pre-amplifiers, and were distributed to two spectroscopy amplifiers at 6 s() and 12 s() shaping times and with different amplification factors. Discriminator output of defined the trigger conditions for DAQ. The threshold was set to about 4.30.2 times the RMS fluctuations of the signals above the pedestal. The DAQ rates for the ULEGe were about 5 Hz, due mostly to electronic noise and agreed well with expectationscollar0806 ; statham . The , , Anti-Compton Veto (ACV) and Cosmic-Ray Veto (CRV) signals were read out by 20 MHz Flash Analog-to-Digital Convertors. Random trigger(RT) events generated at 0.1 Hz and uncorrelated with the rest of the system, as well as various system control parameters, were also recorded.
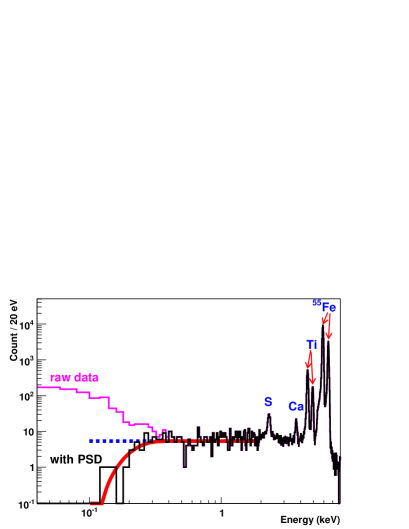

Energy measurements were given by defined in the next paragraph. Figure 1a shows an energy calibration spectrum due to external 55Fe sources(5.90 and 6.49 keV) together with X-rays from Ti(4.51 and 4.93 keV), Ca(3.69 keV), and S(2.31 keV). Photons with energy lower than 2 keV were completely absorbed by the detector window. The RT-events provided the calibration point at zero-energy. The RMS resolutions for the RT-events and 55Fe peaks were about 55 eV and 78 eV, respectively. The calibration procedures were performed before and after the DAQ periods. Linearity was checked up to 60 keV with various -sources, and between zero and 2 keV with a precision pulse generator. The energy scale was accurate to , while deviations from linearity were . The electronic gain drifts, also monitored in situ by the pulse generator, were . A detector hardware “noise-edge” of about 300 eV was achieved.
Pulse shape discrimination (PSD) software was devised to differentiate physics events from those due to electronic noise, exploiting the correlations in both the energy and timing information of the and signals. Displayed in Figure 1b is a scattered plot of the and signals with the PSD cut superimposed, where the superscripts P/T denote partial/total integration of the pulses within (15,25) s and (-20,52) s, respectively, relative to the trigger instant(t=0). The noise events were suppressed. Calibration events and those from physics background were overlaid, indicating uniform response. Events selected by PSD but with CRV or ACV tags were subsequently rejected. The surviving events were ULEGe signals uncorrelated with other detector systems and could be WIMP candidates.
| Energy Bin | 198241 eV | 1.391.87 keV |
| Raw Background Counts | 105212 | 75 |
| Selection Cuts and Systematic Effects : | ||
| Trigger Efficiency (%) | 100 | |
| DAQ Dead Time (%) | ||
| PSD Cumulative Background Survival Fraction (%) | 0.008 | 97 |
| Signal Efficiency (%) | 100 | |
| ACV Cumulative Background Survival Fraction (%) | 0.0 | 2.7 |
| Signal Efficiency (%) | ||
| CRV Cumulative Background Survival Fraction (%) | 0.0 | 0.0 |
| Signal Efficiency (%) | ||
| After-Cut Background Counts | 0 | 0 |
| After-Cut Normalized Background Rates () | ||
| Quenching Factor | ||
| Sampling in (GeV) | 5 | 50 |
| : | ||
| Mean & Errors due to Background & QF Uncertainties | ||
| Limit at 90% Confidence Level | ||
| : | ||
| Mean & Errors due to Background & QF Uncertainties | ||
| Limit at 90% Confidence Level | ||
Data were taken with the ULEGe at KS with different hardware and software configurations. They provided important input on the background understanding and performance optimizations for future full-scale experiments. The data set with the best background and threshold has a DAQ live time of 0.338 kg-day. The analysis results and the systematic effects at the two energy intervals which defined the sensitivities for below and above 10 GeV are summarized in Table 1.
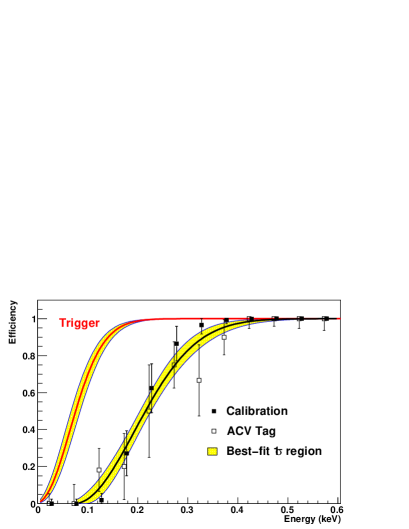
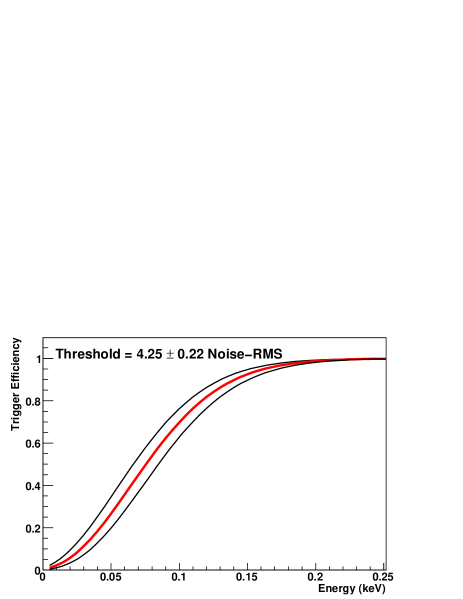
The ULEGe data were taken in conjunction with a CsI(Tl) scintillator arraykscsi for the studies of neutrino-electron scattering. The combined DAQ rate was about 30 Hz. The DAQ dead time and the CRV+ACV selection efficiencies listed in Table 1 were accurately measured using RT-eventstexonomagmom . The maximum amplitude distributions of the RT pedestals and physics events above the noise-edge of 300 eV were measured. The corresponding distributions for events 300 eV were evaluated by interpolations to avoid biased sampling. The trigger efficiencies depicted in Figure 3 correspond to the fractions of the distributions above the discriminator threshold level.
Events in coincidence with ACV-tags are mostly physics-induced. The fraction of these events surviving the PSD cuts was taken to be the PSD efficiency. This assignment is conservative since the actual efficiency corresponds to the survival fraction of samples after electronic noise events in accidental coincidence were subtracted, and therefore should be higher. Alternatively, under the assumption that the 55Fe calibration of Figure 1a would give rise to physics events with a flat spectrum down to the lowest energy relevant to this analysis (100 eV), the deviations of the PSD-selected events from a flat distribution provided the second measurement. Consistent results were obtained with both approaches, as depicted in Figure 3. The larger uncertainties of the first method are due to the limited statistics from only the in situ ACV samples. The efficiencies and their uncertainties adopted for analysis were derived from a best-fit on the combined data set. A threshold of (22010) eV was achieved with a PSD efficiency of 50%.
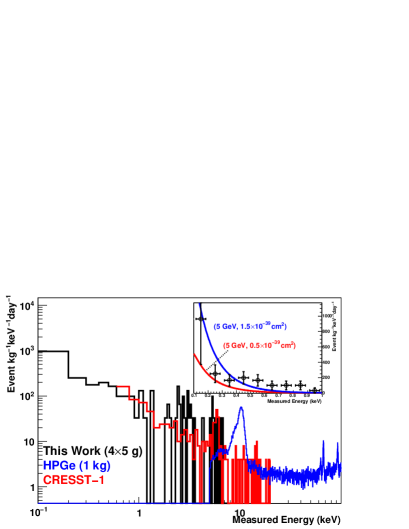
The ULEGe spectrum normalized in cpkkd unit after the CRV, ACV and PSD selections is displayed in Figure 4, showing comparable background as CRESST-Icresst1 . Listed in Table 1 are the normalized background rates, indicating that statistical uncertainties dominate over the systematic effects. The formalisms followed those of Ref. cdmmaths using standard nuclear form factors, a galactic rotational velocity of and a local WIMP density of with Maxwellian velocity distribution. No subtraction of background profiles was made such that the WIMP signals cannot be larger than the observed event rates. The unbinned optimal interval method as formulated in Ref. yellin and widely used by current CDM experiments was adopted to derive the upper limits for the possible N event rates. By comparing the observed background in different energy intervals with the expected number of events due to N recoils for each , the optimal intervals producing the most stringent limits to and were selected. Corrections due to QF, detector resolution and various efficiency factors were incorporated. The energy dependence of QF in Ge was evaluated with the TRIM software packagetrim . The uncertainties were taken to be their difference with the statistical best-fit values of the available datageqf from 254 eV to 200 keV nuclear recoil energy.
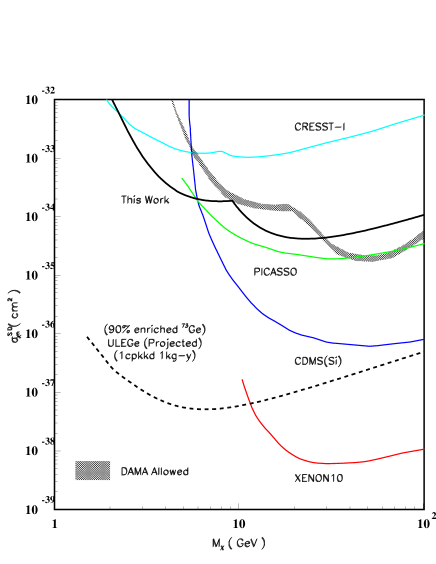
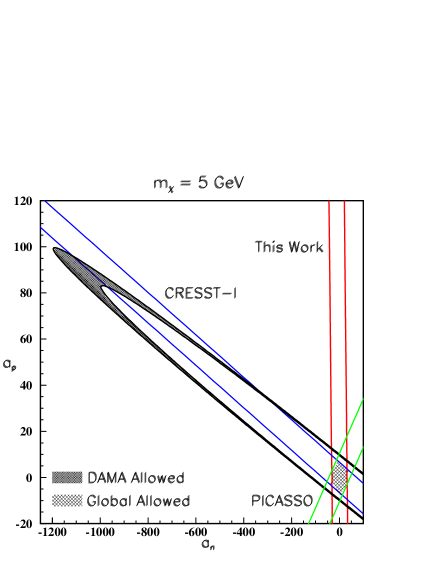
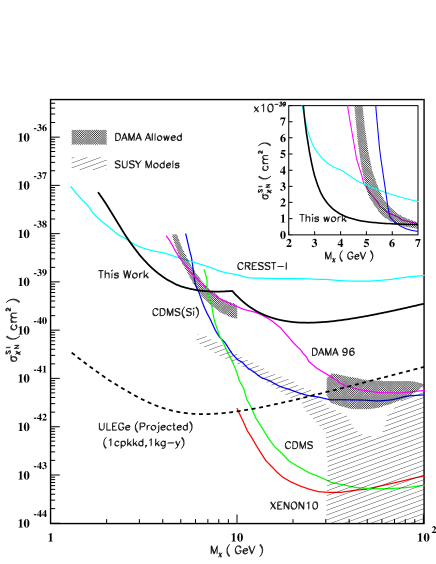
Exclusion plots on both and planes at 90% confidence level for galactically-bound WIMPs were then derived, as depicted in Figures 5 and 6a, respectively. The DAMA-allowed regionsdamaallowed ; damasdep and the current exclusion boundariescresst1 ; cdmbounds are displayed. The model-independent approach of Refs. sdepbottino ; sdeptovey were adopted to extract limits on the spin-dependent cross-sections. Consistent results were obtained when different 73Ge nuclear physics matrix elementsge73np were adopted as input. The constraints on the effective axial four-fermion -proton and -neutron spin-dependent couplingssdeptovey at =5 GeV are displayed in Figure 6b. The parameter space probed by the 73Ge in ULEGe is complementary to that of the CRESST-I experimentcresst1 where the 27Al target is made up of an unpaired proton instead. New limits were set by the KS-ULEGe data in both and for 36 GeV. The remaining DAMA low- allowed regions in both interactions were probed and excluded. The observable nuclear recoils at =5 GeV and =(allowed) and (excluded) are superimposed with the measured spectrum in the inset of Figure 4 for illustrations. It is expected that recent data from the COUPPcoupp08 experiment can place further constraints in the spin-dependent plots of Figures 6a&b.
This work extends the bounds on WIMPs by making measurements in a new observable window of 100 eV1 keV in a low-background environment. Understanding and suppression of background at this sub-keV region is crucial for further improvement. Measurements are conducted with the ULEGe at an underground laboratory. There are recent advances in “Point-Contact” Ge detectorchicago which offer potentials of scaling-up the detector mass to the kg-range. Preliminary results in dark matter searches were recently reportedcogent08 . The mass-normalized external background will be reduced in massive detectors due to self-attenuationtexonocohsca . Further reduction in threshold may be possible with improved junction field-effect-transistors and by correlating signals from both electrodes. The potential reach of full-scale experiments with 1 kg-year of data and a benchmark background level of 1 cpkkd is illustrated in Figures 5 and 6a. Such experimental programs are complementary to the many current efforts on CDM direct searches.
We are grateful to the KIMS Collaboration and the authors of Ref. collar0806 for inspiring comments. This work is supported by the Academia Sinica Pilot Project 2004-06, Theme Project 2008-10, contracts 95-2119-M-001-028 and 96-2119-M-001-005 from the National Science Council, Taiwan and 10620140100 from the National Natural Science Foundation, China.
References
- (1) M. Drees and G. Gerbier, J. Phys. G 33, 233 (2006), and references therein.
- (2) R.J. Gaitskell, Annu. Rev. Nucl. Part. Sci., 54, 315 (2004), and references therein.
- (3) H. H. Haber and M. Schmitt, J. Phys. G 33, 1105 (2006),
- (4) A. Bottino et al., Phys. Rev. D 72, 083521 (2005), and references therein.
- (5) C. Savage, P. Gondolo and K. Freese, Phys. Rev. D 70, 123513 (2004); P. Gondolo and G. Gelmini, Phys. Rev. D 71, 123520 (2005).
- (6) R. Bernabei et al., Riv. Nuovo Cim. 26N1, 1 (2003).
- (7) R. Bernabei et al., arXiv:0804.2741 (2008).
- (8) X.G. He et al., Mod. Phys. Lett. A 22, 2121 (2007).
- (9) T. Damour and L.M. Krauss, Phys. Rev. Lett. 81, 5726 (1998); J.I. Collar, Phys. Rev. D 59, 063514 (1999).
- (10) G. Gelmini, A. Kusenko and S. Nussinov, Phys. Rev. Lett. 89, 101302 (2002).
- (11) G. Angloher et al., Astropart. Phys. 18, 43 (2002).
- (12) H.T. Wong, Mod. Phys. Lett. A 19, 1207 (2004).
- (13) H.T. Wong and H.B. Li, Mod. Phys. Lett. A 20, 1103 (2005).
- (14) H.B. Li et al., Phys. Rev. Lett. 90, 131802 (2003); H.T. Wong et al., Phys. Rev. D 75, 012001 (2007).
- (15) B. Xin et al., Phys. Rev. D 72, 012006 (2005).
- (16) H.M. Chang et al., Phys. Rev. D 75, 052004 (2007).
- (17) H.T. Wong et al., J. Phys. Conf. Ser. 39, 266 (2006).
- (18) J.D. Lewin and P.F. Smith, Astropart. Phys. 6, 87 (1996).
- (19) J. Lindhard et al., Dan. Vid. Mat.-Fys, Medd. 33, 10 (1963); J.F. Ziegler, J.P. Biersack and U. Littmark, The Stopping and Range of Ions in Solid, Pergamon Press (1985).
- (20) Manufacturer: Canberra Industries, Inc.
- (21) W.P. Lai et al., Nucl. Instrum. Methods A 465, 550 (2001).
- (22) F.T. Avignone III, P.S. Barbeau and J.I. Collar, arXiv: 0806.1314 (2008).
- (23) P.J. Statham, X-ray Spect. 6, 94 (1977).
- (24) H.B. Li et al., Nucl. Instrum. Methods A 459, 93 (2001).
- (25) S. Yellin, Phys. Rev. D 66, 032005 (2002).
- (26) J.F. Ziegler, Transport of Ions in Matter, http://www.srim.org (1998).
- (27) K.W. Jones and H.W. Kraner, Phys. Rev. C 1, 125 (1971); K.W. Jones and H.W. Kraner, Phys. Rev. A 11, 1347 (1975); T. Shutt et al., Phys. Rev. Lett. 69, 3425 (1992); Y. Messous et al., Astropart. Phys. 3, 361 (1995).
- (28) R. Bernabei et al., Phys. Lett. B 389, 757 (1996); M. Barnabe-Heider et al., Phys. Lett. B 624, 186 (2005); J. Angle et al., Phys. Rev. Lett. 100, 021303 (2008); Z. Ahmed et al., arXiv:0802.3530 (2008).
- (29) A. Bottino et al., Phys. Lett. B 402, 113 (1997).
- (30) D.R. Tovey et al., Phys. Lett. B 488, 17 (2000).
- (31) M.T. Ressell et al., Phys. Rev. D 48, 5519 (1993); V.I. Dimitrov, J. Engel and S. Pittel, Phys. Rev. D 51, R291 (1995).
- (32) E. Behnke et al., Science 319, 933 (2008).
- (33) P.A. Barbeau, J.I. Collar and O. Tench, JCAP 09, 009 (2007).
- (34) C.E. Aalseth et al., arXiv:0807.0879 (2008).
Appendix I :
Trigger Efficiency at Threshold
Reply to arXiv:0806.1341v2
H.B. Li, S.T. Lin, S.K. Lin, A.K. Soma, H.T. Wong∗
(TEXONO Collaboration)
∗ Corresponding Author: htwong@phys.sinica.edu.tw
The authors in a recent paper collar0806v2a1 raised questions on our estimates of trigger efficiency in the evaluation of the constraints on WIMP Dark Matter in the low-mass () domain with a Ultra-Low Energy Germanium (ULEGe) detector at a threshold of 220 eV texono0712a1 . The discrepancy originates from some misleading terminology in Ref. texono0712a1 . We address the issue in details in this reply. We show how the trigger efficiencies are derived and demonstrate that the results of Ref. texono0712a1 are correct.
I I. Concept of Experiment
Details of the experimental setup and data analysis, as well as the definitions of notations, can be referred to Ref. texono0712a1 . There are two categories of events relevant to the present discussion: physics signals (PHY) and electronic noise (ELE). The PHY events are due to actual energy depositions at the ULEGe by gammas, neutrons, neutrinos, WIMPs and other radiations, while ELE events are induced by the various stages in the readout electronics. The majority of the events above the noise edge of 300 eV are PHY-events. A particularly good method to extract a clean sample of PHY-events below the noise edge for further studies is to require that the ULEGe signals are in coincidence with the Anti-Compton Veto (ACV) tag. However, PHY-events due to neutrinos or dark matter interactions would have to be in anti-coincidence with ACV. A major goal of the experiment is to lower the threshold by suppressing ELE while keeping PHY-events in some substantially large and known fraction.
In order for PHY-events to be included in the final spectra where physics is extracted, they have to survive three procedures, the efficiency of each of which must be known. These efficiency factors were summarized in Table 1 of Ref. texono0712a1 :
-
1.
Trigger efficiency () that PHY would produce a trigger signal to the data acquisition (DAQ) system. This efficiency depends on the energy of PHY.
-
2.
DAQ efficiency () that the trigger signal would actually activate the DAQ system resulting in a complete event recorded in the computer. This efficiency is independent of the energy of PHY.
-
3.
Analysis efficiency () that offline software procedures would retain PHY and suppress ELE. Some PHY would be rejected in the process leading to an efficiency factor which is energy-dependent.
Among these three efficiency factors, the derivations of and were discussed in Ref. texono0712a1 . The was evaluated accurately by “Random Trigger” (RT) events to be 89% – fraction of the RT events actually recorded in the computer. (cited in Table 1 as “DAQ Dead Time” of 11.0%.) Same procedures were used in our earlier work on neutrino magnetic moments texonomagmoma1 . The evaluation of by two different approaches was discussed in the text and the results were shown in Figure 3. Further elaborations are made in Ref. collar0806v3a1 . The rest of this reply would focus on .
II II. Discrepancies and Origins
Ref. collar0806v2a1 challenged our values of , stating that the “discriminator threshold of 20 eV” and “RMS resolution of pedestal (that is, RT events) of 55 eV” would imply a DAQ rate () of 20k Hz, based on a known relation formulaa1
| (1) |
where is the shaping time (=6 s for the trigger signal ), is the RMS of the pedestal noise fluctuations and is the threshold level above the pedestal. The calculated rate is much higher than the actual DAQ rate of 5 Hz for the ULEGe in the actual measurement.
This discrepancy originates from the fact that it is incorrect to use these two energy values together in Eq. 1. In the experiment, the “energy” of an event is defined by integrating (the “Q-mode”) the signal within time intervals (-20,51.2) s where t=0 denotes the trigger instant. That is, the energy is measured through the summation of 71.2X20=1424 FADC numbers. Under this definition, the pedestal (RT) events have an RMS resolution of 55 eV, after appropriate calibration. However, the triggering was done by comparing the signal with a pre-set discriminator level. That is, the relevant quantity in this operation is the amplitude of the pulse (the “A-mode”) and in fact of a different pulse ( instead of , but this is a minor point). The RMS-resolution of RT events in Q-mode is not related to the trigger configuration in A-mode and therefore should not be taken as the of Eq. 1 which describes the trigger rate. It is an experimental optimization frequently used (also discussed in Ref. formulaa1 ) that the energy definitions are based on averaging over long periods, while the triggering schemes make use of the instantaneous response of the signal.
III III. Evaluation of Trigger Efficiency
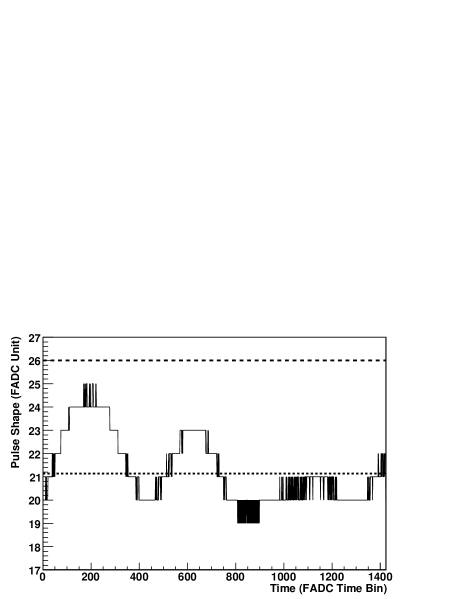
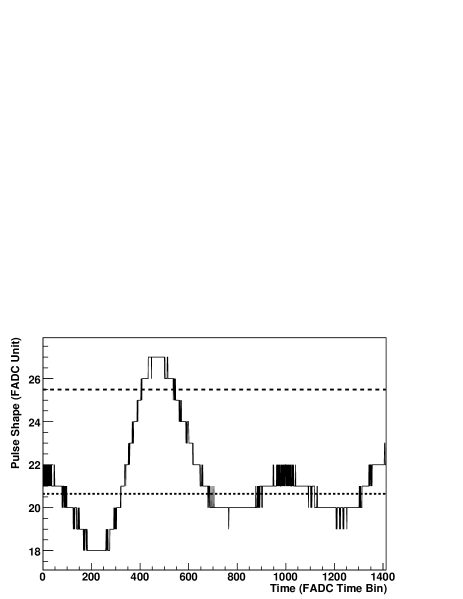
Having identified the source of discrepancy which led to the incorrect conclusions in Ref. collar0806v2a1 , we present the evaluation of in what follows. Displayed in Figures 1a&b are typical signals for RT and PHY events, respectively. The amplitude is presented in FADC unit (2 V is equivalent to 256 FADC unit). The PHY-event was measured to be 139 eV in the Q-mode, and in coincidence with ACV. Superimposed is the discriminator level (382 mV in hardware unit, uncertainties mostly from instabilities over time) which is 4.8 FADC unit above the mean value of the pedestal level. It can be seen that the RT event is below threshold while the PHY event is above threshold by 1.5 FADC unit, thereby provided a trigger to the DAQ system with good margin.
Histograms of large samples of events like those of Figures 1a&b is presented in Figure 2, where the horizontal axis is in FADC unit. The “Random Noise” histogram corresponds to the distribution of the amplitudes of every time-bin of the RT-events. The RMS is 1.1 FADC unit and represents the noise fluctuation of the signal. The discriminator threshold level is also shown. Accordingly, one can equate =6 , =4.80.3 and =1.1 in Eq. 1, giving . The measured rate averaged over the entire DAQ periods of about 17 days and for four channels together is 5 Hz. This is in good agreement.
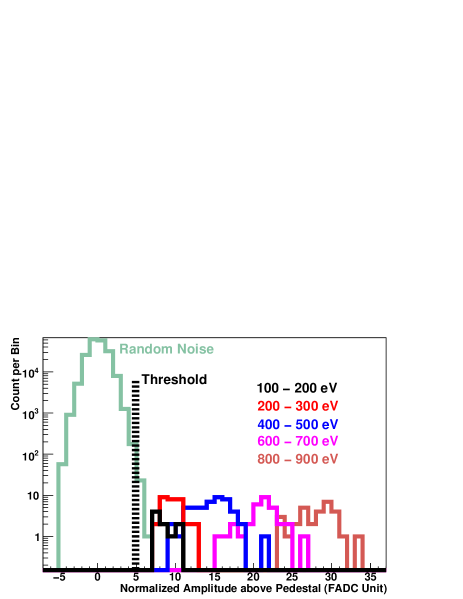
The various distributions show the maximum amplitude of PHY-events at various energy ranges measured by the Q-mode. All the events above 100 eV (the relevant range for subsequent analysis) exhibit at least 1 FADC Unit of margin above threshold. The trigger efficiencies were then derived using the maximum amplitude distributions of the RT events at E=0 and the PHY-events between 300 eV to 1000 eV. The mean and RMS for the E=0300 eV regions were evaluated by interpolation (rather than from actual data) to avoid biased sampling. The results are displayed in Figure 3. We note that the energy range that provides the most severe constraints to the dark matter analysis is that of 200-250 eV, where the trigger efficiency is close to unity.
Using PHY-events as well as data taken with precision test pulser, it can be shown that energy measurements with Q-mode (integration) and A-mode (maximum amplitude) are both valid and equivalent for pulses which are large compared to the noise fluctuations. Moreover, the Q-mode measurements are well-behaved and linear all the way towards the pedestal zero-energy level. On the contrary, the A-mode measurements become inaccurate and the calibration is non-linear as the energy decreases and approaches zero. Although the threshold is well-defined in amplitude (4.80.3 FADC unit), the statement “discriminator threshold at 20 eV” in Ref. texono0712a1 has been misleading and too simplistic. It is incorrect to equate the threshold to a single number in Q-mode as its energy scale. That is, the trigger efficiency versus energy curve of Figure 3 is not a step-function. For instance, % corresponds to an energy range of about 8050 eV. This is the root of the misunderstanding and is corrected in the revised text.
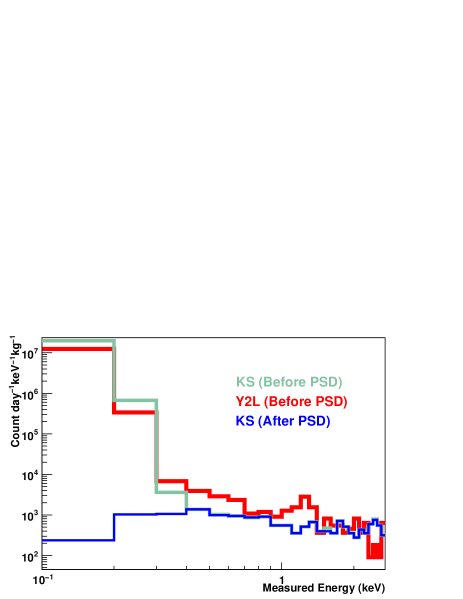
IV IV. Comparison of KS and Y2L Spectra
Another point noted in Ref. collar0806v2a1 is the comparison of spectra in Ref. texono0712a1 with those taken at the Y2L underground laboratory in South Korea y2la1 . Such comparisons would not be appropriate. Different detectors were used even though the specifications are similar. The electronic modules and noise sources (which are affected by many ambient conditions) are not identical. The most important difference is that we did not make an attempt to use pulse shape differentiation (PSD) techniques to suppress ELE-events with Y2L data. The spectra shown with Y2L data are always without PSD cuts, such that the raw “background” dominated by ELE-events below the noise edge are extremely high. DAQ rates in both cases are similar, at the range 1-10 Hz. Displayed in Figure 4 are the raw spectra for both KS and Y2L, as well as that after PSD suppression for KS. It can be seen that the raw spectra are comparable. The residual differences are due to ambient electronic noise and radioactive background conditions.
We are indebted to Profs. F. Avignone, P. Barbeau and J. Collar for careful reading and critical comments on Ref. texono0712a1 . Their input not only expose the parts of the original text where the experimental procedures were not adequately explained, but also stimulate us to more thorough thoughts on the issue.
References
- (1) F.T. Avignone III, P.S. Barbeau and J.I. Collar, arXiv: 0806.1314v2 (2008).
- (2) S.T. Lin et al., TEXONO Collaboration, arXiv:0712.1645 (2007).
- (3) H.B. Li et al., Phys. Rev. Lett. 90, 131802 (2003); H.T. Wong et al., Phys. Rev. D 75, 012001 (2007).
- (4) H.B. Li et al., Reply to arXiv:0806.1341v2 (2008).
- (5) P.J. Statham, X-ray Spect. 6, 94 (1977).
- (6) TEXONO Internal Report (2006).
Appendix II:
Selection Cuts and Efficiencies at Threshold
Reply to arXiv:0806.1341v3
H.B. Li, S.T. Lin, S.K. Lin, A.K. Soma, H.T. Wong∗
(TEXONO Collaboration)
∗ Corresponding Author: htwong@phys.sinica.edu.tw
Additional questions were raised in a recent paper collar0806v3a2 on the experimental concepts and systematic issues of our recent results on WIMP Dark Matter searches in the low-mass () domain with a Ultra-Low Energy Germanium (ULEGe) detector at a threshold of 220 eV texono0712a2 . We provide clarifications and justifications on these issues, and conclude that there are no flaws in our procedures.
V I. Comments and Replies
In a previous version(V2) collar0806v2a2 , the authors raised questions on our DAQ dead time, trigger efficiencies and apparent inconsistencies between the Kuo-Sheng Reactor Laboratory (KS) and the Yang-Yang Underground Laboratory (Y2L) data. In an earlier reply replyv2a2 , these questions were addressed in details. No further comments were made along these lines.
A new version(V3) of the comments collar0806v3a2 was subsequently posted, where questions on the experimental concepts and various systematic issues were raised. We responded on these comments in this article. Section II deals with the basic concepts and performance of the PSD cuts and efficiencies, while Section III elaborates on the reasons behind the various choices made in the experiment. Details of the experimental setup and data analysis, as well as the definitions of notations, can be referred to Ref. texono0712a2 .
VI II. Selection Cuts and Efficiencies
VI.1 A. General Comments
The objectives of applying selection criteria (“cuts”) on experimental data is to reject undesirable “background” events and increase the fraction of “signal” events in the data sample. The events surviving the cuts need not be all signals, only that usually, the signal-to-background ratios are enhanced by the selection.
There are much freedom in the choice of these cuts. There may be effective or ineffective cuts, but in general, all cuts are valid. The variables (“figure of merits” FoM) on which the cuts are applied are defined to optimize the performance. The FoMs can be mathematical constructions and need not correspond to, or be linear to, certain physical variables. Once the events are selected by the cuts, the physical parameters (like energy) can be derived for these events with different algorithms which are themselves constructed to give the best resolutions for these quantities.
When a set of cuts are applied to experimental data, the corresponding “selection efficiencies” must be evaluated. These are the probabilities that potential signal events that will survive these cuts. The goals of applying cuts are to suppress background events as much as possible while keeping the selection efficiencies as large as possible.
VI.2 B. Specific: This Analysis
In this particular analysis texono0712a2 , the ACV and CRV cuts are straightforward. They are signals from detector components other than the ULEGe target, and their efficiencies were evaluated by random trigger (RT) events. Their performance are summarized in Table 1 of Ref. texono0712a2 .
It is the PSD-cut which was questioned by Ref. collar0806v3a2 . This cut was applied to the variables “” and “”, as displayed again in Figure 1. Among them, also provides an energy measurement, while is a mathematical construction to optimize the performance of signal-vs-background differentiation. In this case, “background” corresponds to electronic noise events below the hardware noise edge.
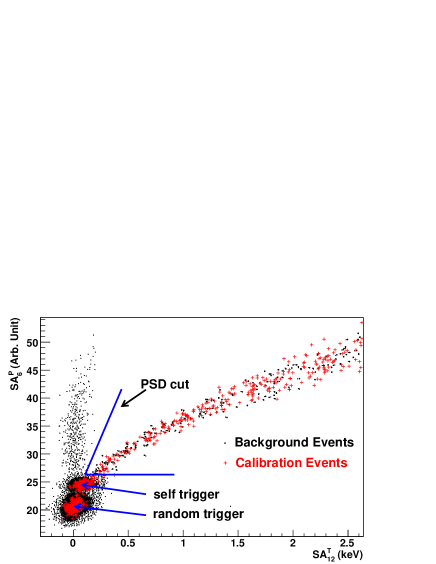
Motivations for the choice of : The two pulses SA6 and SA12 are correlated for physics signals. The correlations are different and less strong for noise-events. The conceptual idea behind the PSD cut is that, given the energy of an event is known through measurements by , positive fluctuations of the SA6-pulses in physics-induced events at a particular time interval and amplitude ranges can be expected. This is probed by the PSD cut. The selected time interval is optimized for energies near threshold (), such that this interval no longer corresponds to the amplitude-peaks of SA6 for events at higher energy. Therefore, being non-linear with energy does not jeopardize the validity of the cut. The reasons behind the non-linear behaviour is well-understood and in fact intentional.
Is the PSD cut arbitrary?. NO. The application of the PSD cut is based on genuine understanding on the behaviour of the detector hardware. Such PSD techniques correlations of two signals at two shaping times and, alternatively, of the full and partial integrations of the signals are well-established ones at higher energy in the case of / separation in many detector systems.
Displayed in Figure 2 are the survival fraction () of events at E=200300 eV with an ACV (Anti-Compton) tag versus the relative timing between the ACV signals and the ULEGe triggers. Overlaid are the actual coincidence time interval between the ACV and the ULEGe systems determined independently from hardware timing. The coincidence window is about 3 s. This is defined by (a) the 6 s shaping time output SA6 from ULEGe which provided the trigger timing; and (b) the increased time-jitters at low energy. The ACV and ULEGe signals outside this range are accidentals and uncorrelated.
It can be seen that ONLY ULEGe events in correct coincidence with the ACV-tags give a substantial value of . The survival fraction for events without ACV-tags (denoted by the data point at negative time in Figure 2) predominantly due to electronic noise at this energy is . This proves that the PSD cut is successfully devised and is performing its intended functions of “suppressing electronic noise events and selecting the physics-induced events”.

Selection Efficiencies: The PSD-efficiency for physics-induced events () is related to the measured survival fraction by
where and are, respectively, the numbers of physics-induced and noise events in correct coincidence with ACV, while is the survival fraction for events triggered by electronic noise. In this experiment, and are measured quantities, at 200300 eV and even less at lower energy, while the average can be evaluated from the non-coincidence samples where . It can be seen that, in general, so long as there are finite fraction of noise events in the ACV-tagged sample.
Statistics are limited in the present analysis since only in situ data were used. The number of noise events in the coincidence ACV-tagged sample is finite but has large uncertainties. Accordingly, the more appropriate approach is to take zero noise-background (), giving rise to the assignment of . The subsequent upper limits derived would therefore be conservative and less constraining ones. The variations of with energy under this assignment are displayed in Figure 3 of Ref. texono0712a2 .
VII III. Experiment’s Choices
Inevitably, an experiment has to choose various tools from the available pool in the course of its analysis. We explain why such choices were made for the cases raised in Ref. collar0806v3a2 , and illustrate the sensitivities to the physics results if alternative schemes would had been selected instead.
VII.1 A. 55Fe spectrum for Selection Efficiency
It was explicitly stated in Ref. texono0712a2 that the flat 55Fe spectrum at low energy is an assumption. Under this assumption, the PSD selection efficiencies were derived. The results agree well with those obtained by the more rigorous approach with ACV-tagged events. The good agreement suggests validity of the assumption at the present level of accuracy. Accordingly, it is justified to add these results to further constrain (to reduce uncertainties of) our knowledge of . This is the approach adopted in Ref. texono0712a2 .
If the data from the 55Fe spectrum would be ignored altogether and the PSD efficiencies would be derived exclusively from the ACV-tagged events, at E=200300 eV would move from (0.650.06) to (0.610.08). The 50% efficiency line would correspond to 224 eV instead of 216 eV, while the limits (in units of throughout in this Section) at would increase (become less constraining) from 0.81 to 0.88.
VII.2 B. Quenching Factor
A compilation of all quenching factor (QF) measurements on germanium is given in Figure 3. Overlaid are calculations from the TRIM software trima2 as well as by the Lindhard model lindharda2 under two parametrizations (k=0.20 and 0.157). Both schemes have been adopted in various CDM experiments. It can be seen that the TRIM results explain well the QF measurements at both low and high energy. Accordingly, we chose to use this scheme in our analysis. The QF values are less than those evaluated with the Lindhard (k=0.20) model, and hence would give rise to more conservative results.
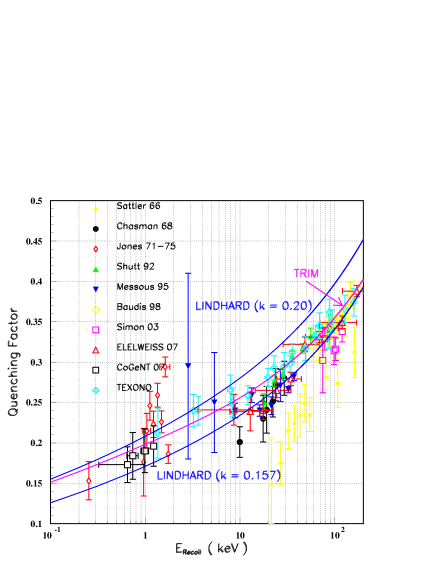
If Lindhard (k=0.20) would be used, the QF at 1 keV recoil energy will be increased from 0.20 to 0.21. The QF uncertainty estimations of 0.006 in Ref. texono0712a2 can account for this deviation. This alternative choice will only have minor effects on the exclusion limits, decreasing it (becoming more constraining) from 0.81 to 0.80 at
VII.3 C. Constructing Exclusion Plots
The unbinned “optimal interval method” as formulated in Ref. yellina2 was adopted to derive the exclusion limits. The unbinned formalism allows the use of all available information in the background spectra and was used in other CDM experiments like CDMS and XENON. NO background profile was assumed or subtracted, which is also a conservative approach. The sensitivities at low under this scheme are driven by the absence of counts between 198 eV and 241 eV.
An alternative method would be to place the background events in different energy bins and follow the formalism of Ref. binneda2 . For instance, choosing 50-eV bins for E100 eV (thereby deliberately filling the hole at 200250 eV), the limit at would increase (become less constraining) from 0.81 to 1.20. This reduction in sensitivities is expected since data binning involves loss of information.
We conclude that our choices in these three aspects of the experiment are justified. The sensitivities of the physics results (exclusion upper limits) are dominated by the statistical uncertainties of the background spectra. The potential effects on them are minor if alternative schemes would have be chosen instead.
References
- (1) F.T. Avignone III, P.S. Barbeau and J.I. Collar, arXiv: 0806.1314v3 (2008).
- (2) S.T. Lin et al., TEXONO Collaboration, arXiv:0712.1645 (2007).
- (3) F.T. Avignone III, P.S. Barbeau and J.I. Collar, arXiv: 0806.1314v2 (2008).
- (4) H.B. Li et al., Reply to arXiv:0806.1341v2 (2008).
- (5) H.B. Li et al., Phys. Rev. Lett. 90, 131802 (2003); H.T. Wong et al., Phys. Rev. D 75, 012001 (2007).
- (6) J.F. Ziegler, Transport of Ions in Matter, http://www.srim.org (1998).
- (7) J. Lindhard et al., Dan. Vid. Mat.-Fys, Medd. 33, 10 (1963).
- (8) S. Yellin, Phys. Rev. D 66, 032005 (2002).
- (9) For example, among many others, G. Angloher et al., Astropart. Phys. 18, 43 (2002).