Freeware solutions for spectropolarimetric data reduction
Abstract
Most of the solar physicists use very expensive software for data reduction and visualization. We present hereafter a reliable freeware solution based on the Python language. This is made possible by the association of the latter with a small set of additional libraries developed in the scientific community. It provides then a very powerful and economical alternative to other interactive data languages. Although it can also be used for any kind of post-processing of data, we demonstrate the capabities of such a set of freeware tools using THéMIS observations of the second solar spectrum.
Université de Toulouse, Observatoire Midi-Pyrénées, LATT (CNRS/UMR5572), 14 ave. E. Belin, F-31400 Toulouse, France
Kipenheuer Institut für Sonnenphysik, Schöneckstr. 6, D-79104 Freiburg, Germany
1. Introduction
The Python language (van Rossum 1990) is increasingly popular in the scientific and, more specifically, in the astronomical community. For instance, it has been already adopted by very large communities such as the Space Telescope Science Institute (STScI) or by the ALMA project. It is also very strong among the various tools used and developed in the frame of the Virtual Observatory endeavour (see http://www.ivoa.net/ for instance).
In combination with a small number of specific libraries, we explain briefly here how it can provide a very powerful interactive data language which can be run on a number of operating system platforms, such as Linux, Mac OS X or Windows. The set of Python libraries we shall describe herafter does not present an interest limited to data reduction since it can also be perfectly used for any kind of post-processing like, for instance, the one of output from numerical simulations.
For the spectropolarimetric data reduction we performed here, we used a combination of tools from the libraries PyFITS, numarray (now NumPY/SciPy) and matplotlib.
Using data collected by G. Molodij and F. Paletou in May 2000 at the THéMIS solar telescope (Paletou & Molodij 2001), we demonstrate the capabilities of such tools by extracting the so-called 2nd spectrum of the Sr i spectral line at 460.7 nm close to the solar limb, as an illustrative example (e.g., Stenflo et al. 1997).
By reprocessing such data with our Python-based tools, we could easily reproduce the results published elsewhere (Trujillo Bueno et al. 2001).
2. Necessary resources
In order to deal with FITS format files, the STScI developed – and maintains – the PyFITS111http://www.stsci.edu/resources/software_hardware/pyfits library. It is very easy to install and to use since it is very well documented. It allows for both the reading of such files, entirely or by slices, and for the generation of new FITS files; working with headers is also very easy. However its use implies that another library such as numarray or NumPy (see below) for handling multi-dimensional arrays is already available.
Indeed, for our purpose vector calculations with multi-dimensional arrays have been performed with the numarray library. With the latter comes along also a number of high-level numerical tools allowing for linear algebra, statistical analysis, fast fourier transforms, convolutions or interpolations for instance. However, since numarray will not be supported anymore after 2007, we wish to warn the reader to use instead, from now on, the NumPy222http://numpy.scipy.org/ package for such scientific calculations (see also Oliphant 2006). An on-line cookbook and very useful documentation can be found at http://www.scipy.org/.
Finally, for graphical output and figures saving, we used the matplotlib333http://matplotlib.sourceforge.net/ library for 2D plots. The default GUI is very convenient, allowing for a posteriori interactive work on the image, such as area selection and zooming. Unlike other software, it is also very easy with matplotlib to export images into the most useful formats. The quality of the output is perfectly suitable for publication (see e.g., the figures in Léger et al. 2007).
The freeware set we adopted was installed and used by us without any difficulties together with several Linux distributions as well as Mac OS X.
3. Capabilities and results
The raw data consisted in a time-sequence of 200 frames taken with the slit parallel to the solar limb at while modulating in time through a sequence of 4 independent polarization states in order to perform full-Stokes measurements.
Demodulation involving inverse or pseudo-inverse matrix calculation was very easily coded with the linear algebra package of NumPy. Our older routines (written in IDL) for aligning spectral lines were also very quickly re-coded using convolution with a finite width kernel for bisector search, and cubic spline or Fourier interpolations for shifting the profiles line by line. The adequate functions are in the fftpack and signal packages of SciPy.
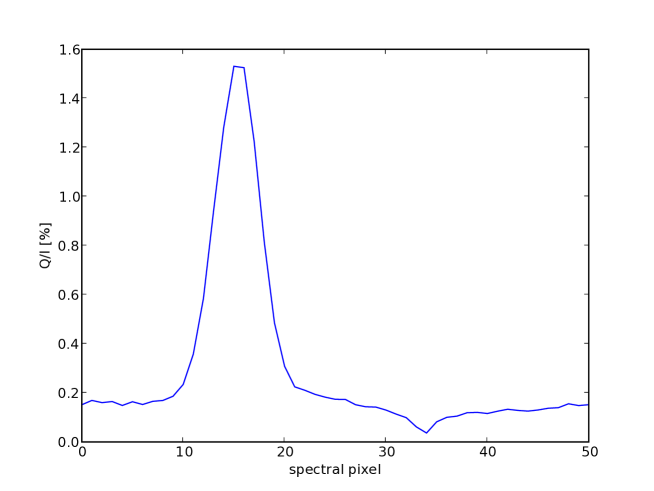
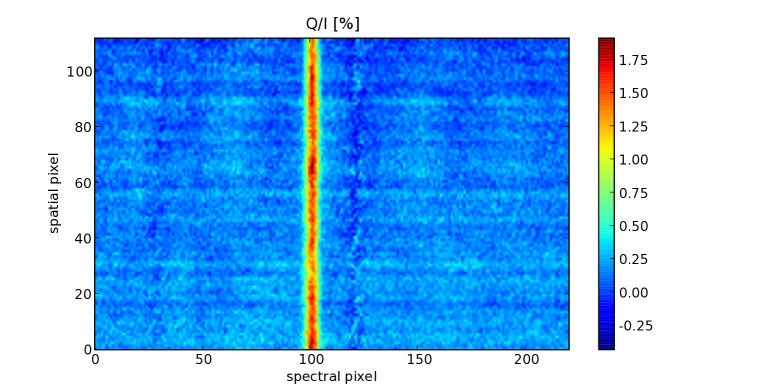
In Fig. 1, we plot the () image corresponding to the fractional linear polarization obtained by recombining the two polarized beams of the MTR@THéMIS (Paletou & Molodij 2001) taken at 460.7 nm. The strong peak in the Sr i spectral line corresponds to . Fig. 2 makes this reading easier since it is the mean profile obtained by averaging the polarized signal over the rows of the previous image.
It is in agreement with previous values obtained at very high polarimetric sensitivity with the ZIMPOL i polarimeter attached to the NSO/Kitt Peak MacMath-Pierce facility (Stenflo et al. 1997).
As with other data language, these packages permit to build one’s own collection of specific functions and, therefore makes it possible for any user to constitute its own library. The use of these public and private resources can be made both from scripts and/or interactively, using a command line.
One of the advantages of using Python is flexibility. Several other high-level plotting libraries exist such as DISLIN444http://www.mps.mpg.de/dislin/, or VTK555http://www.vtk.org/ for 3D graphics, for instance. And should one be unsatisfied of some of the functions of matplotlib, it would be very easy to use instead a number of functions from such other libraries.
4. Conclusions
The Python language and the numerous scientific and graphic libraries which are being developed for, already provide very valuable and powerful tools for data analysis in astrophysics. It is well supported by increasingly larger communities so, shifting to such freeware tools appear to us as both reasonable and economical (not to say legal too…) options yet.
Our experience with the reduction of THéMIS spectropolarimetric data since 1999 made rather fast, on the timescale of a few weeks only, the conversion of our former software written in IDL to the above-mentioned Python-based resources. We could reprocess without any difficulties whatsoever old data which lead to published results, and we now reduce our new data with those numerical tools. And finally, we definitely adopt a proselytizing attitude in favour of them.
Acknowledgments.
Rafael Manso is highly acknowledged for his constant interest during this quest for freeware solutions.
References
- Léger et al. (2007) Léger, L., Chevallier, L. & Paletou, F. 2007, A&A, 470, 1
- Oliphant (2006) Oliphant, T.E. 2006, Guide to NumPy (over-the-web: Trelgol Publishing)
- Paletou & Molodij (2001) Paletou, F., & Molodij, G. 2001, in ASP Conf. Ser. 236, Advanced Solar Polarimetry, ed. M. Sigwarth, (San Francisco: ASP), 9
- Stenflo et al. (1997) Stenflo, J.O., Bianda, M., Keller, C.U., & Solanki, S. 1997, A&A, 322, 985
- Trujillo Bueno et al. (2001) Trujillo Bueno, J., Collados, M., Paletou, F., & Molodij, G. 2001, in ASP Conf. Ser. 236, Advanced Solar Polarimetry, ed. M. Sigwarth, (San Francisco: ASP), 141
- van Rossum (1990) van Rossum, G. 1990, http://www.python.org/