Character and detectability of the dark ages and the epoch of reionization: the view from the simulations
Abstract:
Direct detection of the Dark Ages and the Epoch of Reionization (EOR) is among the main scientific objectives of all current and future low-frequency radio facilities. In this paper we summarize and discuss recent results, based on state-of-the-art numerical simulations, regarding the fundamental EOR properties and its observability with current and future radio arrays, like the Giant Metrewave Radio Telescope (GMRT), the Low Frequency Array (LOFAR), the 21-CM Array (21CMA), the Murchison Widefield Array (MWA) and the Square Kilometre Array (SKA). Results show that the optimal observational frequencies for statistical detection are 140-160 MHz. The signals are strongly non-Gaussian at late times. The correlation widths between 21-cm maps at neighbouring frequencies are short, of order 300-800 kHz, which should help with the cleaning of the strong foregrounds. Direct comparison of the resolutions and expected sensitivities of GMRT and MWA indicate that their optimal sensitivity ranges are similar, at scales , however, all else being equal the former should require shorter integration times due to its significantly larger collecting area.
1 Introduction
Direct detection of the Dark Ages and the Epoch of Reionization is among the main scientific objectives of all low-frequency radio facilities currently in operation (GMRT, 21CMA), under construction (LOFAR, MWA), or planned (SKA). These observations are quite complicated, due to the weak, noisy signals and exceedingly strong foregrounds at low radio frequencies (e.g. Mellema et al. 2006; Morales et al. 2006; Furlanetto et al. 2006; Iliev et al. 2007a, and references therein). The success of these experiments and the correct interpretation of their results will rely on our better understanding of the basic features and scales of reionization based on accurate modelling by detailed numerical simulations. Recent advances in numerical methods and computer hardware made such simulations possible (Iliev et al. 2006; Zahn et al. 2007). Here we summarize the fundamental EOR features and discuss its observability with current and future radio facilities.
2 Basic features of the process of reionization

The key results for the basic features of reionization could be summarized as follows (unless otherwise specified throughout this paper we use as an example simulation f250C with WMAP3 cosmology, see Iliev et al. (2007a) for the notation and details). Reionization starts early, with the formation of the first stars at and proceeds in an inside-out way, meaning that the high density regions are ionized first and the deepest voids - last. This is a natural consequence of the fact that high-redshift galaxies form inside the high density peaks of the density Gaussian random field and that they are rare, thus the gas collapsed fraction rises exponentially with time (Iliev et al. 2006). Furthermore, rare Gaussian peaks are inevitably very strongly clustered in space (e.g. Barkana & Loeb 2004), which leads to a highly-inhomogeneous and patchy large-scale reionization with complex geometry (Figure 1; Iliev et al. (2007a)). This geometry is strongly modulated by the long-wavelength density fluctuations and hence small-volume simulations, which do not include these large-scale fluctuations underestimate the source biasing and the reionization patchiness (Iliev et al. 2006; Mellema et al. 2006). The parameters describing the reionization process, namely source efficiencies (dependent on the stellar initial mass function, IMF, star formation efficiencies and escape fractions) and gas clumping, are still only weakly constrained. A wide range of reasonable reionization scenarios reproduce an overlap epoch, and integrated optical depth in agreement with current constraints (Iliev et al. 2007b).
The characteristic scales of the reionization patchiness (H II regions and neutral regions) are of order 5-20 comoving Mpc (at the observer this corresponds to 2’-10’ on the sky and 0.4-1.5 MHz in frequency). Although the high-redshift sources are typically very low-mass galaxies their strong clustering naturally leads to the formation of such large ionized patches (Furlanetto et al. 2004; Iliev et al. 2006; Furlanetto et al. 2006). These characteristic scales are directly reflected in many of the predicted reionization observables (Mellema et al. 2006; Iliev et al. 2007c; Doré et al. 2007; Iliev et al. 2007a, d). Reionization is strongly self-regulated through Jeans-mass filtering of the low-mass sources. This means that if low-mass sources were more efficient emitters of ionizing photons (e.g. due to top-heavy IMF) this yields more suppression of these same sources due to the higher Jeans mass in the H II regions. This suppression largely cancels the effect of the higher efficiency. The same holds true if low-mass sources were less efficient, instead (Iliev et al. 2007b).
3 Observability of reionization at redshifted 21-cm line
There are a number of different signatures of reionization to look for in the low-frequency radio sky. Here we give a brief overview of the main results and refer to the reader for further details on our simulations and results to Mellema et al. (2006) and Iliev et al. (2007a). For a recent review of the whole subject see Furlanetto et al. (2006).
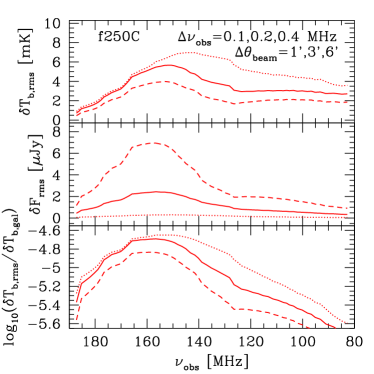
The first redshifted 21-cm detections will likely be statistical, measuring the small fluctuations in differential brightness temperature, of order few to tens of mK. These are introduced by a combination of density inhomogeneities due to cosmic structure formation and the reionization patchiness. An example of the evolution of the rms fluctuations of temperature, flux and as fraction of the dominant foreground (the Galactic synchrotron emission) at several different resolutions is shown in Figure 2. The beam sizes (in arcmin; using a compensated Gaussian beam) and the corresponding bandwidths (in MHz), are: (roughly as expected for the SKA compact core), (LOFAR) and (GMRT, MWA). The frequency at which the rms temperature fluctuations peak varies significantly with resolution, from MHz for low resolution (LOFAR, GMRT, MWA), to MHz for high one (SKA). The reason for this variation is that the peak position is determined by a combination of the level of the fluctuations of the underlying signal at different scales and how well do the scales probed by the beam match the characteristic patch scales. At early times/low frequencies the ionized bubbles are still small, thus more closely matching the high-resolution beam, which results in the peak moving towards earlier times. The signals at lower resolution peak roughly at the half-ionization point (by mass), when the patchiness is maximal and the characteristic patch size is large. Naturally, the peak height also varies, from a maximum of mK for high resolution down to mK for low resolution. In terms of the corresponding fluxes the peaks move to later times. Naturally, the signals are much stronger for the larger beams due to the higher area probed. These results imply that SKA (or an extended version of LOFAR), with its very high sensitivity and resolution, will be required in order to observe the earliest stages of reionization, the First Stars and the Cosmic Dark Ages.
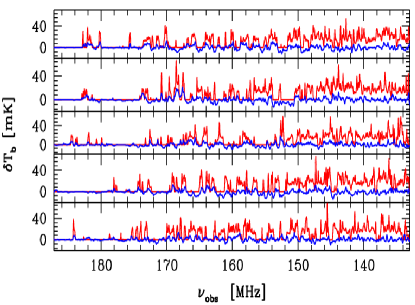

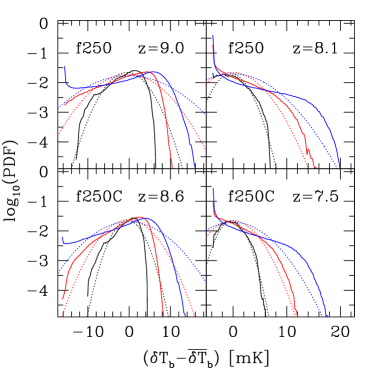
The 21-cm temperature fluctuations as fraction of the dominant foreground (Fig. 2, left, bottom panel) peak even later than the fluxes. This is a result of the broad peak of the 21-cm emission and the steep decline of the foreground signal at higher frequencies, which combine to push the peak to later times/higher frequencies, at up to 160-165 MHz. The signal is dominated by the strong foregrounds at all times, but up to an order of magnitude could be gained for observations aimed close to the peak ratio, as opposed to earlier or later times. An interesting feature of the differential brightness temperature fluctuations is that they are strongly non-Gaussian, particularly at early and late times. As a consequence, there are many more (up to an order of magnitude) bright emission peaks than a Gaussian distribution predicts (Figure 2, right), which should facilitate their detection. Such high emission peaks persist until fairly late, MHz (Fig. 3, left).
The 21-cm visibilities derived from our simulation data have been compared with the expected sensitivity of GMRT (Iliev et al. 2007a). This indicated that the best range for detection corresponds to wave numbers . At smaller scales (larger k) sensitivity declines steeply due to lack of resolution, while at larger scales are excluded by the foreground cleaning. Very recently similar calculations were conducted for the MWA array (Lidz et al. 2007). Direct comparison of the two results shows that the two experiments have optimal sensitivity over a similar range, but GMRT’s expected sensitivity is significantly higher, reflecting its larger collecting area (50,000 m2 vs. 7,000 m2), thus much shorter integration times should be required for a given sensitivity level.
Finally, in Fig. 3 (right) we show the correlation width of our 21-cm maps with its neighbours in frequency space (median over 3.5 MHz band) vs. redshift. Correlation widths are short, in the range 300-700 kHz, increasing to 400 kHz - 800 kHz with beam smoothing. The continuum foregrounds are correlated over much larger bandwidths, thus their correct removal should reveal the much shorter EOR correlation lengths with their characteristic behaviour with redshift. There are still some uncertainties in the predicted signals related to the not very well-known values of the ionizing source parameters and gas density fluctuations at small scales, as well as due to remaining uncertainties in the background cosmology parameters. Our predictions will improve as more observational data becomes available, providing better constraints for the theoretical models. For example, Ly- IGM opacity studies and the photoionization rate values at both indicate that reionization ends a little too early in the model discussed here (Iliev et al. 2007d), meaning that the ionizing sources should be somewhat less efficient than we assumed.
Acknowledgments This work was partially supported by NASA Astrophysical Theory Program grants NAG5-10825 and NNG04G177G to PRS.
References
- Barkana & Loeb (2004) Barkana R., Loeb A., 2004, ApJ, 609, 474
- Doré et al. (2007) Doré O., et al. 2007, Phys. Rev. D, 76, 043002
- Furlanetto et al. (2006) Furlanetto S. R., Oh S. P., Briggs F. H., 2006, Phys. Reports, 433, 181
- Furlanetto et al. (2004) Furlanetto S. R., Zaldarriaga M., Hernquist L., 2004, ApJ, 613, 1
- Iliev et al. (2007a) Iliev I. T., Mellema G., Pen U.-L., Bond J. R., Shapiro P. R., 2007a, MNRAS in press, (astro-ph/0702099)
- Iliev et al. (2006) Iliev I. T., Mellema G., Pen U.-L., Merz H., Shapiro P. R., Alvarez M. A., 2006, MNRAS, 369, 1625
- Iliev et al. (2007b) Iliev I. T., Mellema G., Shapiro P. R., Pen U.-L., 2007b, MNRAS, 376, 534
- Iliev et al. (2007c) Iliev I. T., Pen U.-L., Bond J. R., Mellema G., Shapiro P. R., 2007c, ApJ, 660, 933
- Iliev et al. (2007d) Iliev I. T., Shapiro P. R., McDonald P., Mellema G., Pen U.-L., 2007d, ArXiv e-prints (0711.2944)
- Lidz et al. (2007) Lidz A., Zahn O., McQuinn M., Zaldarriaga M., Hernquist L., 2007, ArXiv e-prints (0711.4373)
- Mellema et al. (2006) Mellema G., Iliev I. T., Pen U.-L., Shapiro P. R., 2006, MNRAS, 372, 679
- Morales et al. (2006) Morales M. F., Bowman J. D., Hewitt J. N., 2006, ApJ, 648, 767
- Zahn et al. (2007) Zahn O., et al. 2007, ApJ, 654, 12