123 \volnumber3 \hauthorM.Sachkov et al.
Spectroscopic study of pulsations in the atmosphere of roAp star 10 Aql
Abstract
We present the analysis of spectroscopic time-series observations of the roAp star 10 Aql. Observations were carried out in July 2006 with the UVES and SARG spectrographs simultaneously with the MOST mini-satellite photometry. All these data were analysed for radial velocity (RV) variations. About 150 lines out of the 1000 measured reveal clear pulsation signal. Frequency analysis of the spectroscopic data gives four frequencies. Three highest amplitude frequencies in spectroscopy coincide with the photometric ones. Phase-amplitude diagrams created for the lines of different elements/ions show that atmospheric pulsations may be represented by a superposition of the standing and running wave components, similar to other roAp stars. The highest RV amplitudes, 300–400 m s-1, were measured for Ce ii, Dy iii, Tb iii, and two unidentified lines at 5471, 5556 Å.
We discovered 0.4 period phase jump in the RV measurements across the Nd iii line profiles. It indicates the presence of the pulsation node in stellar atmosphere. The phase jump occurs at nearly the same atmospheric layers for the two main frequencies.
There is no rotational modulation in the average spectra for the 6 different nights we analysed.
keywords:
stars: atmospheres – stars: chemically peculiar – stars: magnetic fields – stars: oscillations1 Introduction
10 Aql (HD 176232) was detected as rapidly oscillating Ap (roAp) star by Heller & Kramer (1988) who found three periods of 11.6, 12.1 and 13.4 min. Kochukhov et al. (2002) detected radial velocity (RV) pulsations with amplitudes between 30 and 130 m s-1 and a period about 11.5 min. Later Hatzes & Mkrtichian (2005) confirmed RV variations and registered the highest RV amplitude 398 m s-1 for an unidentified line at 5471.40 Å. 10 Aql was chosen for contemporaneous spectroscopic observations with large ground based telescopes suited to obtain high time resolution, high spectral resolution, and high signal-to-noise ratio spectra simultaneously with high precision photometric observations with MOST, the Canadian photometric space telescope (Walker et al., 2003).
The main photometric results are published by Huber et al. (2007, these proceedings). Here we focus on the spectroscopic analysis and are using MOST data primarily for a comparison of the frequency analysis results.
2 Observations and data reduction
Our observations of 10 Aql were obtained in 2006 with the UVES spectrograph at the 8.2-m telescope UT2 (Kueyen), of the VLT at Paranal (Chile) on July 3, 9, 15, and 17, and with the high resolution spectrograph (SARG) at the 3.55-m Telescopio Nazionale Galileo (TNG) at the Observatorio del Roque de los Muchachos (La Palma, Spain) in July 14, 15, and 16. For a frequency analysis we used an additional data set obtained also during the MOST observing run with the UVES instrument on July 24 in the context of the observing programme 079.D-0567 (ESO Archive was used to extract these data).
Each UVES data set but the last one consists of 211 spectra. The total number of spectra observed in July 24 is 105. The peak signal-to-noise (S/N) ratio of individual spectra is up to 300, the spectral region covered is 4960–6990 Å (the wavelength coverage is complete, except for a 100 Å gap centred at 6000 Å), the resolving power is , the time resolution (exposure and read out) is 70 s. We were able to measure radial velocity amplitude from a single line with the accuracy up to 10 m s-1. All UVES spectra were reduced and normalized to the continuum level with a routine specially developed by D. Lyashko for a fast reduction of time-series observations (Tsymbal et al., 2003). The total number of 207 spectra were obtained with SARG in the 4572–7922 Å spectral range. Resolving power is 100 000, S/N is up to 150, and time resolution is 120 s. The SARG spectra were reduced using standard ESO-MIDAS software with the same main steps as described above.
3 Radial velocity measurements and frequency analysis

To perform a careful line identification and to choose lines for pulsation measurements we have synthesised the whole spectral region with the model atmosphere parameters =7550 K, =4.0 and abundances from Ryabchikova et al. (2000) and magnetic field modulus =1.5 kG (Kochukhov et al. 2002).
Both the centre-of-gravity and bisector methods were used for RV measurements. First, we measured practically all lines (about 2000) in July 03 observational set and detected about 150 lines that show pulsation signature. It is now well known that pulsational variability is more pronounced in the lines of rare-earth ions, especially those of Pr and Nd, which are strong and numerous in the roAp spectra (see, for example, Kochukhov & Ryabchikova, 2001). 10 Aql differs from others roAp stars in this context. REE lines are weak, REE abundances are lower than in other roAp stars, although the REE anomaly – a characteristics of roAp stars, is present. Many of the pulsating lines have equivalent width less than 5 mÅ, therefore the errors of velocity measurements are rather high. For RV analysis we used the lines with equivalent width larger than 5 mÅ. The maximum RV amplitude, as large as 420 m s-1, was detected in unidentified lines at 5471.41 Å and 5556.13 Å and in Dy iii 5730.34 Å line. which all have equivalent widths around 9–11 mÅ and residual depth around 6–7%.
Due to similarity of the pulsation patterns in the unidentified and Dy iii lines, one may suppose that they should belong to the same atomic species. Strong Nd iii and Pr iii lines, that usually exhibit largest amplitudes in roAp stars show lowest amplitudes in 10 Aql (probably due the existence of nodal zone, as will be shown below). Nd ii and Pr ii lines are very weak. Hence, the blending problem in this star becomes more acute. Even slight blending results in abrupt decrease of the amplitude. Therefore, for the final amplitude and phase analysis only 70 cleanest lines were chosen.
We performed frequency analysis of our measurements by applying the standard discrete Fourier transformation (DFT) to the RV data. The total time coverage of the spectroscopic data is about 25 hours. The period corresponding to the highest pulsation amplitude was improved by the sine-wave least-square fitting of the RV data with pulsation period, amplitude, and phase treated as free parameters. This fit was removed from the data and then Fourier analysis was applied to the residuals. This procedure was repeated for all frequencies with the S/N above 5 in the power spectrum. The primary frequency (f1) was found at 119.69 c/d, which corresponds to a 1-day alias of the frequency seen in simultaneous MOST photometry. The second signal (f2) is at 125.09 c/d and the third frequency (f3) is at 123.30 c/d. All three frequencies appear in RV data for most pulsating lines. No clear signal can be found in the data after pre-whitening of the three frequencies, although in the residuals for several lines some signal appears near 117–118 c/d and 126–127 c/d. But this signal has S/N2. Figure 1 shows an amplitude spectrum for the Tb iii 5505.370 Å line; the other panels show the next prewhitening steps.
The MOST photometric observations give the same frequencies. The only difference is that the frequency f2 has the highest amplitude in the MOST data and f1 is the second one (Huber et al. 2007). This can be explained by the different time coverage of the spectroscopic data compared to continuous photometric set. Making a frequency analysis of the part of photometric data taken at the times of spectroscopic monitoring one obtains f1 with the highest amplitude in photometric data, too (Huber, private communication).
We have to stress the importance of simultaneous precise photometry for the spectroscopic time-series study, in particular to avoid alias problems in frequency analysis. Moreover, one relatively short spectroscopic set, that is usually no longer than 2–4 hours, does not allow one to resolve close frequencies. Wrong conclusions can be made from amplitude modulations that caused just by the beating effect. In the case of 10 Aql, a superposition of the three close frequencies fully explains the observed amplitude modulation, which is illustrated in Fig. 2 where RV variations of the Tb iii 5505.370 Å line are presented for UVES data (from top to bottom for nights July 3, 9, 15, 17, 24; the reference time point for each data set is the HJD time of the first observation). The solid line shows sinusoidal fit including all three frequencies.
![[Uncaptioned image]](/html/0712.1340/assets/x2.png) Figure 2: The RV variations of the Tb iii 5505.370 Å line.
Figure 2: The RV variations of the Tb iii 5505.370 Å line.
4 Pulsational analysis
We did not found any evidence of the rotational modulation during a month of our spectroscopic observations. The average spectra in all sets agree within better than 0.5% which means that rotation period should be an order of several months at least.
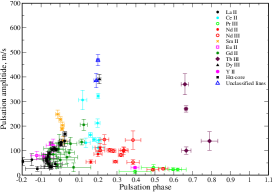
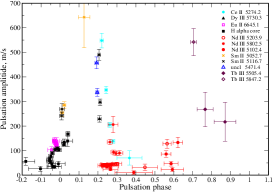
Following Ryabchikova et al. (2007a), we analysed the amplitude-phase diagrams and interpreted observations in terms of pulsational wave propagation. The pulsational behaviour of 10 Aql is quite similar to the one found in other roAp stars: pulsation appears in the layers where La and Eu are concentrated, then goes through the layers where H-core is formed, reaches maximum of RV and then the amplitude decreases (see Ryabchikova et al. 2007b). At the same time, the RV maximum is attained in Ce ii and Dy iii lines and not in Nd ii Nd iii Pr iii lines, as it is observed in most other roAp stars. In the layers where Nd and Pr lines are formed pulsation amplitude falls practically to zero, and this is accompanied by the rapid phase change. When RV amplitude increases again in Tb iii lines, the phase changes by 0.4 (left panel in Fig. 3). We attribute this phenomenon to the presence of a node. Similar amplitude-phase diagrams were obtained for the f2 frequency. The phase-amplitude diagrams are also similar for all 4 nights of our UVES observations.
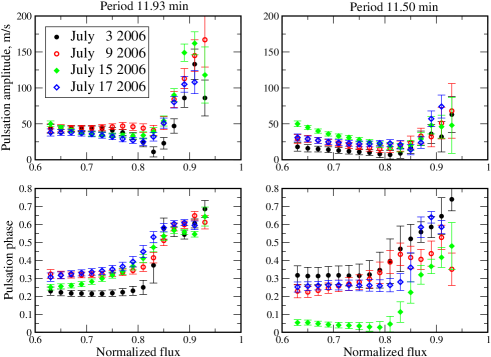
The same picture was derived from the bisector measurements of individual lines (right panel in Fig. 3). As it was mentioned earlier, the REE lines usually showing the highest pulsation signal are weak in 10 Aql. Fortunately, there is sufficiently deep line, Nd iii 5102.435 Å, suitable for precise bisector measurements. Although the centre-of-gravity RV amplitude is very small (30–40 m s-1), the bisector amplitude changes across the line profile with the minimum around 0.83 of the normalized flux. RV amplitude change is accompanied by the phase jump. We found the same behaviour in all 4 nights and in both of the highest highest amplitude frequencies f1 and f2. Fig. 4 shows bisector measurements for the Nd iii 5102.435 Å line. Thus, 10 Aql is the second roAp star after 33 Lib (Mkrtichian et al. 2003) which shows direct evidence of an atmospheric node.
Acknowledgements.
This work was supported by the RFBI (grant 06-02-16110a), by the Swedish Kungliga Fysiografiska Sällskapet, by Royal Academy of Sciences (grant No. 11630102), and by Austrian Science Fund (FWF-P17580).References
- \articleHatzes, A. P., & Mkrtichian, D. E.2005\aaa430279 \articleHeller, C.H., & Kramer, K.S.1988PASP100583 \articleKochukhov, O., Landstreet, J. D., Ryabchikova, T., Weiss, W. W., & Kupka, F.2002MNRAS337L1 \articleKochukhov, O., & Ryabchikova, T.2001\aaa374615 \articleMkrtichian, D. E., Hatzes, A. P., & Kanaan, A.2003MNRAS345781 \articleRyabchikova, T., Sachkov, M., Weiss, W. W., et al.2007a\aaa4621103 \articleRyabchikova, T., Sachkov, M., Kochukhov, O., & Lyashko, D.2007b\aaa473907 \articleRyabchikova, T.A., Savanov, I.S., A.P. Hatzes A.P., Weiss, W.W., & Handler G.2000\aaa357981 \inproceedingsTsymbal, V., Lyashko, D., & Weiss, W. W.2003Modelling of Stellar Atmiiospheres, IAU Symp. No. 210N. Piskunov W.W.Weiss D.F. GrayASPE49 \articleWalker, G., Matthews, G., Kuschnig, R., et al.2003 PASP 115 1023 \inproceedingsHuber, D., Saio, H., Gruberbauer, M., et al. 2007 CP#AP Workshop Zverko This proceedings
- [1]