11email: leyder@astro.ulg.ac.be 22institutetext: INTEGRAL Science Data Centre, Universit de Gen ve, Chemin d’ cogia 16, CH–1290 Versoix, Switzerland 33institutetext: Observatoire de Gen ve, Universit de Gen ve, Chemin des Maillettes 51, CH–1290 Sauverny, Switzerland 44institutetext: Centro de Astrof sica da Universidade do Porto, Rua das Estrelas, PT–4150-762 Porto, Portugal 55institutetext: INAF — Istituto di Astrofisica Spaziale e Fisica Cosmica di Bologna, Via Gobetti 101, I–40129 Bologna, Italy (formerly IASF/CNR, Bologna)
Hard X-ray flares in IGR~J08408–4503 unveil clumpy stellar winds
Abstract
Context. A 1000-s flare from a new hard X-ray transient, IGR~J08408–4503, was observed by INTEGRAL on May 15, 2006 during the real-time routine monitoring of IBIS/ISGRI images performed at the INTEGRAL Science Data Centre. The flare, detected during a single one-hour long pointing, peaked at 250 mCrab in the 20–40 keV energy range.
Aims. Multi-wavelength observations, combining high-energy and optical data, were used to unveil the nature of IGR~J08408–4503.
Methods. A search in all INTEGRAL public data for other bursts from IGR~J08408–4503 was performed, and the detailed analysis of another major flare is presented. The results of two Swift Target of Opportunity observations are also described. Finally, a study of the likely optical counterpart, HD~74 194, is provided.
Results. IGR~J08408–4503 is very likely a supergiant fast X-ray transient (SFXT) system. The system parameters indicate that the X-ray flares are probably related to the accretion of wind clumps on a compact object orbiting about cm from the supergiant HD~74 194. The clump mass loss rate is of the order of yr-1.
Conclusions. Hard X-ray flares from SFXTs allow to probe the stellar winds of massive stars, and could possibly be associated with wind perturbations due to line-driven instabilities.
Key Words.:
gamma rays: observations – stars: supergiants – X-rays: individuals: IGR~J08408–4503 – stars: early-type – instabilities1 Introduction
A new hard X-ray transient, IGR~J08408–4503, was discovered by INTEGRAL on May 15, 2006 during the real-time routine monitoring of IBIS/ISGRI 20–40 keV images performed at the INTEGRAL Science Data Centre (ISDC). It was detected during a one-hour long pointing, and further analysis of the lightcurve with a 100-s binning showed that the source flared for 1000 s starting at 2006-05-15T18:25:33, with a peak flux of 250 mCrab in the 20–40 keV energy range (Götz et al. 2006). The source was also detected by the JEM-X instrument, providing a position of : RA(J2000) = , Dec(J2000) = ( at 90% confidence) (Brandt et al. 2006).
Analysis of the public INTEGRAL archive shows that there was at least another outburst from this source on July 1, 2003 (Mereghetti et al. 2006). A detailed analysis of this first flare is presented in Sect. 2.1.
A first Swift target of opportunity observation was carried out on IGR~J08408–4503 on May 22, 2006 (Kennea & Campana 2006). The XRT observation (in photon counting mode) revealed the presence of a faint source in the JEM-X error box at the position : RA(J2000) = , Dec(J2000) = (with an error radius of at 90% confidence). Sect. 2.2 gives more details about this observation and a following one.
Preliminary studies of ESO archival optical spectra of the star HD~74 194, which is lying at the Swift/XRT position, were performed by Masetti et al. (2006), who pointed out that this star is likely associated with IGR~J08408–4503, on the basis of the detection of H in emission. A deeper analysis of these results is presented in Sect. 3.
Finally, Sect. 4 provides a discussion on the nature of this new source, and derives likely system parameters based on the observations.
2 The high-energy source
2.1 INTEGRAL observations
All available public INTEGRAL (Winkler et al. 2003) pointings less than 10° away from the source position were analysed to look for other flares from the source. There are two major periods during which the source was frequently observed, summarized in Table 1. The data were analyzed using OSA111The offline scientific analysis (OSA) software is available from the ISDC website : http://isdc.unige.ch, version 5.1. A lightcurve at the source position was extracted, with a binning of 100 s.
| Rev. | Period [MJD] | Date |
|---|---|---|
| 81–88 | 52 803–52 827 | 12 Jun–6 Jul 2003 |
| 137–141 | 52 970–52 984 | 27 Nov–11 Dec 2003 |
The detailed study of this lightcurve showed that there is only one significant flare, around 2003-07-01T20:03:02. A zoom on the ISGRI and JEM-X lightcurves around this flare is shown in Fig. 1, together with the hardness ratio. The source was significantly detected with ISGRI for 12.6 ks with a maximum flux reaching 11.7 counts s-1 in the 20–60 keV energy band in the 100-s bin centered around 2003-07-01T20:03:02.552 (in pointing 00870035). Meanwhile, the JEM-X flux peaked at 11.4 counts s-1 in the 3–35 keV energy band.
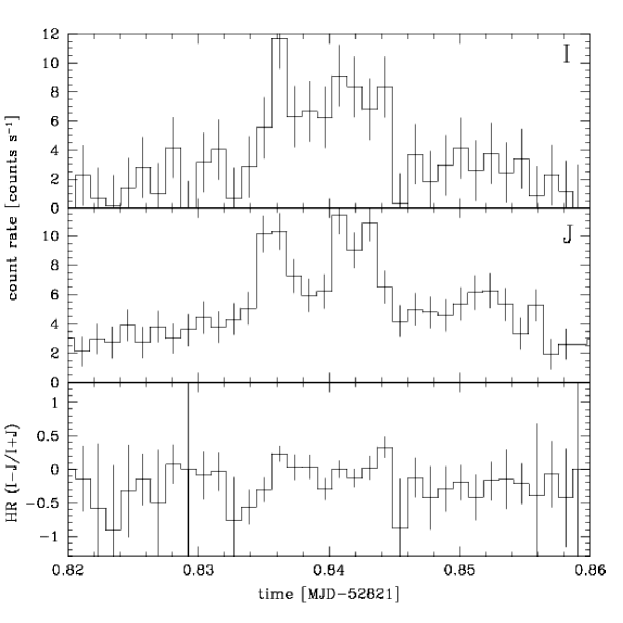
The peak 2–10 keV X-ray flux could be estimated as erg s-1 cm-2, assuming the spectral model described below (wabs*comptt). The average flux during the 1000-s flare is erg s-1 cm-2.
Mosaicking 6 pointings surrounding the main flare (3 before and 3 after, i.e. excluding the pointing with the flare itself) shows that IGR~J08408–4503 is also clearly detected around the main flare, from 2003-07-01T16:40:00 until 23:35:13.
A mosaic of all pointing images containing the source (except 8 pointings surrounding the flare) was produced and gave a 5- upper limit for the flux in quiescence of 0.056 counts s-1 in the 23–40 keV energy range, for an effective exposure time of 2.45 Ms. The 2–10 keV upper limit can be estimated as erg s-1 cm-2.
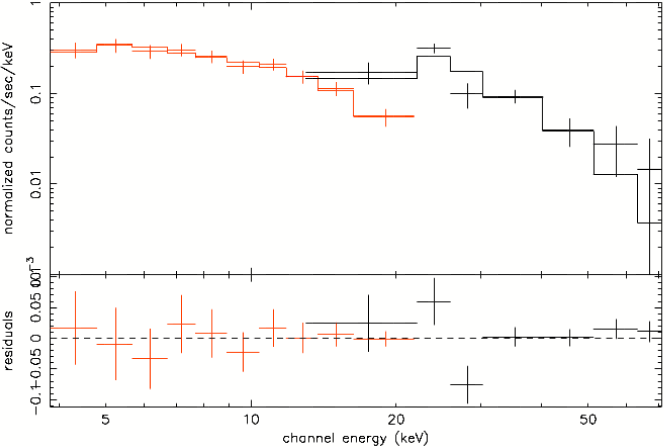
The JEM-X and ISGRI average spectra of IGR~J08408–4503 were extracted from the pointing containing the flare, and are shown in Fig. 2. The spectrum was fitted222For all fits, a constant is added to allow for normalisation between JEM-X and ISGRI, and a wabs is added to take into account the hydrogen column, . with xspec using a simple absorbed powerlaw, but no good fit could be obtained with (for 13 degrees of freedom). Then, two models exhibiting a spectral break were used : a broken powerlaw (bknpower) and a comptonisation model (comptt). Both models give much better results, with the for the comptt model decreasing to 1.0 (for 12 degrees of freedom). Applying an F-test shows that there is a 99.3% probability that the comptt model is better than the simple powerlaw, implying that a spectral break is needed. The bknpower model suggests a break at an energy of keV. The comptt model gives a plasma temperature of keV, and a plasma optical depth of . The intercalibration constant between ISGRI and JEM-X is in the case of the powerlaw model, and for the comptt model.
Only an upper limit on the value of the hydrogen column can be obtained : the 2- upper limit on is cm-2.
2.2 Swift/XRT observations
Two Swift (Gehrels et al. 2004) Target of Opportunity observations of IGR~J08408–4503 were performed : they consisted of a nominal 3.6 and 4.0 ks exposure in photon counting mode starting at 2006-05-22T10:41:01 and at 2006-07-29T00:15:00. The data were analysed with version 2.3 of the Swift software333The Swift software is available from the GSFC website : http://swift.gsfc.nasa.gov/.
The best position for IGR~J08408–4503 (derived from the second observation) is : RA(J2000) = , Dec(J2000) = (with an uncertainty of at 90% confidence level), consistent with the results of Kennea & Campana (2006).
The source is very faint, with only 22 counts in total (resp. 20 for the second observation), and counts after background subtraction (resp. ). Assuming the spectral model derived from INTEGRAL (wabs*comptt), the flux measured by Swift can be estimated as erg s-1 cm-2 in the 2–10 keV energy band (resp. ). However, this model is not compatible with the fact that all (but one) events detected by Swift have an energy smaller than 1.5 keV. Assuming a soft thermal model, one find that these 22 counts are compatible with a 0.5–2 keV flux of erg s-1 cm-2.
3 Optical counterpart
3.1 Imaging
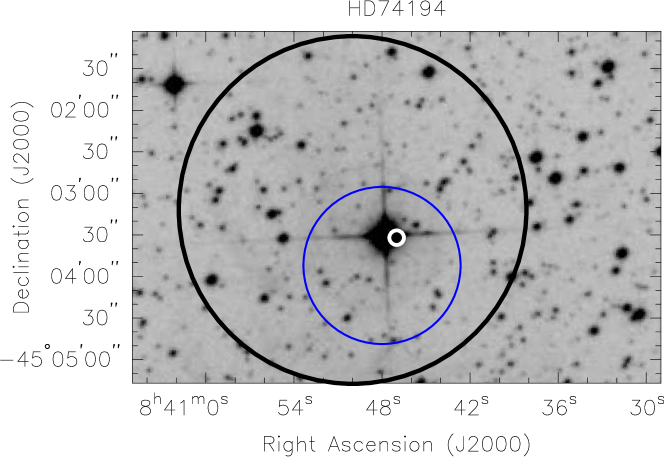
A DSS-II red image of the field is shown in Fig. 3. In the 2MASS catalogue, there is only one star in the Swift error circle : HD~74 194, which has a position of : RA(J2000) = , Dec(J2000) = . The next closest source is nearly 10” away from IGR~J08408–4503. However, HD~74 194 is so bright that we cannot exclude the presence of other faint sources in the error circle. Therefore, we cannot conclusively associate IGR~J08408–4503 with HD~74 194 by positional arguments alone.
3.2 Spectroscopy
Spectroscopy of the star HD~74 194 was secured under programme 70.C-0396(A) on January 9, 2003 at the ESO 3.6m telescope equipped with EFOSC, which uses a (22 binned) 20602060 pixel Loral/Lesser CCD. Two 5-s spectra were acquired starting at 08:38:39 UT; grism #12 and a slit width of were used, providing a 6 000–10 000 Å nominal spectral coverage. The use of this setup guaranteed a final dispersion of 4.2 Å/pix.
After cosmic-ray rejection, the spectra were reduced, background subtracted and optimally extracted (Horne 1986) using IRAF444The image reduction and analysis facility (IRAF) software is available from the NOAO website : http://iraf.noao.edu/. Wavelength calibration was performed using He-Ar lamps. The spectra were then simply normalized to their continuum because no spectroscopic standard was available for the star HD~74 194 in the ESO archive, and were stacked together to increase the S/N ratio. The wavelength calibration uncertainty was 0.5 Å for all cases; this was checked using the positions of background night sky lines.
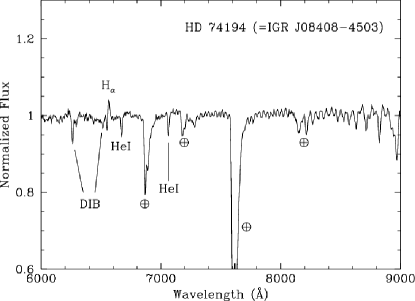
The analysis of the optical spectrum of HD~74 194 (Fig. 4) shows the H line in emission (with EW = 1.00.1 Å) with a P-Cyg profile; besides, He i absorption lines at 6 675 and 7 065 Å and the diffuse interstellar bands (DIBs) at 6 280 Å and 6 515 Å are also detected.
The P-Cyg profile indicates an escape velocity of km s-1. Assuming that (Groenewegen et al. 1989), this is consistent with the value of km s-1 derived from IUE spectra by Lamers et al. (1995) and Snow et al. (1994). We also analysed the archival HST/GHRS spectrum of HD~74 194 around the O iv and Si iv lines, and found maximum velocities of km s-1 for both lines (see Fig. 4).

The positional consistency of this star with the quiescent emission of IGR~J08408–4503 suggests that HD~74 194 is an O-type supergiant fast X-ray transient.
The fact that HD~74 194 is of spectral type O8.5 Ib (Walborn 1973) implies MV = 6.2 and = 0.285 (Lang 1992). Using the observed = 7.55 and = +0.22 for this star (Drilling 1991), we obtain a color excess of = +0.505 and a distance kpc. This distance estimate is in agreement with that obtained from the Hipparcos satellite (Perryman et al. 1997), which measured an annual parallax milliarcsec for HD~74 194; this value implies a distance kpc (with a large error) to this source. We also estimated the color excess from IUE archival spectra (datasets LWP2966[1-2] and SWP5302[3-5]), by calculating the reddening necessary to compensate for the 2200 Å dust extinction feature, and found = +0.63, similar to the value derived above when taking into account the uncertainty on the extinction law. The color excess is less than half of the value of +1.66 obtained from infrared maps (Schlegel et al. 1998), thereby supporting a relatively close distance to Earth. This distance places HD~74 194 in the Carina Galactic spiral arm tangent (see, e.g., Leitch & Vasisht 1998), and in this direction, the interstellar absorption column density can be estimated as cm-2.
4 Discussion
Fast hard X-ray outbursts are mostly known in three broad classes of objects discussed below : Be transients, thermonuclear flashes, and supergiant fast X-ray transient (SFXT) systems.
4.1 Be transient systems
The outbursts exhibited by most Be transient systems are of 2 different origins : they are either related to the orbital period of the neutron star reaching the disk of the Be star; or they are large, seemingly random, and last a few days.
Few Be HMXBs are known to show fast and occasional outbursts. An example is A0538–66, which is probably a super-Eddington X-ray source (Skinner et al. 1982).
The flares of IGR~J08408–4503 are probably not of this type, because the timescales are completely different, its flaring luminosity is less than 1% of the Eddington luminosity, and its optical counter-part is not a Be-type star.
4.2 Thermonuclear flashes
Alternatively, thermonuclear flashes – similar to those seen in LMXBs – could be envisioned. But in HMXBs, the presence of a magnetic field funnels the accretion stream onto the magnetic polar caps of the neutron star (NS), thus preventing the formation of a boundary layer in which H and He could burn. Moreover, these type I flashes are shorter ( 30 s), have a much higher peak luminosity, and are much softer than observed in IGR~J08408–4503 (Remillard et al. 2006). Therefore, the origin of the flares in this case is most likely not linked to thermonuclear flashes.
4.3 Supergiant Fast X-ray Transients
IGR~J08408–4503 shares many characteristics with other SFXT systems discovered by INTEGRAL (e.g. Sguera et al. 2006) :
-
•
two X-ray flares have been observed from IGR~J08408–4503 in 12 weeks of cumulated INTEGRAL observations;
-
•
the bright flares are fast, with a typical duration555The total duration of the first flare of IGR~J08408–4503 observed by INTEGRAL was at least 6 hours. of 1000 s;
-
•
the X-ray luminosity during the 1000 s flare is erg s-1, while the quiescence luminosity is lower than erg s-1 and has been as low as erg s-1 during the Swift/XRT observation;
-
•
during flares, the hard X-ray spectrum features a cutoff at keV that is typical of accreting pulsars;
-
•
the optical counterpart is a supergiant OB star.
It is impossible to formally exclude that the X-ray source may be unrelated to the O star. However, for the rest of the discussion, the many similarities between IGR~J08408–4503 and other SFXTs will be taken as an evidence for its association with HD~74 194.
The typical X-ray luminosity of O-type stars ranges from to erg s-1, so it is likely that the X-ray luminosity observed in quiescence ( erg s-1) is emitted either by the star itself (through shocks in its wind), or by the interaction of its wind with the interstellar medium. The very soft spectrum observed in quiescence also does not show any evidence for accretion.
HD~74 194 features micro-variability with a period of 7.8 days (Koen & Eyer 2002). Such a micro-variability has been associated with stellar spots, or with density waves in the atmosphere (van Genderen et al. 1989). Nevertheless, the variability amplitude of 5% does not seem to be related to the observed X-ray variability and is too large to be the signature of an orbital period. The high luminosity X-ray flares, with their hard spectra, are to be explained by another mechanism.
The stellar wind parameters of HD~74 194, in particular its mass loss rate yr-1 (Krtička & Kubát 2001) and its terminal velocity km s-1 (Lamers et al. 1995), can be used as input for different models.
If a NS orbits within the wind of an O-type star, an X-ray luminosity of erg s-1 (where is the orbital radius in cm) is expected, which is much higher than observed on average in the present case, unless is larger than cm.
The flip-flop instability of wind accretion flow (Benensohn et al. 1997) cannot account for the observed variability : it predicts variations of the accretion rate by a factor up to 10 only, i.e. much smaller than observed, and on a time scale s (where is the effective accretion radius), much too short to explain the observed flare frequency.
The propeller mechanism (Illarionov & Sunyaev 1975) could also be envisioned to explain the outbursts, supposing that during quiescence, the NS is rotating fast enough to centrifugally inhibit the accretion of matter from the O-type companion. Outbursts would then be observed when a change occurs, switching off the propeller mechanism for a short period. Considering the observed burst duration, the changes cannot be driven by rotation. It is also very unlikely that the ignition and stop of accretion could be driven by a sudden change of the magnetic field and back within a few ks.
The most likely source for the observed flaring behavior is therefore a sudden change of the density of the gas trapped within the accretion radius : this is expected to happen if the stellar wind is clumpy.
Assuming that the flares are the signature of the accretion of wind clumps on a compact object orbiting at cm, and that the flare duration is related to the clump size, the clump column density can be evaluated as cm-2. Assuming a spherical shape for the clumps, their typical mass can be estimated as g. The flare frequency can then be used to estimate the stellar mass loss rate in the form of clumps as yr-1 (for a spherical geometry).
The density of the clumps ( g cm-3) is only slightly above the peak densities predicted by hydrodynamic simulations of growing wind perturbations induced by line-driven instabilities (see Fig. 6 in Feldmeier et al. 1997). The predicted density ratio of – between the dense and hot phases of the wind at a given radius may explain the large variations between the flaring and quiescent luminosities.
The wind clumps are massive enough to generate the outbursts while being rare enough to explain their low frequency. Using the observed luminosities and flare frequencies, the clump mass loss rate and density are highly dependent on the orbital radius considered. If this simple model is correct, the flare frequency6661 flare every 6 weeks of cumulated INTEGRAL observations. constrains this radius to be of the order of cm. The main difference between SFXTs and persistent super-giant HMXBs would then be their different orbital radius : a few in persistent systems, but tens of in SFXTs.
Acknowledgements.
This research has made use of observations from Swift, INTEGRAL, the ESO/ST-ECF Science Archive, HST, 2MASS, of SIMBAD and of IRAF. NM acknowledges the ASI financial support via grant 1/023/05/0. RW thanks Lydia Oskinova for fruitful discussions. JCL acknowledges support through the XMM-INTEGRAL PRODEX project and IAP contract P5/36.References
- Benensohn et al. (1997) Benensohn, J. S., Lamb, D. Q., & Taam, R. E. 1997, ApJ, 478, 723
- Brandt et al. (2006) Brandt, S., Budtz-Joergensen, C., Lund, N., et al. 2006, ATel 817
- Drilling (1991) Drilling, J. S. 1991, ApJS, 76, 1033
- Feldmeier et al. (1997) Feldmeier, A., Puls, J., & Pauldrach, A. W. A. 1997, A&A, 322, 878
- Gehrels et al. (2004) Gehrels, N., Chincarini, G., Giommi, P., et al. 2004, ApJ, 611, 1005
- Götz et al. (2006) Götz, D., Schanne, S., Rodriguez, J., et al. 2006, ATel 813
- Groenewegen et al. (1989) Groenewegen, M. A. T., Lamers, H. J. G. L. M., & Pauldrach, A. W. A. 1989, A&A, 221, 78
- Horne (1986) Horne, K. 1986, PASP, 98, 609
- Illarionov & Sunyaev (1975) Illarionov, A. F. & Sunyaev, R. A. 1975, A&A, 39, 185
- Kennea & Campana (2006) Kennea, J. A. & Campana, S. 2006, ATel 818
- Koen & Eyer (2002) Koen, C. & Eyer, L. 2002, MNRAS, 331, 45
- Krtička & Kubát (2001) Krtička, J. & Kubát, J. 2001, A&A, 377, 175
- Lamers et al. (1995) Lamers, H. J. G. L. M., Snow, T. P., & Lindholm, D. M. 1995, ApJ, 455, 269
- Lang (1992) Lang, K. R. 1992, Astrophysical Data I. Planets and Stars. (937 pp. 33 figs.. Springer-Verlag Berlin Heidelberg New York)
- Leitch & Vasisht (1998) Leitch, E. M. & Vasisht, G. 1998, New Astronomy, 3, 51
- Masetti et al. (2006) Masetti, N., Bassani, L., Bazzano, A., et al. 2006, ATel 815
- Mereghetti et al. (2006) Mereghetti, S., Sidoli, L., Paizis, A., & Götz, D. 2006, ATel 814
- Perryman et al. (1997) Perryman, M. A. C., Lindegren, L., Kovalevsky, J., et al. 1997, A&A, 323, L49
- Remillard et al. (2006) Remillard, R. A., Lin, D., Cooper, R. L., & Narayan, R. 2006, ApJ, 646, 407
- Schlegel et al. (1998) Schlegel, D. J., Finkbeiner, D. P., & Davis, M. 1998, ApJ, 500, 525
- Sguera et al. (2006) Sguera, V., Bazzano, A., Bird, A. J., et al. 2006, ApJ, 646, 452
- Skinner et al. (1982) Skinner, G. K., Bedford, D. K., Elsner, R. F., et al. 1982, Nature, 297, 568
- Snow et al. (1994) Snow, T. P., Lamers, H. J. G. L. M., Lindholm, D. M., & Odell, A. P. 1994, ApJS, 95, 163
- van Genderen et al. (1989) van Genderen, A. M., Bovenschen, H., Engelsman, E. C., et al. 1989, A&AS, 79, 263
- Walborn (1973) Walborn, N. R. 1973, AJ, 78, 1067
- Winkler et al. (2003) Winkler, C., Courvoisier, T. J.-L., Di Cocco, G., et al. 2003, A&A, 411, L1