The globular cluster NGC 6388: -Newton and observations
Abstract
Context. By studying the optical brightness surface density of the globular cluster NGC 6388, it has been recently proposed that it harbors a central intermediate-mass black hole with mass M⊙.
Aims. We expect that the compact object in the center of NGC 6388 emits radiation in the -ray band as a consequence of the accretion from the surrounding matter. We searched for -Newton and observations towards NGC 6388 to test this hypothesis.
Methods. We determine both the hardness ratios and luminosity with a minimum set of assumptions for each of the identified field sources.
Results. The satellite disentangles several point-like -ray sources, probably low mass -ray binaries, well within the core radius of the globular cluster. However, three of them, coinciding with the cluster center of gravity, remain unresolved. Their total luminosity is erg s-1. If one of these sources is the -ray counterpart of the intermediate-mass black hole in NGC 6388, the corresponding upper limit on the accretion efficiency, with respect to the Eddington luminosity, is . This measurement could be tightened if moderately deep radio observations of the field were performed.
Key Words.:
(Galaxy:) globular clusters: general – (Galaxy:) globular clusters: individual: NGC 63881 Introduction
Over the last few years, several pieces of evidence have been accumulated pointing to the presence of an intermediate-mass black hole (hereafter IMBH) with mass M⊙ in a globular cluster. The first evidence comes from the extrapolation to globular clusters of the relation found for super massive black holes in galactic nuclei (for details see Magorrian et al. 1998), which leads to the prediction of the existence of IMBHs.
The second hint is related to the discovery of the so called ULXs, i.e. ultra-luminous, compact -ray sources (with luminosity greater than erg s-1), which are believed to be IMBHs rather than binaries containing a normal stellar mass black hole (Miller & Colbert 2003).
More indirect evidence of the existence of IMBHs comes from the study of the central velocity dispersion of stars in specific globular clusters. For example, by using the velocity dispersion measurements, Gerssen et al. (2002, 2003), and Gebhardt et al. (2002) (but see also Pooley & Rappaport 2006) proposed that IMBHs may exist in M15 and G1 (an M31 globular cluster) with masses about - M⊙ 111 The observed brightness and the velocity dispersion profiles of the G1 (Baumgardt et al. 2003) and M15 (Baumgardt et al. 2005a) globular clusters can be well fitted by usual evolutionary King models. When the mass segregation effect is taken into account, a sharp increase in the mass-to-light ratio towards the cluster core is found, thus avoiding the necessity of a central IMBH.
Objects of the IMBH size are predicted by detailed N-body simulations (see e.g. Portegies Zwart et al. 2004), according to which an IMBH forms as a consequence of merging of massive stars. Furthermore, at least for the cases of M 15 and 47 Tucane, the precise measurements of and of four millisecond pulsars (with negative ) has allowed De Paolis et al. (1996) to put rather stringent upper limits to the mass of the central black hole of M⊙.
In addition to the previous evidence, it is also expected that globular clusters with a central IMBH are characterized by a cusp in the inner stellar density profile (i.e. ), so that the projected density profile, as well as the surface brightness, should also have a cusp with slope . As shown by Miocchi (2007), the globular clusters that most likely harbor an IMBH are those having the projected photometry well fitted by a King profile, except in the central part where a power law deviation () from a flat behavior is expected. However, as pointed out by Baumgardt et al. (2003, 2005a), a similar behavior is also expected in a constant core density King profile () when the mass segregation effect of stellar remnants is considered. This explanation, however, is uncertain because it depends on the assumption that all the neutron stars and/or stellar mass black holes are retained in the cluster so that the existence of a central IMBH cannot be completely ruled out (see Gebhardt et al. 2005). On the other hand, the errors with which the slopes of central densities can be determined are of the order (Noyola & Gebhardt 2006), so that surface density profiles do not give clear evidence of the existence of IMBH in globular clusters, thus requiring observations in different bands.
Among all the known globular clusters in our Galaxy, NGC 6388 is one of the best candidates to host an IMBH (Baumgardt et al. 2005b). NGC 6388 is a globular cluster at distance kpc (with center at coordinates A.R., DEC) and with an estimated mass of M⊙ (Lanzoni et al. 2007). By using a combination of high resolution (HST ACS-HCR, ACS-WCS and WFPC2) and wild-field (ESO-WFI) observations, Lanzoni et al. (2007) derived the center of gravity, the projected density profile and the central surface brightness profile of NGC 6388. While the overall projected profile is well fitted by a King model (with concentration parameter and core radius ), a significant power law (with slope ) deviation from a flat core behavior has been detected within . This was interpreted as the signature of the existence of an IMBH with mass M⊙ at the center of NGC 6388. We expect that the central IMBH emits significant radiation in the -ray band as a consequence of the accretion of the surrounding matter. Thus, we searched for both -Newton and observations towards the globular cluster NGC 6388.
The paper is structured as follows: In Sect. 2, we briefly describe the -Newton and observations and data reduction. In Sect. 3, we describe the main characteristics of the sources detected within a few core radii of the globular cluster and in Sect. 4 we address our main results and conclusions.
2 XMM-Newton and observation and data reduction
The globular cluster NGC 6388 was observed in March 2003 (observation ID 0146420101) with both the EPIC MOS and PN cameras (Turner et al. 2001; Strüder et al. 2001) operating with the medium filter mode. The EPIC observation data files (ODFs) were processed using the XMM-Science Analysis System (SAS version ). Using the latest calibration constituent files currently available, we processed the raw data with the emchain and epchain tools to generate calibrated event lists. After screening with standard criteria, as recommended by the Science Operation Centre technical note XMM-PS-TN-43 v3.0, we rejected any time period affected by soft proton flares. The remaining time intervals resulted in effective exposures of ks, ks, and ks for MOS 1, MOS 2, and PN, respectively.
| (kpc) | (arcmin) | (arcmin) | ||||
|---|---|---|---|---|---|---|
| 11.5 | 0.12 | 0.67 | 5.29 | 0.17 | 6.72 | 2.6 |
| Source | Net (counts) | HR1 | HR2 | HR3 | () | () |
|---|---|---|---|---|---|---|
| (0.5-7 keV) | cgs) | cgs) | ||||
| 1 | 172.0 13.3 | 0.26 0.09 | 0.20 0.09 | -0.06 0.10 | 2.9 (3.7) | 4.6 (5.8) |
| 2 ……. | 195.1 14.2 | -0.18 0.11 | -0.52 0.07 | -0.38 0.07 | 3.3 (4.2) | 5.2 (6.6) |
| 3 ……. | 527.1 23.0 | 0.53 0.04 | 0.96 0.01 | 0.86 0.04 | 8.9 (11.2) | 14.0 (17.6) |
| 4 ……. | 37.0 6.3 | -0.12 0.20 | -0.04 0.21 | 0.08 0.20 | 0.6 (0.8) | 0.9 (1.2) |
| 5 ……. | 125.1 11.4 | 0.80 0.06 | 0.95 0.03 | 0.60 0.21 | 2.1 (2.7) | 3.3 (4.2) |
| 6 ……. | 41.9 6.8 | -0.04 0.19 | -0.07 0.20 | -0.03 0.20 | 0.7 (0.9) | 1.1 (1.4) |
| 7 ……. | 134.7 11.9 | 0.66 0.07 | 0.89 0.04 | 0.57 0.16 | 2.3 (2.9) | 3.6 (4.6) |
| 8 ……. | 87.0 9.8 | 0.30 0.13 | 0.18 0.13 | -0.12 0.16 | 1.4 (1.8) | 2.2 (2.8) |
| 9 ……. | 109.0 10.6 | 0.25 0.11 | 0.27 0.11 | 0.02 0.13 | 1.8 (2.3) | 2.8 (3.6) |
| 10 ….. | 355.0 19.1 | 0.54 0.05 | 0.97 0.02 | 0.91 0.03 | 6.0 (7.6) | 9.4 (11.9) |
| 11 ….. | 78.1 8.8 | -0.23 0.13 | 0.02 0.15 | 0.25 0.13 | 1.3 (1.6) | 2.0 (2.5) |
| 12 ….. | 108.1 10.7 | -0.18 0.13 | -0.11 0.14 | 0.07 0.12 | 1.8 (2.3) | 2.8 (3.6) |
| 13 ….. | 127.8 11.7 | 0.14 0.10 | 0.30 0.11 | 0.17 0.12 | 2.2 (2.7) | 3.4 (4.2) |
| 14* … | 789.6 28.8 | 0.38 0.04 | 0.58 0.03 | 0.26 0.06 | 13.4 (16.8) | 21.1 (26.5) |
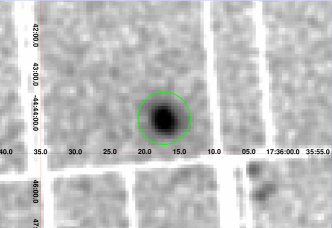
In Fig. 1, the XMM-Newton observed field of view (PN camera) is shown. The green circle is centered on NGC 6388 and has a radius equal to the half mass radius of the globular cluster.
The source spectra were extracted in a circular region centered on the nominal position of the target in the three EPIC cameras, while the background spectra were accumulated in annuli around the same coordinates. The resulting spectra were rebinned to have at least 25 counts per energy bin.
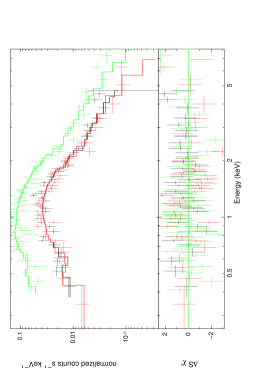
The spectra were simultaneously fitted with XSPEC (version 12.0.0). In Fig. 2, we show the MOS 1, MOS 2, and PN spectra for NGC 6388 and the respective fits. The best-fitting model was an absorbed power law (=1.14 for ). We left all the parameters free, yielding cm-2, and for the column density222Within the error, the column density obtained from the fit procedure is compatible with that due to gas in our Galaxy along the line-of-sight to NGC 6388, i.e. cm-2 (Dickey & Lockman 1990)., power law index and normalization, respectively.
The flux in the 0.5-7 keV is erg cm-2 s-1 which, for the globular cluster distance of kpc, corresponds to a luminosity of erg s-1. Note that all the uncertainties quoted above are given at a confidence level.
The information that we can get from -Newton data are important in obtaining an overall description of the -ray radiation coming from NGC 6388. However, the Chandra satellite has a much better angular resolution than the -Newton telescope and therefore it is worth using Chandra to verify whether the emission detected by -Newton is due to a single source rather than superpositions of several bright -ray sources.
The globular cluster was observed by Chandra with the ACIS-S camera (for ks, observation ID 5505). In our analysis, we used the event 2-type files and followed the standard procedures for analysis of Chandra data using the CIAO version 3.4 tool suite. The background level during the observation was nominal.
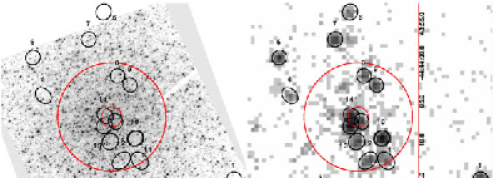
We created images in the full (F=0.5-7 keV), soft (S=0.5-1.5 keV), medium (M=1.5-2.5 keV) and hard (H=2.5-7 keV) bands, and created a true color -ray image of the globular cluster (given in Fig. 3). The -ray emission towards NGC 6388 detected by the -Newton satellite is associated with several discrete sources.
We searched in the images in each band for discrete sources by using the CIAO celldetect tool with a threshold signal-to-noise detection value of . In the following, we will treat only the sources detected within core radii from the NGC 6388 center. This resulted in the detection of discrete sources well within the half mass radius () of NGC 6388. Of the detected sources, are contained within the globular cluster core radius (), while are close to the NGC 6388 center of gravity, which is located at A.R. and DEC (Lanzoni et al. 2007) with an uncertainty of in both coordinates. The absolute errors associated with Chandra astrometry is .
The detected -ray sources appear to be associated with the globular cluster NGC 6388. Based on the Log N-Log S relationship of Giacconi et al. (2001), the estimated number of the background sources (with flux greater than the minimum detected flux, i.e. erg cm-2 s-1) contained within the cluster half mass radius is .
In Fig. 4, we show the detected discrete sources in the Chandra 0.5-7 keV image (right panel) as the encircled ones (each source being labeled with an increasing number). In left panel of the same figure, we show a HST ACS-HRC image (filter V F555W) of the same field of view. The red solid circle represents the NGC 6388 core, while the dashed circle is centered on the globular cluster center of gravity and has a radius of as the sum of the uncertainties of the center of gravity and the absolute position error of Chandra.
We estimated the counts of each source from an aperture including most of the observed emission333In the case of point-like sources, the aperture radius was , which corresponds to an encircled energy of at 1.4 keV.. The background has been estimated by using annuli around each source when possible, or circles with the same extraction region radius otherwise (excluding any encompassed source).
For each source, we extracted the net number of counts in the full band and evaluated the hardness ratios , and , where S, M and H correspond to the net counts in the soft, medium and hard bands, respectively. We give the results of the analysis in Table 2, where the counts in the 0.5-7 keV band, the hardness ratios and the absorbed () and corrected () fluxes are shown. In the last column, the absorbed () and corrected luminosity () of each source (in the 0.5-7 keV) has been determined assuming a power law absorbed by the Galactic line-of-sight column density cm-2.
The three sources (labeled as 14*) present in the globular cluster center should be viewed cautiously: since we cannot resolve them in a better way we refer to the cumulative net counts and luminosity.
3 The inner -ray cluster in NGC 6388
As we have seen in the previous Section, the better angular resolution of the Chandra satellite with respect to that of -Newton, allowed us to detect several discrete sources within a few core radii of NGC 6388. The main properties of the detected sources are given in Table 2.
Any classification of the detected sources requires an understanding of their spectral shapes. Due to the low count rates of most of the detected sources, formal spectral modeling is only possible for the brightest ones (namely those with more than counts and labeled as 3, 10 and 14*).
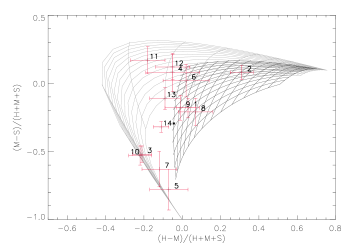
For the other sources, a rough classification can be done by using a color-color diagram (see Fig. 5) in which the two hardness ratios and are given. In the same plot, we give the expected set of color-color contours for bremsstrahlung (grey region) and power law (black region) components, respectively. In both the two regions, the equivalent hydrogen column (taken varying between cm-2 and cm-2) is associated with almost horizontally-oriented lines. The temperature of the bremsstrahlung models (taken in the range 0.1-2.5 keV) is associated with primarily vertical-lines. In the case of the power law region, vertical orientation is associated with values of the parameter in the range 0.1-2.5.
According to the classification scheme of Jenkins et al. (2005), to which we refer for more details, most of the sources with seem to be low mass -ray binaries, with the source 2 possibly being a high mass -ray binary containing a neutron star.
The source labeled as 14* is positioned in a region of the color-color diagram where its spectral properties are not well fitted by a single spectral component (represented by the two shaded regions), even if it seems marginally consistent with power law models with large exponents ( greater than 2.5, typical of -ray emission from IMBHs, which are expected to be soft sources). This was expected since we extracted the cumulative spectrum of what appeared to be the superposition of three different sources (possibly LMXRBs), each of which has different spectrum properties. Finally, note the existence of four soft sources corresponding to .
Interestingly, the cumulative luminosity of the sources detected in the Chandra field of view (see Table 2) is fully consistent with that derived by the XMM-Newton observation of NGC 6388.
For the three sources with more than counts (3, 10 and 14*) detected within the NGC 6388 globular cluster, we extracted the spectrum from a circular aperture centered on each of the three sources. Note that the source labeled as 14* seems to be the superposition of three distinct sources (see also the true color images in Fig. 3), for which it was not possible to extract the single spectra. In this case we refer to the cumulative spectrum.
The spectra (shown in Fig. 6) were rebinned with 25 counts per bin and fitted using the XSPEC spectral fitting package. All the errors given below are at a confidence level.
The spectrum of the source 3 is well fitted (=0. 76 for ) by an absorbed black-body model with temperature keV, hydrogen column density cm-2, and normalization corresponding to a flux (in the 0.5-7 keV) of erg cm-2 s-1.
Source 10 is characterized by a power law whose best fit parameters (=0. 76 for ) are cm-2, , and for the column density, power law index and normalization, respectively. The derived flux in the 0.5-7 keV is erg cm-2 s-1.
As discussed above, the source labeled as 14* seems to be the superposition of three different sources: one very soft and the other two harder, which lie close to the center of gravity of the globular cluster. With the present observations there is no way to discriminate whether one of these -ray sources is associable with the IMBH hosted in NGC 6388. Nevertheless, if this is the case, the observed flux in the 0.5-7 keV can be considered as the present upper limit to the IMBH -ray signal. The source appears to be soft since the best fit absorbed power law (=0.81 for ) has parameters cm-2, and for the column density, power law index and normalization, respectively. In this case, the flux in the 0.5-7 keV would be erg cm-2 s-1 corresponding to an -ray luminosity of erg s-1.
4 Results and conclusions
Intermediate-mass black holes may represent the link between the stellar mass black holes present throughout the Milky Way and the super-massive black hole thought to exist in the center of the Galaxy and in external galaxies. Recent theoretical works have suggested that all the globular clusters may have central black holes with masses of the order times the stellar mass in the cluster, as a consequence of merging processes of stellar mass black holes (Miller & Hamilton 2002). Present observational campaigns seem to confirm this hypothesis.
In the particular case of NGC 6388, numerical simulations (see e.g. Baumgardt et al. 2005b) have shown that it is a good candidate to host an IMBH of a few M⊙. Interestingly, the optical HST observations of the globular cluster and the detailed study of the brightness surface profile down to a distance of from the center, revealed a significant power law (with slope ) deviation from a flat core behavior (Lanzoni et al. 2007). This was explained assuming the existence of an IMBH with mass M⊙ in the center of the globular cluster.
As a consequence of matter accretion, we expect that the putative IMBH should accrete and emit radiation in the -ray band, so we searched for such a signature in the observations available in both -Newton and Chandra archives.
The study of the central region of NGC 6388 in the 0.5-7 keV energy band reveals the existence of several discrete -ray sources (see Sect. 3 for a detailed discussion) among which three of them seem to be overlapped and close to the center of gravity of NGC 6388. Although we can not obtain the spectrum of each of the three sources separately, we have speculated that if one of these is the putative NGC 6388 IMBH, the observed -ray signal can be thought as an upper limit to the IMBH flux.
Hence, with reference to Table 2, the unabsorbed -ray flux (in the 0.5-7 keV band) of the IMBH is erg cm-2 s-1, corresponding to a luminosity of erg s-1 for the NGC 6388 distance of 11.5 kpc.
At this point one can evaluate the IMBH radiative efficiency with respect to the maximum allowed black hole accretion rate given by the Eddington luminosity erg s-1. For the IMBH at the center of NGC 6388 one gets erg s-1, so that we can conclude that it is accreting with efficiency . Note that this accretion efficiency is in agreement with the efficiency estimates for black hole accretion in quiescent galaxies and ultra-low luminous AGNs, for which is typically in the range (Baganoff et al., 2003).
The bolometric luminosity of the NGC 6388 IMBH can be inferred from the broadband spectral energy distributions of galactic nuclei (see Elvis et al. 1994 for details). In this case, it is found that the bolometric correction for the -ray band corresponds to a factor , so that (or erg s-1).
It could be also interesting to estimate the expected accretion luminosity () of the IMBH as a consequence of the accretion of the surrounding gas, and compare it to the bolometric luminosity () above. It is indeed expected that post-main-sequence stars continuously lose mass that is injected both in the cluster and intracluster medium. Dispersion measurements derived from radio observations of pulsars give the most sensitive probe of the gas content in globular clusters. Studying the population of millisecond pulsars in the globular clusters M 15 and 47 Tuc, Freire et al. (2001) find indications of the presence of a plasma with electron density atoms cm-3 and temperature K (see also Ho at al. 2003 for a detailed study of the M 15 globular cluster). In common with other authors (Maccarone 2004), we assume in the following that the gas density in NGC 6388 is atoms cm-3. If the IMBH at the center of NGC 6388 accretes spherically through the Bondi accretion process, the gravitational potential of the IMBH dominates the dynamics of the gas within the accretion radius defined as , where km s-1 is the sound speed in a plasma at temperature . For K and M⊙, one obtains km s-1 and pc. The accretion mass rate in the Bondi mechanism is , where is the gas density at . Assuming that the efficiency in converting the accreted mass into energy is the standard , the expected luminosity due to accretion is , i.e.
| (1) |
Hence, in the case of the NGC 6388 IMBH, the accretion luminosity is clearly larger than the bolometric luminosity quoted above by a factor of at least , leading us to conclude that the accretion efficiency is .
In recent years it has also been proposed that a relationship between black hole mass, -ray luminosity and radio luminosity does exist (see e.g. Merloni et al. 2003 and Maccarone 2004). In this context, IMBHs at the center of many globular clusters, such as NGC 6388, may be easily identifiable objects in deep radio observations.
In particular, the expected radio flux at GHz from the putative IMBH in NGC 6388 would be
| (2) |
Assuming that it is a quiescent and stable accreting black hole, we can be more predictive about its radio luminosity. In Fig. 7, the expected radio emission (solid oblique line) from the IMBH at the center of NGC 6388 is shown. The solid vertical line represents the maximum allowed -ray luminosity for an Eddington limited accreting black hole. As one can see, depending on the accretion efficiency (dotted and dashed lines are for and , respectively) the radio flux at 5 GHz is mJy, which is within the detection possibilities of the Australia Telescope Compact Array (ATCA). Deep radio observations within the core radius of NGC 6388 would also be important for the possibility of discovering millisecond pulsars nearby the cluster center that may allow a further and independent constraint on the IMBH mass and position with respect to the cluster center 444Indeed, one expects that an IMBH randomly moves, within the globular cluster core, due to the interaction with the other stars (assumed to have the same mass ) with an amplitude (see e.g. Bahcall & Wolf, 1976, Gurzadyan, 1982 and Merritt et al. 2006)..

Acknowledgements.
This paper is based on observations from -Newton, an ESA science mission with instruments and contributions directly funded by ESA member states and NASA. We are grateful to G. Trincheri and L. Bello for useful discussions. We are grateful to the anonymous referee for the suggestions that improved the manuscript.References
- Baganoff et al., (2003) Baganoff, F. K., et al., 2003, ApJ, 591, 891.
- Bahcall & Wolf, (1976) Bahcall, J. N., & Wolf, R. A., 1976, ApJ, 209, 214.
- Baumgardt et al. (2003) Baumgardt, H., et al., 2003, ApJ, 589, 25.
- Baumgardt et al. (2005a) Baumgardt, H., et al., 2005 a, ApJ, 582, 21.
- Baumgardt et al. (2005b) Baumgardt, H., Makino, J., & Hut, P., 2005 b, ApJ, 620, 238.
- Dickey & Lockman (1990) Dickey, J. M., & Lockman, F. J., 1990, ARA&A, 28, 215.
- De Paolis et al. (1996) De Paolis, F., Gurzadyan, V. G., & Ingrosso, G., 1996, A&A, 315, 396.
- Elvis et al. (1994) Elvis, M., et al., 1994, ApJS, 95, 1.
- Freire et al. (2001) Freire, P. C., et al., 2001, ApJ, 557, L105.
- Gebhardt et al. (2002) Gebhardt, K., Rich, R. M., & Ho, L. C., 2002, ApJ, 578, L41.
- Gebhardt et al. (2005) Gebhardt, K., Rich, R. M., & Ho, L. C., 2005, ApJ, 634, 1093.
- Gerssen et al. (2002) Gerssen, J., et al., 2002, AJ, 124, 3720.
- Gerssen et al. (2003) Gerssen, J., et al., 2003, AJ, 125, 376.
- Giacconi et al. (2001) Giacconi, R., et al., 2001, ApJ, 551, 624.
- Gurzadyan, (1982) Gurzadyan, V. G., 1982, A&A, 114, 71.
- Harris (1996) Harris, W. E., 1996, AJ, 112, 1487.
- Ho et al. (2003) Ho, L. C., Terashima, Y., & Okajima, T., 2003, ApJ, 587, L35.
- Lanzoni et al. (2007) Lanzoni, B., et al., 2007, astro-ph/0709.011v1.
- Jenkins et al. (2005) Jenkins, L. P., et al., 2005, MNRAS, 357, 401.
- Maccarone (2004) Maccarone, T. J., 2004, MNRAS, 351, 1049.
- Miocchi (2007) Miocchi, P., 2007, preprint astro-ph/0702479.
- Magorrian et al. (1998) Magorrian, J., et al., 1998, AJ, 115, 2285.
- Merloni et al. (2003) Merloni, A., Heinz, S., & Di Matteo, T., 2003, MNRAS, 345, 1057.
- Merritt et al. (2006) Merritt, D., Berczik, P., & Laun, F., 2006, preprint astro-ph/0408029v3.
- Miller & Hamilton (2002) Miller, M. C., & Hamilton, D. P., 2002, MNRAS, 330, 232.
- Miller & Colbert (2003) Miller, M. C., & Colbert, E., 2003, IJMP D, 13, 1.
- Noyola & Gebhardt (2006) Noyola, E., & Gebhardt, K., 2006, AJ, 132, 447.
- Pooley & Rappaport (2006) Pooley, D., & Rappaport, S., 2006, ApJ, 644, L45.
- Portegies Zwart et al. (2004) Portegies Zwart, S. F., et al., 2004, Nature, 428, 724.
- Strüder et al. (2001) Strüder , L., et al., 2001, A&A, 365, 18.
- Turner et al. (2001) Turner, M. J. L., et al., 2001, A&A, 365, 27.