SN-ATLAS-2007-059
13 September 2007
ATLAS Collaboration
J.Carvalho, N.Castro, L.Chikovani, T.Djobava, J.Dodd, S.McGrath, A.Onofre, J.Parsons, F.Veloso
Abstract
The ATLAS experiment sensitivity to top quark Flavour Changing Neutral Current (FCNC) decays was studied at LHC using events. While one of the top quarks is expected to follow the dominant Standard Model decay , the other decays through a FCNC channel, i.e. , or . Different types of analyses, applied to each FCNC decay mode, were compared. The FCNC branching ratio sensitivity (assuming a signal significance) and 95% confidence level limits on the branching ratios (in the hypothesis of signal absence) were obtained.
filipe.veloso@lipc.fis.uc.pt
1 Introduction
Flavour Changing Neutral Currents (FCNC) are strongly suppressed in the Standard Model (SM) due to the Glashow-Iliopoulos-Maiani (GIM) mechanism [1]. Although absent at tree level, small FCNC contributions are expected at one loop level, according to the Cabibbo-Kobayashi-Maskawa (CKM) mixing matrix [2]. In the top quark sector of the SM, these contributions limit the FCNC decay branching ratios to the gauge bosons, (), to below . There are however extensions of the SM, like supersymmetry (SUSY) [3], multi-Higgs doublet models [4] and SM extensions with exotic (vector-like) quarks [5], which predict the presence of FCNC contributions already at tree level and significantly enhance the FCNC decay branching ratios compared to the SM predictions.
Due to its large mass, much higher than any other known fermion, the top quark is a very good laboratory to look for physics beyond the SM. If the top quark has FCNC anomalous couplings to the gauge bosons, its decay properties would be affected, and possibly measured at colliders, in addition to the dominant decay mode . Indeed one of the most prominent signatures of FCNC processes at the Large Hadron Collider (LHC), would be the direct observation of a top quark decaying into a charm or an up quark together with a or boson [6]. In the effective Lagrangian approach [7, 8] the new top quark decay rates to the gauge bosons [9],
| (1) |
| (2) |
| (3) |
| (4) |
can be expressed in terms of the , , and anomalous couplings to the , and bosons respectively. The energy scale associated with this new physics is represented by , while and are, respectively, the strong and electromagnetic coupling constants. The electroweak mixing angle is represented by and the top and masses are represented, respectively, by and .
Although FCNC processes associated with the production [10, 11] and decay[12] of top quarks have been studied at colliders ( and at 95% Confidence Level (CL)[12]), the amount of top quark relevant data collected up to now is not comparable with the statistics expected at the LHC. The LHC will operate with a centre-of-mass energy of 14 TeV, and in the low luminosity phase ( cm-2s-1), several millions of top quarks will be produced per year and experiment, mainly in pairs (with a NLO cross-section of pb [9, 13]), but also through single top production (with an expected NLO cross-section of 280 pb [14]).
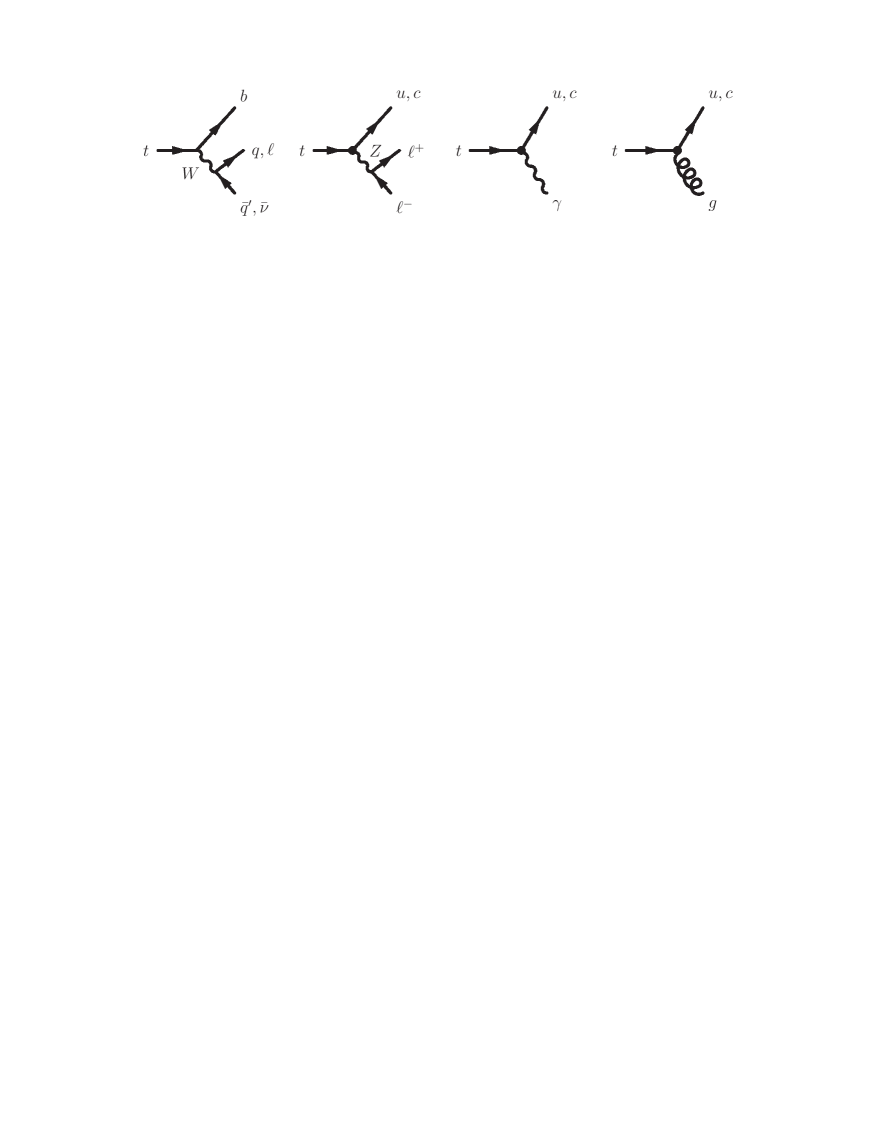
This paper is devoted to the study of the ATLAS experiment [15] sensitivity to FCNC top quark decays at the LHC. While one of the top quarks is expected to follow the dominant SM decay (), the other decays through a FCNC channel, i.e. , or . The corresponding Feynman diagrams are shown in Fig. 1. Different types of analyses (cut-based and likelihood-based) were applied to each FCNC decay mode and their results compared.
This paper is organised as follows. After the introduction, a description of the simulated signal and background is given in section 2. The analysis criteria applied to each FCNC channel are described in section 3 and in section 4 a comparison of the results obtained by the different analyses [16, 17] is presented within two different approaches: branching ratio sensitivities (assuming a signal significance for discovery) and 95% confidence level limits (in the hypothesis of signal absence). These results are compared with previously published ones [10, 11, 12, 15, 18, 19]. In section 5 the conclusions are presented.
2 Signal and background simulation
The Monte Carlo (MC) generation of the QCD (), jets, jets, , and background processes was done with the library PYTHIA [20]. Single top quark production was generated with TopReX 4.05 [21], and the SM top pair production () was generated using TopReX and PYTHIA. These libraries were also used to generate signal samples, where one of the -quarks decays via Charged Currents (CC) into and the other one decays through FCNC into , or . For TopReX the anomalous couplings to the , and bosons were set to and was set to 1 TeV. The top mass was set to GeV. Different values, GeV and GeV, were also considered for the study of systematic uncertainties, as explained in section 4.3. No SUSY backgrounds or other contributions beyond the SM were considered in the present analyses. The CTEQ2L and CTEQ5L Parton Distribution Functions (PDF) were used [20, 21] in the analyses and the CTEQ4M was used for systematic studies. No pile-up was taken into account.
The generated background and signal events were passed through the ATLAS fast simulation packages ATLFAST [22] and ATLFASTB [22]. For each event, these packages begin by simulating the energy deposition in the calorimeter cells of all the stable particles. The calorimeter cells are clustered within a cone of . Cells with GeV are used as cluster seeds and the cone algorithm is applied in decreasing order of . Only clusters with GeV are considered. The polar angle and the momentum of photons are smeared according to Gaussian parameterizations. For electrons, their momenta are smeared according to a Gaussian parameterizations. The momentum of each muon is smeared according to a resolution which depends on the , and . The photon (electron) energy resolution is (), for GeV. The transverse momentum resolution of muons with GeV is . Photons, electrons and muons are selected only if they have and GeV ( GeV for muons). They are classified as isolated if the transverse energy of the cluster associated to the particle, inside a cone of , does not exceed GeV the particle energy, and the from other energy clusters must be above 0.4. The clusters of energy depositions not associated to isolated photon, electrons or muons are used for the jet reconstruction. Their momenta are smeared according to a Gaussian distribution which depends on . Jets are selected if they have GeV. For GeV, the jet energy resolution is less than 12% () and less than 24% (). The missing transverse momentum is estimated by summing the transverse momentum of the isolated photons, electrons, muons and jets. The non isolated muons and the clusters of energy deposition not associated to isolated photons, electrons, muons or jets, are also taken into account. In the ATLAS detector, it will be possible to identify -jets with by using -tagging tools. The algorithm was simulated by setting a -tagging efficiency to 60%, with contamination factors set to 14.9% (1.1%) for -jets (light quark, gluon and tau jets) for the low luminosity phase ( cm-2s-1). In order to check the dependence of the analysis with the -tagging efficiencies, different values, 50% and 70% (corresponding to the expected -tag variation within the interesting signal transverse momentum range), were also considered for the systematic studies and the high luminosity phase ( cm-2s-1), with contamination factors of 9.2% (0.4%) and 23.3% (2.9%) for -jets (light quark, gluon and tau jets), respectively.
Initial and final state QED and QCD radiation (ISR+FSR), multiple interactions and hadronization were taken into account in the event generation. Due to the hadronization and FSR, the jets are reconstructed with less energies than those from the original quarks or gluons. The jets energies were calibrated by the ATLFASTB package, by applying a calibration factor, , that is the ratio between the true parton energy and the reconstructed jet energy. The calibration factor depends on the and is different for -tagged and light jets.
Preliminary full simulation studies, based on the ATHENA framework[23], indicate a fair agreement between the fast and full simulations of the ATLAS detector.
3 Topologies and event selection
The final states corresponding to the different FCNC top decay modes lead to different topologies according to the number of jets, leptons and photons. There is however a common characteristic of all channels under study, i.e. in all of them one of the top quarks is assumed to decay through the dominant SM decay mode and the other is forced to decay via one of the FCNC modes , or . Two different types of analyses, labelled “cut-based” and “likelihood-based”, were used to study the ATLAS sensitivity to FCNC top quark decays. For both analyses the leptonic decays of the () were taken into account111For the cut-based analyses , while for the likelihood-based analyses . In addition, for the FCNC channel , the hadronic decay of the () was also considered for the cut-based analysis.
3.1 channel
The QCD backgrounds at hadron colliders make the search for the signal via the fully hadronic channel (when both the and decay hadronically) very difficult. For this reason only the leptonic decay of the was considered. The final state was then determined by the decays of the boson. Two different possible decay channels have been considered: the first (’leptonic mode’) where the decays leptonically , and the second (’hadronic mode’) with . The hadronic decay signature has a larger branching fraction, but suffers from larger backgrounds. The experimental signature of the leptonic mode includes three isolated charged leptons, two of which reconstruct a boson, large missing transverse energy due to the neutrino and at least two jets, one of which is tagged as a -jet. The signature of the hadronic mode is characterised by having two leptons (again with ) and at least four jets, one of which is tagged as a -jet. Following a previous analysis [18], new cut-based [16] and likelihood-based [17] analyses were developed and are described below.
3.1.1 Cut-based analysis: hadronic mode
The final state for the hadronic decay mode is . This mode has the following backgrounds: jets production, followed by the decay , , and with the final state topologies (a) , or (b) . In the case of (a), the additional two jets must come from QCD radiation, while in (b) the source of leptons is from cascade decays. jets production at the LHC has a relatively large cross-section, dominated by and processes. To decrease the size of the background sample which needed to be generated, thresholds were imposed at the generator level on the invariant mass, GeV, where is the effective centre-of-mass energy, and transverse momentum, GeV, of the hard scattering process. The cross-section for this subsample of events was =3186 pb. The background is the electroweak process , and has an assumed cross-section of pb. Background samples of jets events, events and events were generated. Assuming the above mentioned production cross-sections, and including the relevant branching ratios, these background samples correspond to an integrated luminosity of 100 fb-1.
The analysis began with preselection cuts requiring that the event contains at least two charged leptons (electrons with GeV within pseudorapidity and muons with GeV within pseudorapidity ), and include a pair of opposite-sign and same-flavour leptons, compatible with them having come from a decay. In addition, the number of jets with GeV within pseudorapidity was required to be at least four. After preselection cuts, 46% of the signal events were accepted, while only 3.0%, 3.5% and 4.1% of the , jets and background events, respectively, were selected.
The next cuts required the presence of two isolated leptons with GeV and the demand for at least four jets with GeV and . The isolation of the jets (measured in relation to other jets and leptons) was then required to be greater than 0.4.
Fig. 2 presents the distributions of reconstructed dilepton invariant mass and of reconstructed invariant mass for the best combinations of (i.e. combination with the closest to top mass value of invariant mass ) for the signal sample. A cut was then applied on the dilepton invariant mass,requiring that it lie within 6 GeV around .
To suppress the large remaining jets background, it was necessary to use the information that signal events contain, in addition to the decay , a hadronic decay of the other top quark. The hadronic top quark decay was, therefore, reconstructed as part of the signal requirement. First, a pair of jets was required to have an invariant mass within a 16 GeV around . Fig. 3 shows the distribution of reconstructed for the best combinations of (i.e. combination with the closest to mass value of invariant mass ) for the signal events. The mass resolution is GeV. A requirement was then made to have exactly one jet tagged as a -jet. Finally,the invariant mass was required to lie within 8 GeV around .
Fig. 3 presents the distribution of the reconstructed invariant top mass ( for the best combinations of (i.e. combination with the closest to top mass value of invariant mass ) for the signal. The top mass resolution is GeV, implying that the mass window applied is rather narrow in order to get a large background rejection. The sequence of cuts required to reconstruct the hadronic decay of the other top quark dramatically suppresses the backgrounds, but also reduces the signal efficiency by almost an order of magnitude. For those events with an accepted candidate, the invariant mass of the candidate with the remaining unassigned high jets was reconstructed to look for a signal from decays. The resolution of distribution is GeV (see Fig. 2). The analysis cuts reduce the background to a negligible level in the GeV mass window. Two events of the jets background are accepted in this mass window.
Table 1 summarises the effects of the sequential application of the above described various analysis cuts on the background samples and on the sample of 19000 signal events of the topology .
| Description | Signal | Background Processes | |||
|---|---|---|---|---|---|
| of | jets | ||||
| Cuts | di-leptonic | semi-leptonic | |||
| (%) | Nevt | Nevt | Nevt | Nevt | |
| Preselection | 46.0 | 7.5 | 4970 | 5.8 | 2.7 |
| 2 leptons, 4 jets | |||||
| 2 leptons, GeV | 37.7 | 5.9 | 4456 | 428800 | 11200 |
| 4 jets, GeV | 15.2 | 63478 | 400 | 35530 | 870 |
| 14.9 | 60421 | 390 | 35370 | 830 | |
| 14.9 | 60394 | 361 | 35370 | 830 | |
| GeV | 12.8 | 50973 | 268 | 3104 | 60 |
| GeV | 5.3 | 14170 | 139 | 719 | 37 |
| one -tag | 2.2 | 1379 | 11 | 376 | 15 |
| GeV | 0.6 | 90 | 1 | 28 | 4 |
| GeV | 0.4 | 2 | 0 | 5 | 0 |
3.1.2 Cut-based analysis: leptonic mode
The final state for the leptonic decay mode is . The experimental signature therefore includes three isolated charged leptons, two of which reconstruct a boson, and large missing transverse energy due to the undetected neutrino.
This mode has the following backgrounds: jets, , and . Assuming the production cross-sections given earlier, and including the relevant branching ratios, background samples of jets events, 38000 events, and events were generated. These background samples correspond to an integrated luminosity of 100 fb-1.
Preselection cuts were first applied, requiring the presence of at least three charged leptons (electrons with GeV and muons with GeV) within pseudorapidity . Of these, at least one pair of leptons must be of opposite sign and same flavour, compatible with them being produced from a decay. In addition, the number of jets in the event with GeV within pseudorapidity was required to be at least two. The requirement of three leptons reduces significantly the jets and backgrounds, while the requirement of two jets reduces significantly and jets backgrounds.
The lepton criteria were then tightened, by requiring the presence of at least three isolated, charged leptons (electrons or muons) with GeV. The next requirement, namely that the missing transverse momentum in the event satisfies GeV, is effective at further reducing the jets background while having little impact on the signal and other background sources. Next, it was demanded that there be at least two jets with GeV, , and satisfying the following isolation conditions: (jet-jet isolation) and (lepton-jet isolation). The cut requiring the presence of two or more jets in each event effectively suppresses the background.
The presence of a reconstructed decay is a powerful cut against the background. A like-sign, same-flavor pair of isolated leptons was required to reconstruct to the mass within GeV. Fig. 4 presents the distribution of reconstructed invariant mass of pairs , for all dilepton combinations for the signal events. The width of the accepted window corresponds to approximately twice the mass resolution of about 2.9 GeV. The next requirement was the presence in the event of exactly one tagged -jet, which is effective at further reducing the background Finally, a peak at the top quark mass in the invariant mass distribution was sought. In Fig. 4, the distribution of reconstructed invariant mass for all combinations of is presented for the signal events. The top quark mass resolution is GeV. Accepted combinations were required to lie within GeV () around the known top quark mass. This top mass window removes almost completely the remaining background and the final signal efficiency is 6.1% with a total background of 7 events for an integrated luminosity of 100 fb-1.
Table 2 summarises the effects of the sequential application of the above described various analysis cuts on the background samples and on the sample of 20565 signal events of the topology .
| Description | Signal | Background Processes | ||
|---|---|---|---|---|
| of | jets | |||
| Cuts | (%) | Nevt | Nevt | Nevt |
| Preselection | 80.2 | 3.7 | 2941 | 11.7 |
| 3 leptons, 2 jets | ||||
| 3 leptons, GeV | 43.3 | 945 | 1778 | 1858 |
| GeV | 32.7 | 80 | 1252 | 1600 |
| 2 jets, GeV | 19.8 | 31 | 225 | 596 |
| GeV | 16.8 | 24 | 180 | 29 |
| one -tag | 8.2 | 10 | 28 | 10 |
| GeV | 6.1 | 0 | 2 | 5 |
3.1.3 Likelihood-based analysis: leptonic mode
The leptonic decay mode was also studied with a likelihood-based analysis. A general selection criteria was defined for the likelihood-based analyses: events were required to have at least one isolated lepton with GeV and at least two jets with GeV in the final state. Both the lepton and the jets were required to have . Additionally, the transverse missing momentum had to be greater than 20 GeV. Table 3 summarises the cuts performed in the likelihood-based analysis.
At the preselection, events were accepted if they had at least two additional isolated leptons (apart from the one already required by the general selection criteria) with GeV and . For the likelihood-based analyses, all the background samples were normalised to fb-1. The number of selected background events and the signal efficiency are shown in Table 4. The distribution of relevant variables at this level are shown in Fig. 5.
| Selection | ||||
|---|---|---|---|---|
| level | “3 jets” | “4 jets” | ||
| General | 1 lepton | |||
| selection | 2 jets | |||
| GeV | ||||
| Preselection | 3 leptons | 1 photon | 3 jets | 4 jets |
| 2 jets | 1 -tag | 1 -tag | ||
| GeV | GeV | |||
| Final selection | GeV | GeV | GeV | GeV |
| 1 -tag | 1 -tag | GeV | GeV | |
| 2 same flavour, | GeV | GeV | ||
| oppos. charge | ||||
The final event selection was done by requiring the leading jet to have GeV. One of the jets had to be tagged as a -jet. Additionally, in order to be compatible with the decay, two of the three leptons present in the final state were required to have opposite charges and the same flavour (electron or muon). The number of selected SM events and the signal efficiency at the final selection level are shown in Table 4. The dominant contribution for the single top background is the -channel. No QCD () and jets events passed the final selection criteria, within the generated statistics ( and events, respectively).
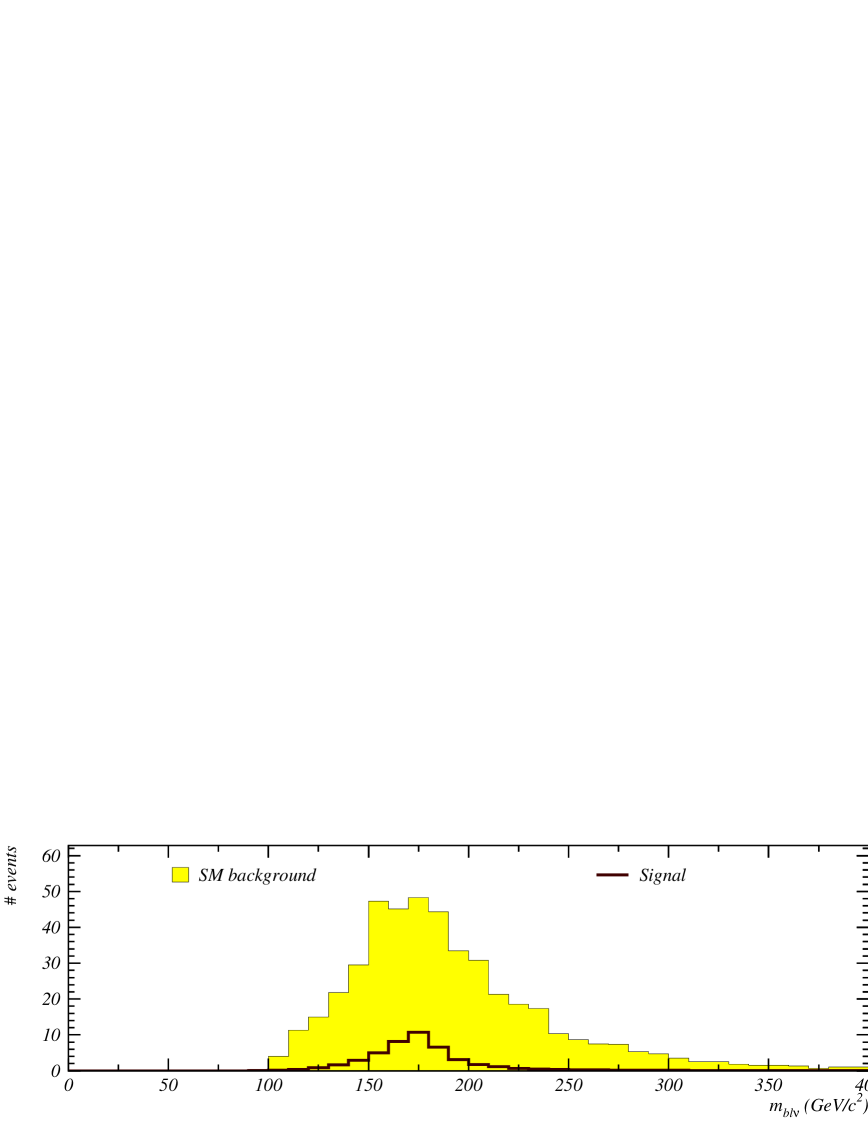
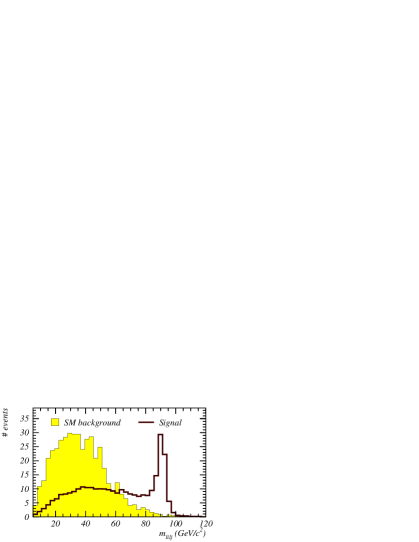
The reconstruction of the mass was done by calculating the invariant mass222In the case where more than one pair of leptons had the same flavour and opposite charges, the pair with highest was chosen. () and is shown in Fig. 6a. The reconstruction of the mass of the -quark which decayed through FCNC () was done by associating the non- jet with the pair. If more than one non- jet was present, the one with highest was chosen. The signal and SM distributions of are shown in Fig. 6b. The decay of the other -quark () cannot be directly reconstructed due to the presence of an undetected neutrino in the final state. Nevertheless, the neutrino four-momentum can be estimated by assuming the transverse missing energy to be the transverse neutrino momentum. The longitudinal component can be determined, with a quadratic ambiguity, by constraining the mass (calculated as the invariant mass of the neutrino and the most energetic remaining lepton) to its known central value ( GeV [24]). The mass of -quark with a SM decay, shown in Fig. 6c, was reconstructed by associating the -jet with the reconstructed . The quadratic ambiguity was removed by choosing the solution closer to GeV.
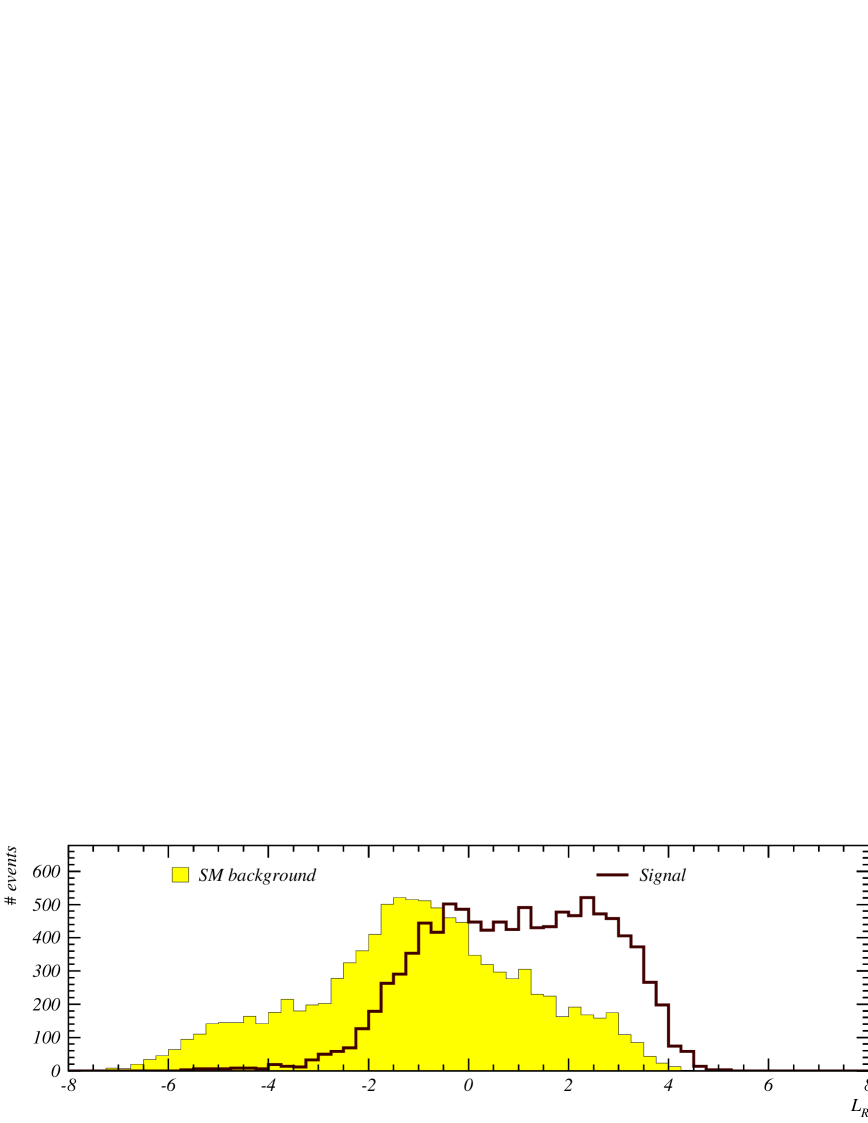
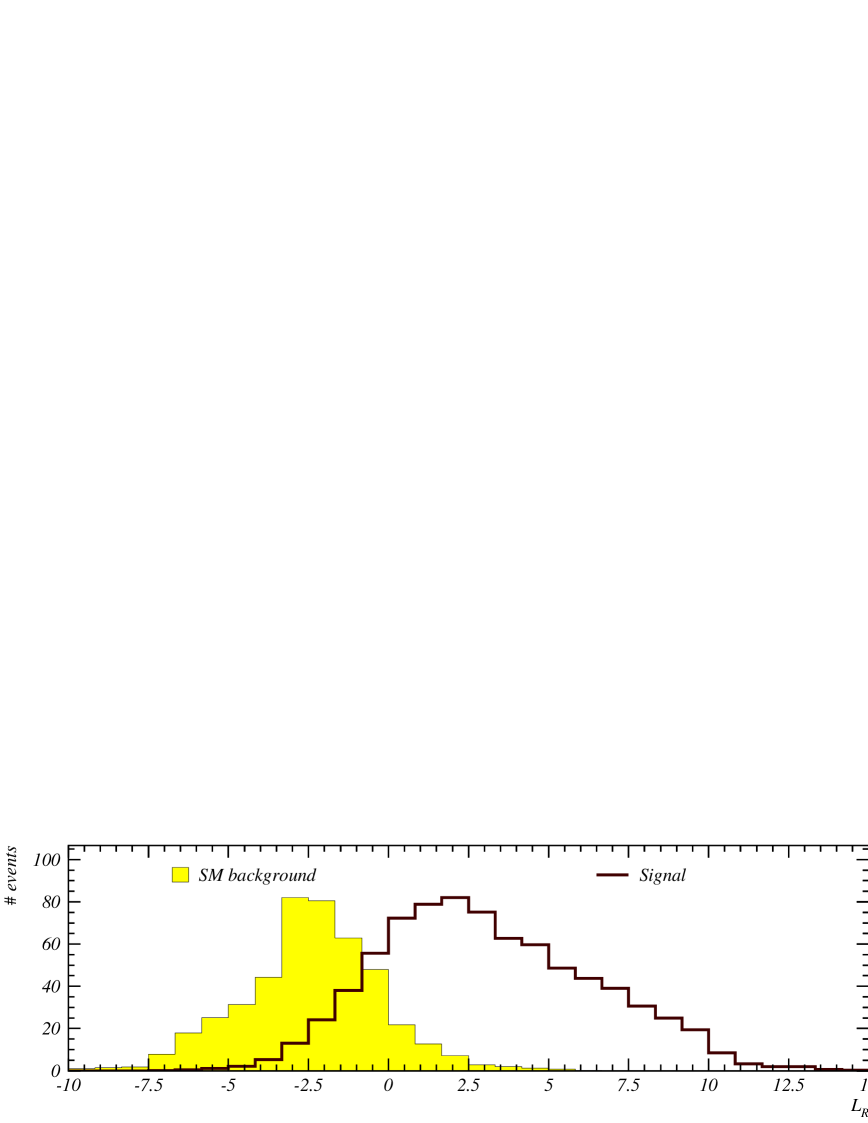
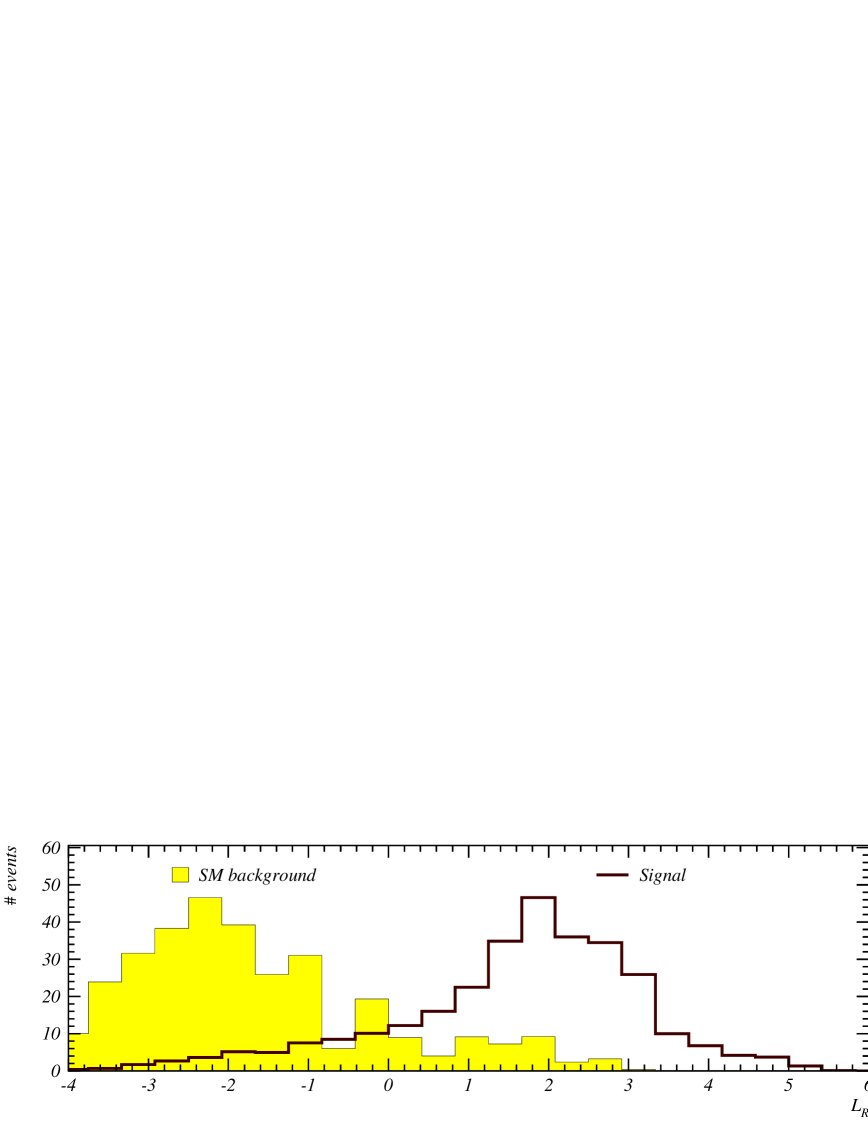
Following the final selection, a likelihood-based type of analysis was applied. Signal () and background-like () probabilities were computed using Probability Density Functions (p.d.f.), constructed from relevant physical variables. The signal and background likelihoods ( is the number of p.d.f.) were used to built the discriminant variable, defined as , assuming uncorrelated variables.
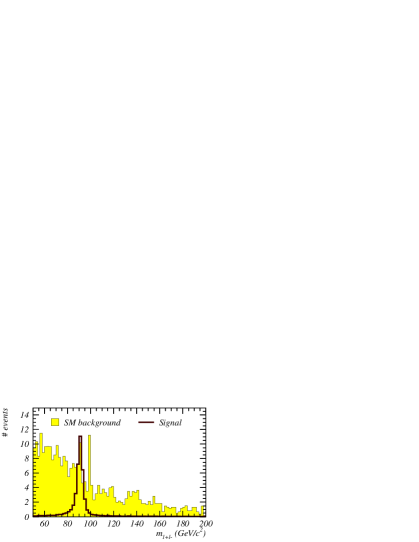
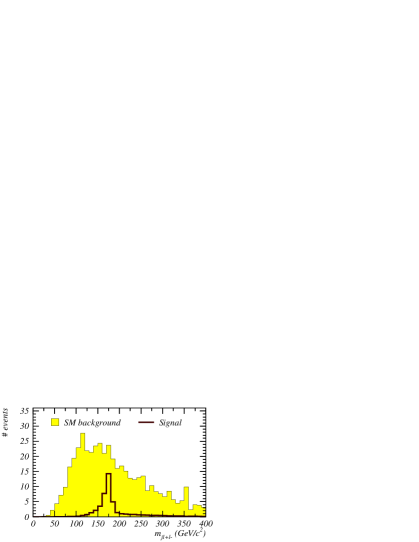
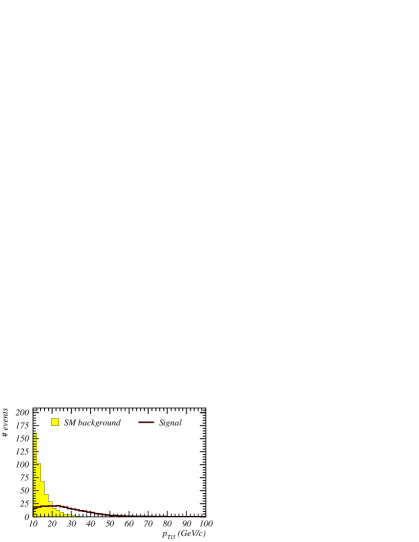
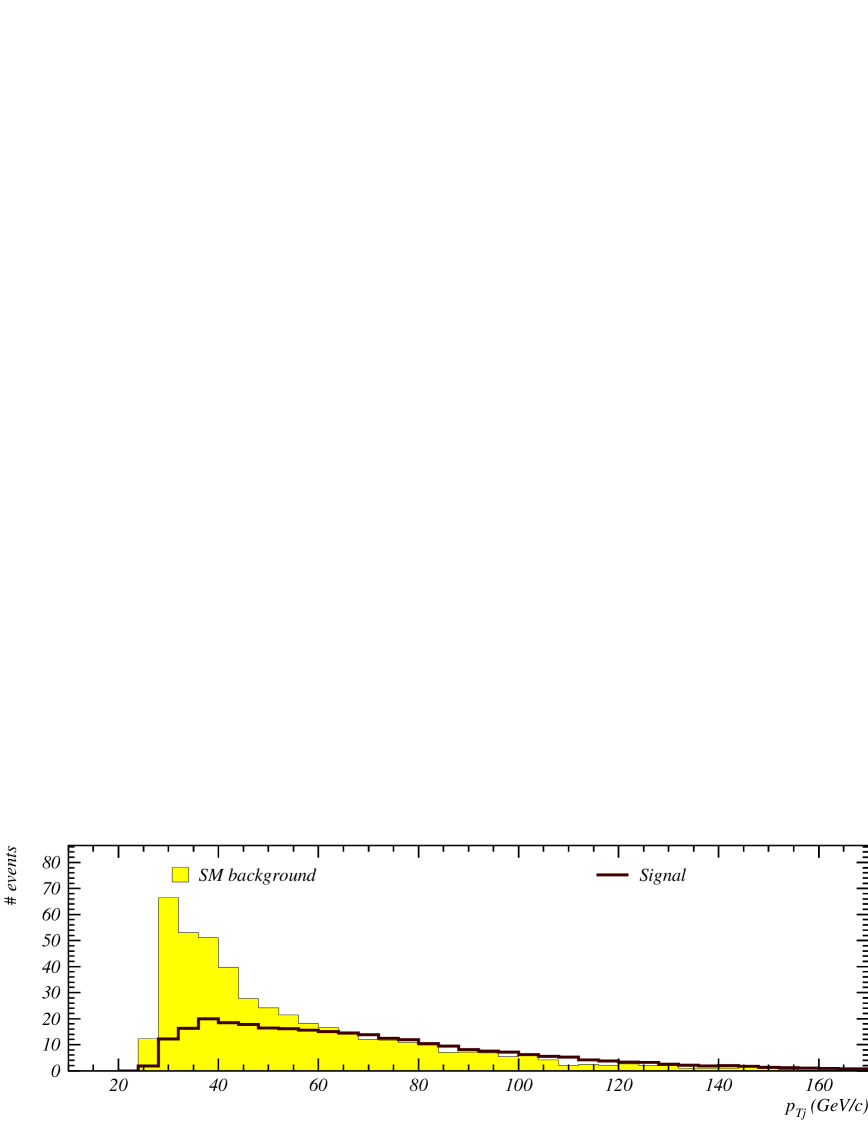
For the channel the p.d.f. were based on the following physical distributions (c.f. Fig. 7):
-
•
minimum invariant mass () of the three possible combinations of two leptons (only the three leading leptons were considered);
-
•
transverse momentum of the third lepton ();
-
•
the invariant mass and
-
•
the transverse momentum of the most energetic non- jet ().
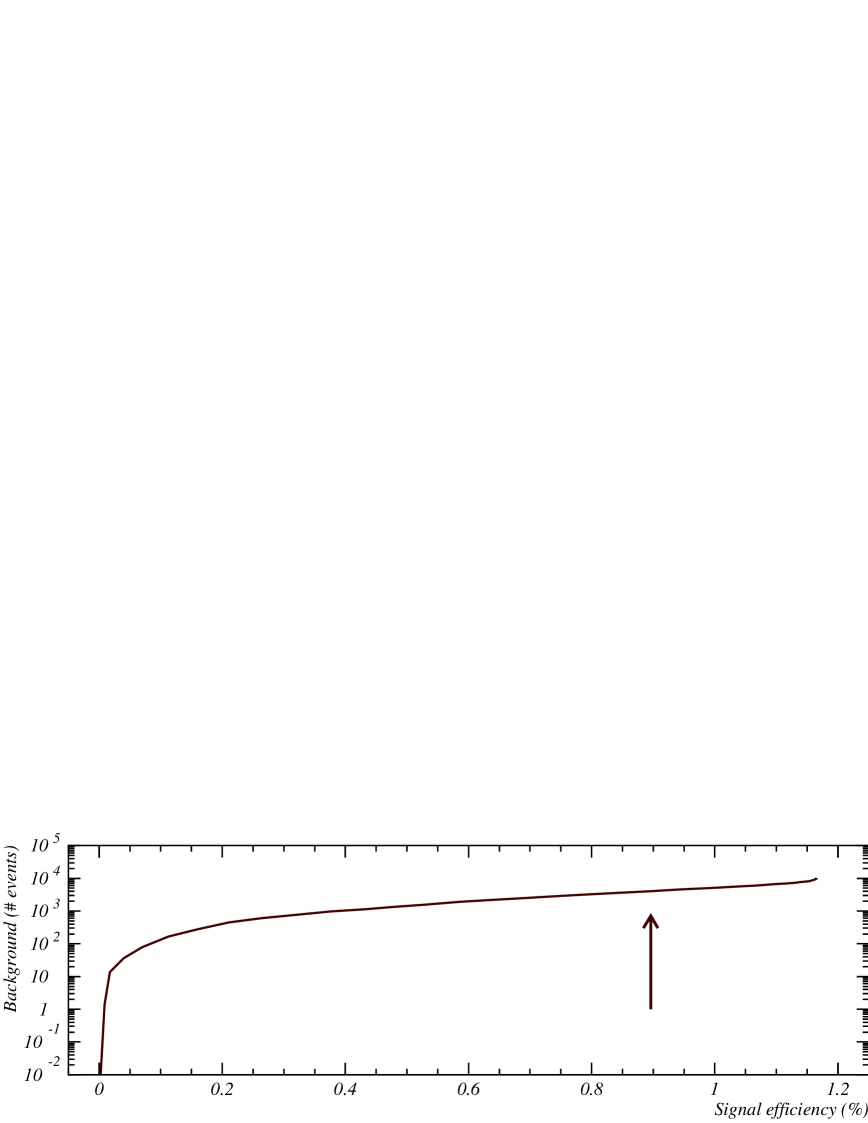
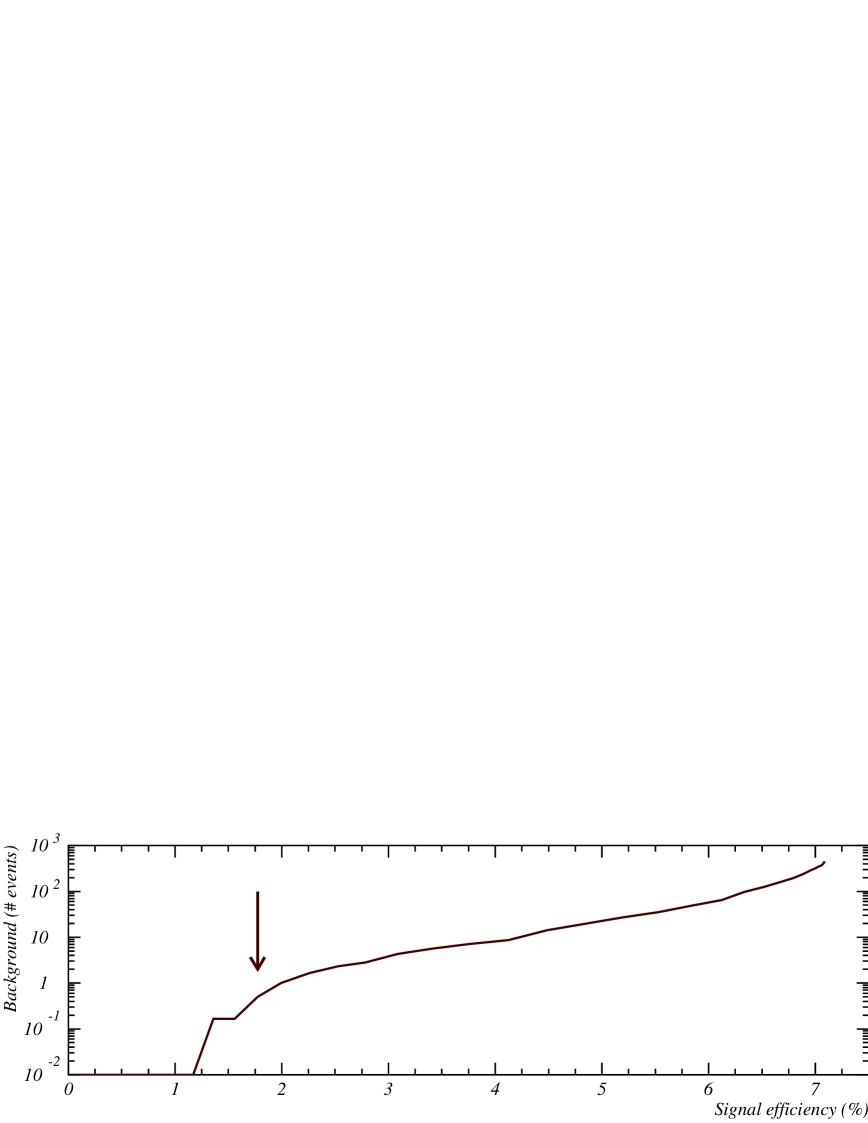
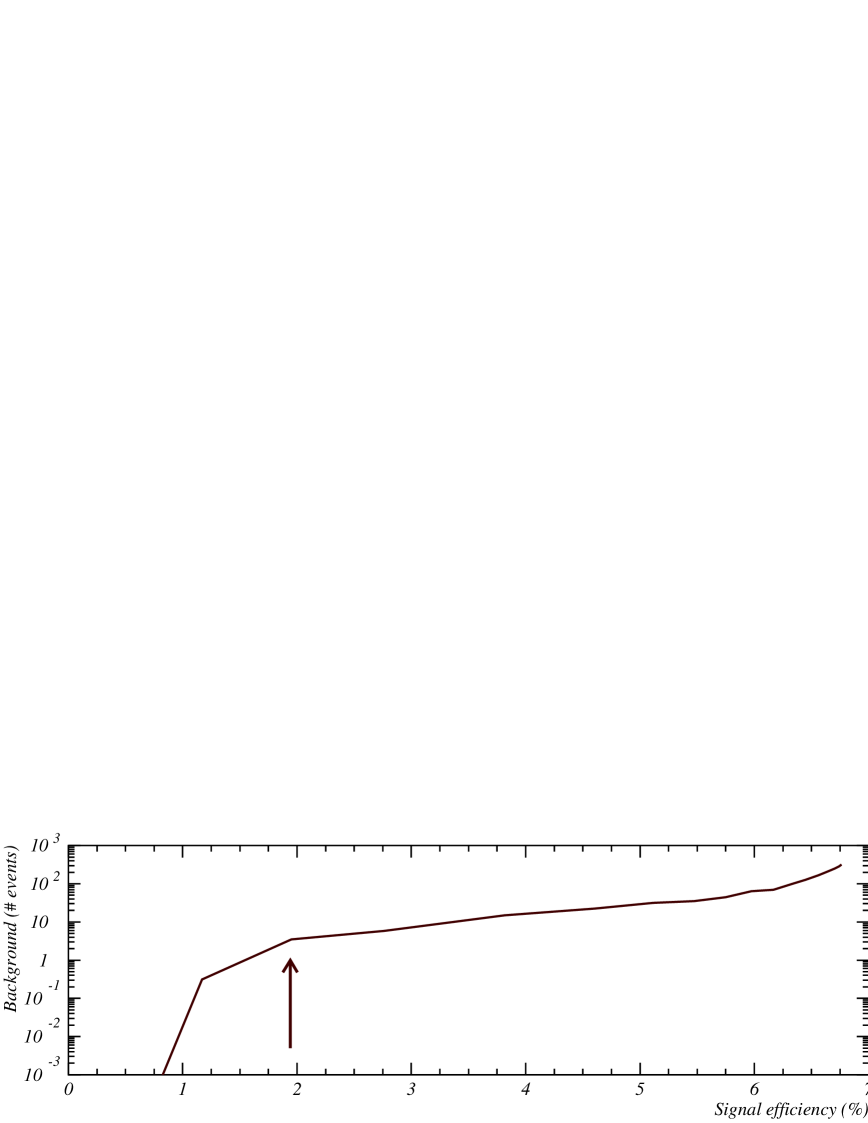
The distributions for SM background and signal are shown, after the final selection, in Fig. 8. The number of expected SM background as a function of the signal efficiency obtained by cutting the discriminant variable is shown in Fig. 9.
| Description | Signal | Background Processes | |||
|---|---|---|---|---|---|
| of | jets | single | |||
| Cuts | (%) | Nevt | Nevt | Nevt | Nevt |
| Preselection | 17.0 | 78.7 | 29.8 | 1514.2 | 24.3 |
| Final Selection | 7.1 | 13.1 | 1.7 | 434.2 | 4.8 |
3.2 channel
The final states corresponding to the FCNC decay are characterised by the presence of a high photon and a light jet from the top quark decay. Since the existence of the photon is not sufficient to reduce the QCD background, only the leptonic decays of the (originated from the SM decay of the other top quark) were considered. The final states corresponding to these signal events are characterised by a topology with two jets (one -jet from the SM top decay), one high photon, one lepton and missing transverse momentum from the undetected neutrino. Following a previous analysis [18], a new one was developed [17] and is described below.
After applying the general selection criteria described in section 3.1.3, a preselection was defined by requiring the events to have at least one photon with GeV and . Additionally, in order to prevent events to be simultaneously assigned to the and channels, a maximum of two leptons in the final state were allowed. The number of selected SM background events and the signal efficiency at the preselection level are shown in Table 5. The distributions of relevant variables for SM background and signal are shown in Fig. 10.
| Description | Signal | Background Processes | |||
|---|---|---|---|---|---|
| of | jets | single | |||
| Cuts | (%) | Nevt | Nevt | Nevt | Nevt |
| Preselection | 23.3 | 584.2 | 325.7 | 2832.4 | 206.2 |
| Final Selection | 6.9 | 15.2 | 7.7 | 271.6 | 23.0 |
The final event selection was done by requiring the leading photon to have GeV and one of the two jets with highest to be tagged as a -jet (only one -jet was allowed). This selection largely reduces the background, being the dominant contribution, as can be seen in Table 5. The FCNC top decay was reconstructed using the non- jet and the photon (in the cases were more than one photon or non- quark were available, the one with higher was chosen). No QCD () and jets events, within the generated statistics, passed the final selection criteria. Just like for the channel, a likelihood-based type of analysis was used. The p.d.f. were built based on the following variables (c.f. Fig. 11):
-
•
the mass of the -quark with FCNC decay, reconstructed from the photon and the non- jet ();
-
•
the transverse momentum of the leading photon () and
-
•
the number of jets.
3.3 channel
The final states of events with one of the top quarks decaying into a gluon, , are characterised by the presence of a high gluon and a light jet from the top quark decay. Only the leptonic decays of the (originated from the SM decay of the other top quark) were taken into account, otherwise the final state would be fully hadronic and the signal would be overwhelmed by the QCD background. The final states are thus characterised by the existence of at least three jets (one -jet from the SM top decay), one lepton and missing transverse momentum from the undetected neutrino.
Although no previous analyses have been performed for the decay, the anomalous coupling in top production was studied in the past [15, 19]. A new analysis dedicated to the decay was developed [17] and is described here.
As in this topology the FCNC top decay corresponds to a fully hadronic final state, a more restrictive event selection was necessary. The general selection criteria of section 3.1.3 was applied to the events. At the preselection, events were required to have only one lepton and no photons with transverse momentum above GeV, to reject events assigned to the other FCNC channels. The total visible energy () had to be greater than 300 GeV. At least three jets with and GeV were required. For the leading jet the cut was increased to GeV. The events were then classified as “3 jets” or “4 jets” if they had exactly three jets or at least 4 jets, respectively.
3.3.1 The “3 jets” sample
The preselection was completed by requiring only one -tagged jet in the event. The gluon jet was assumed to be the non- jet with the highest transverse momentum. This distribution is shown in Fig. 14, together with the mass of the -quark with FCNC decay (), reconstructed from the non- jets. The mass of the -quark with SM decay (, reconstructed according to section 3.1.3) is also shown. The number of selected SM background events and the signal efficiency at this level are presented in Table 6. The final event selection was done by requiring the gluon to have GeV and GeV. No generated QCD () events passed the final selection criteria.
| Description | Signal | Background Processes | ||||
|---|---|---|---|---|---|---|
| of | jets | single | jets | |||
| Cuts | (%) | Nevt | Nevt | Nevt | Nevt | Nevt |
| Preselection | 1.6 | 1356.6 | 427.1 | 24366.7 | 11328.2 | 23320.3 |
| Final Selection | 1.2 | 157.1 | 22.1 | 4985.6 | 1187.9 | 1813.3 |
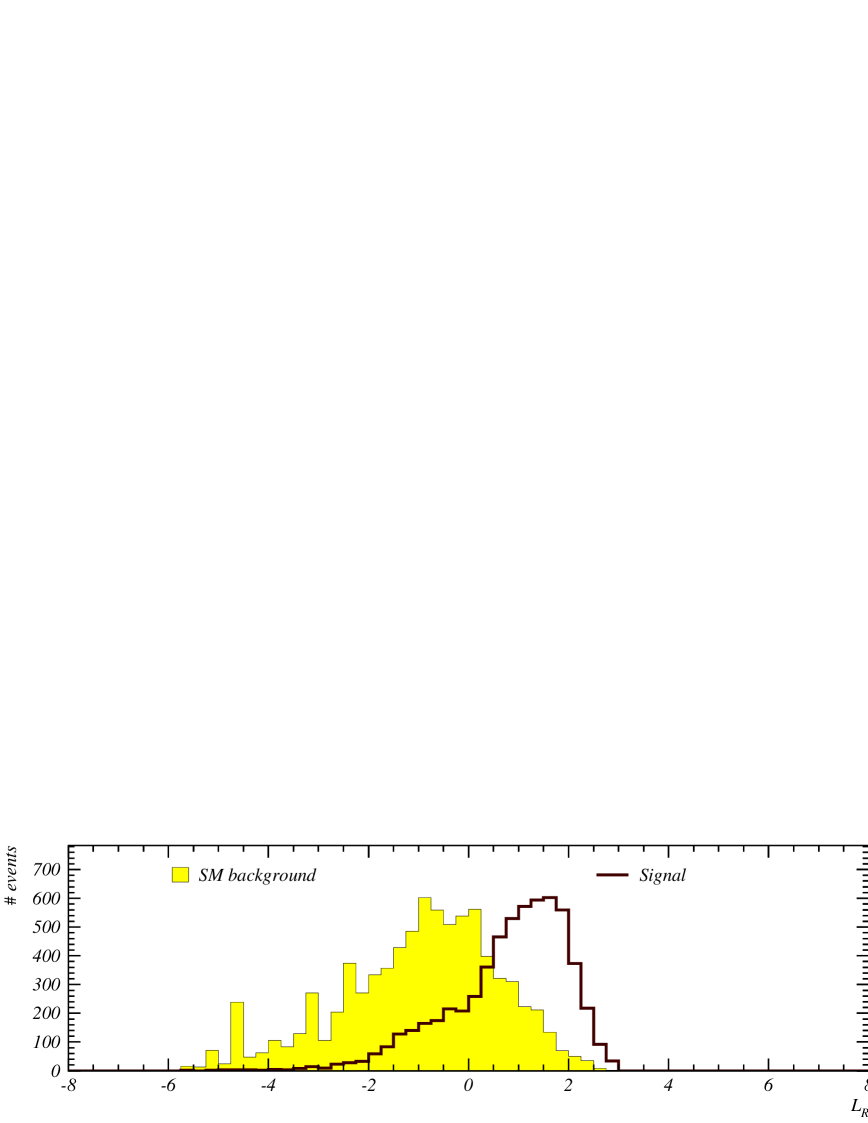
As for the other channels, a likelihood-based type of analysis was adopted, using the following variables to build the p.d.f. (c.f. Fig. 15):
-
•
the invariant mass,
-
•
the invariant mass,
-
•
transverse momentum of the -jet (),
-
•
transverse momentum of the second non- jet () and
-
•
angle between the lepton and the gluon ().
3.3.2 The “4 jets” sample
For this topology, the preselection was completed by requiring the fourth jet to have GeV and . Only one -tagged jet, which had to be among the first four, was allowed in the event. The gluon jet was assumed to be the non- jet with the highest transverse momentum. This distribution is shown in Fig. 18, together with the mass of the -quark with FCNC decay (), reconstructed from the two non- jets with the highest transverse momenta. The mass of the -quark with SM decay is also shown. The number of selected SM background events and the signal efficiency at this level are presented in Table 7.
| Description | Signal | Background Processes | ||||
|---|---|---|---|---|---|---|
| of | jets | single | jets | |||
| Cuts | (%) | Nevt | Nevt | Nevt | Nevt | Nevt |
| Preselection | 5.7 | 1171.0 | 305.2 | 216679.9 | 14263.1 | 12651.2 |
| Final Selection | 1.2 | 64.3 | 7.1 | 9142.1 | 453.3 | 379.5 |
The final selection was defined by requiring the gluon transverse momentum to be above GeV and the reconstructed mass of the -quark with FCNC decay above GeV and below GeV. As for the “3 jets” channel, no generated QCD () passed the final selection criteria.
After the final selection, the p.d.f. were built based on the following physical distributions (c.f. Fig. 19):
-
•
minimum invariant mass of the leading and the second non- jets or the leading and the third non- jets (),
-
•
the invariant mass,
-
•
transverse momentum of ,
-
•
transverse momentum of ,
-
•
angle between the lepton and the gluon (),
-
•
angle between the lepton and the -jet () and
-
•
angle between the gluon and the second non- jet ().
4 Results and systematic studies
Expected top quark FCNC decay branching ratios sensitivities of the ATLAS experiment were estimated for both the cut-based and likelihood-based analysis under two different hypothesis, as explained in the next subsections.
4.1 Branching ratio sensitivity ( significance discovery hypothesis)
Assuming a signal discovery with a significance, the branching ratio () sensitivity for each channel studied is estimated by:
| (5) |
where pb [13] is the NLO calculation of the SM cross-section for production in collisions at TeV. is the total number of selected background events, is the signal efficiency convoluted with the appropriate branching ratios and is the charged leptons identification efficiency ( is the number of leptons required for each channel). The factor 2 in the denominator takes into account the and contributions to the .
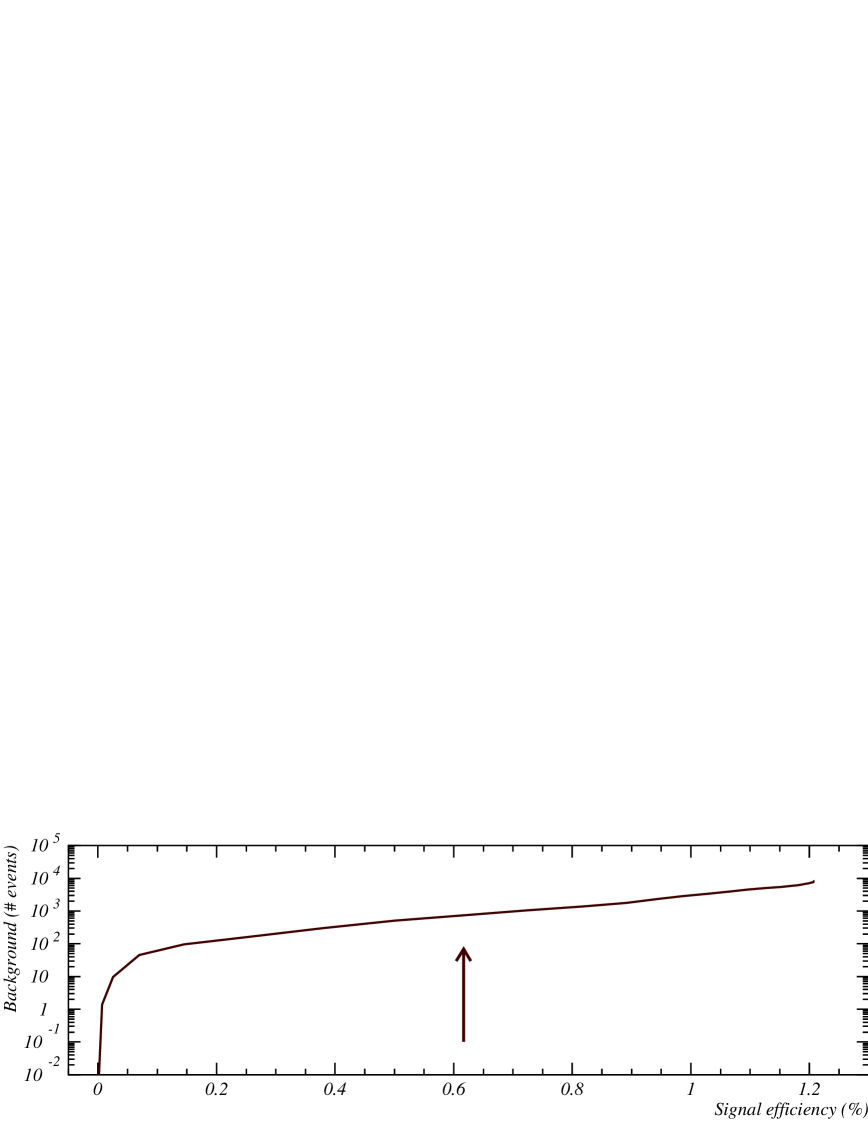
To evaluate the expected branching ratio sensitivities for a signal significance of discovery in the cut-based analyses, the kinematic cuts were applied in sequence for the signal and backgrounds. In the channels studied using likelihood-based analyses, the expected branching ratio sensitivities were evaluated after applying cuts to the discriminant variables, as given in Table 8 (see also Fig. 9, 13, 17 and 21). These cuts were optimised according to the best ( is the number of selected signal events). The expected branching ratio sensitivities for a discovery are shown in Table 9.
| channel | cut | (% ) | ||
|---|---|---|---|---|
| 0.50 | 0.06 | |||
| 3.48 | 0.62 | |||
| “3 jets” | 734.1 | 0.20 | ||
| “4 jets” | 4033.9 | 0.29 | ||
| channel | type | ( fb-1) | ( fb-1) | |
| cut-based | hadronic | [18] | ||
| leptonic | [18] | |||
| likelihood-based | leptonic | |||
| cut-based | – | [18] | ||
| likelihood-based | ||||
| likelihood-based | “3 jets” | |||
| “4 jets” |
4.2 95% confidence level limits (hypothesis of absence of signal)
In the absence of a FCNC top decay signal, expected limits at 95% CL can be derived. These limits were obtained for both the cut-based and the likelihood-based analyses, setting the charged lepton identification efficiency to .
For the cut-based analyses of the channel, the 95% CL upper limits were evaluated considering an integrated luminosity of 100 fb-1. Assuming the Poisson processes with backgrounds, 95% CL upper limits on the number of signal events for both decay modes were derived. The modified frequentist likelihood method [25] was used to evaluate the 95% CL upper limits for the likelihood-based analyses. The full information of the discriminant variables were used to derive 95% CL upper limits on the number of signal events for each channel. No cuts on the discriminant variables were used. Using the NLO calculation for , these limits were then converted into limits on the branching ratio for each of the studied FCNC top decay channels. The expected 95% confidence level limits on the branching ratios are summarised in Table 10.
| channel | type | ( fb-1) | ( fb-1) | |
| cut-based | hadronic | – | ||
| leptonic | – | |||
| combined | – | |||
| likelihood-based | leptonic | |||
| likelihood-based | ||||
| likelihood-based | “3 jets” | |||
| “4 jets” | ||||
| combined |
4.3 Systematic uncertainties and analyses stability
The effect of different systematic sources of uncertainty on the limits evaluation was studied for both the cut-based and the likelihood-based analyses. This estimation was done by considering the changes on the central values of the signal efficiency, number of background events and likelihood ratio distributions.
For the cut-based analysis of the channel several systematic uncertainties were studied. The effect of the mass window cut applied to the top quark (which decayed through the FCNC channel) was studied by selecting events in a more restrictive window i.e., GeV (). This results in a increase () on the 95% CL limit for the hadronic (leptonic) mode. Varying the cut applied to the jets from 50 to 40 GeV (leptonic mode) results in a relative change of the limit of [26]. This variation significantly increases the , the and partly the jets backgrounds. Changing the lepton isolation criteria (to ) gives a relative change of in the 95% CL limit.
For the likelihood-based analysis of the leptonic mode of , the and the channels, the following systematic uncertainties were considered. The effect of the top mass uncertainty was evaluated using different Monte Carlo samples with GeV and GeV. This systematic uncertainty affects both the event kinematics (and consequently the discriminant variables shape) and the value of the cross-section (used in the limits evaluation). The overall theoretical uncertainty on was estimated in reference [9]. The effect of this uncertainty was studied by allowing a change of 12% on the central value of , cross-section used both in the background normalisation and in the limits evaluation, assuming a negligible error on the measurement itself. If the error on the cross-section measurement is, for instance, 5%, the ATLAS sensitivity will be degraded but the change will not affect the order of magnitude of the results shown in this paper. For the and the channels, a 5% error gives a maximum change on the limit of 5%. For the channels, where the expected number of background is more important, the limit can change by a factor 2 to 3 (depending if it is the 3 or 4 jets topology). A precise measurement of the cross-section is, for this reason, of utmost importance. The CTEQ 5L PDF set was used in the Monte Carlo generation. A different PDF set (CTEQ 4M [20, 21]) was used to estimate the effect of this choice on the event kinematics. As mentioned in section 2, the ATLFASTB package was used to simulate the -tag algorithm with a -tag efficiency of 60%. In order to study the impact of the algorithm with a different efficiency, the -tagging efficiencies of 50% and 70% were also considered. This source of uncertainty affects the signal efficiency, background estimation and discriminant variable shapes. The impact of the knowledge of the absolute jet energy scale was estimated by recalibrating the reconstructed jet energy. A miscalibration of % for light jets and % for -jets was used. This uncertainty was found to have a negligible effect on the signal efficiency, background estimation and discriminant variable shapes. A jet energy miscalibration of % for all jets was also considered. For the , and (“3 jets”) channels the relative changes on the 95% CL expected limits were found to be below 7%. For the most difficult channel ( – “4 jets”) this effect is more important (up to 12%), due to the tighter selection criteria used to reject the large contribution from background. The stability of the cut-based analysis was studied by changing the preselection and final selection (typically a 10% variation on the cut values was considered). The discriminant variables were computed using the probability density function sets described in section 3. In order to estimate the effect of a different p.d.f. set, the following changes were studied: in the channel, the reconstruction was done by considering the jet closest to the reconstructed in the invariant mass evaluation. Similarly, the mass reconstruction in the channel was done using the jet closest to the leading . Moreover, the mass was included in the p.d.f. set and the multiplicity of jets with was chosen as p.d.f. (instead of the jet multiplicity). In the channel, was used instead of the angles, in the p.d.f.s definition.
The absolute value of the maximum relative effect on the 95% confidence level expected limits on each considered source of systematic uncertainty (the reference values are those presented in Table 10) is shown in Table 11 ( fb-1). Although differences up to % were observed (caused by the uncertainty of the top mass), the order of magnitude of the expected limits on the is not affected by any of the systematic uncertainties considered. Moreover, the change on the selection criteria and on the p.d.f. sets do not have a significant impact on the results.
| Source | ||||
|---|---|---|---|---|
| (3 jets) | (4 jets) | |||
| top mass | 18% | 13% | 8% | 7% |
| 11% | 11% | 9% | 7% | |
| PDFs choice | 15% | 7% | 3% | 6% |
| -tag algorithm efficiency | 16% | 5% | 18% | 17% |
| jet energy calibration | 2% | 1% | 2% | 3% |
| analysis stability | 9% | 12% | 3% | 13% |
| p.d.f.s choice | 10% | 15% | 1% | 2% |
5 Conclusions
The sensitivity of the ATLAS experiment to the FCNC () decays of the top quark was estimated. Different types of analysis (cut-based and likelihood-based) were used to obtain the FCNC branching ratio sensitivities (assuming a signal significance for discovery) or the 95% CL limits on the FCNC branching ratios (in the absence of signal). The leptonic mode of the channel was studied with both type of analysis which give complementary results: the best limit on the assuming a signal discovery with a significance is obtained with the cut-based analysis, while the 95% CL limit obtained with the likelihood-based analysis using the MFL method (which takes into account the shape of the discriminant variables) is better. The impact of systematic errors on the final results was also studied. The expected branching ratio sensitivities obtained by the different analysis and the previous ones [15, 18, 19] have the same order of magnitude, in the range from to (for fb-1). Even if the SM predicts a much lower branching ratio for the FCNC decays of the top quark, the expected branching ratios obtained in these analysis are several orders of magnitude better then present experimental limits.
Acknowledgements
We thank J. A. Aguilar-Saavedra, M. Cobal, M. David, P. Ferreira, D. Froidevaux, C. Marques, O. Oliveira, E. Richter-Was, R. Santos and S. Slabospitsky for the very useful discussions. This work has been performed within the ATLAS Collaboration, and we thank collaboration members for helpful discussions. We have made use of the physics analysis framework and tools which are the result of collaboration-wide efforts. This work was supported by FCT – Fundação para a Ciência e a Tecnologia through the grants SFRH/BD/13936/2003 and SFRH/BD/18762/2004.
References
- [1] S. L. Glashow, J. Iliopoulos, L. Maiani, Phys. Rev. D 2 (1970) 1285.
-
[2]
B. Grzadkowski, J. F. Gunion, P. Krawczyk,
Phys. Lett. B 268 (1991) 106;
G. Eilam, J. L.Hewett, A. Soni, Phys. Rev. D 44 (1991) 1473 and Erratum
ibid D 59 (1999) 039901;
M. E. Luke, M. J. Savage, Phys Lett. B 307 (1993) 387. - [3] G. M. de Divitiis, R. Petronzio, L. Silvestrini, Nucl. Phys. B 504 (1997) 45.
- [4] D. Atwood, L. Reina, A. Soni, Phys. Rev. D 53 (1996) 1199.
- [5] F. del Aguila, J.A. Aguilar-Saavedra and R. Miquel, Phys. Rev. Lett. 82 (1999) 1628.
- [6] J. A. Aguilar-Saavedra, Acta Phys. Polon. B 35 (2004) 2695 [arXiv:hep-ph/0409342].
- [7] W. Buchmuller and D. Wyler, Nucl. Phys. B 268 (1986) 621.
- [8] W. Hollik, J. I. Illana, S. Rigolin, C. Schappacher and D. Stockinger, Nucl. Phys. B551, 3 (1999) hep-ph/9812298.
- [9] M. Beneke et al., “Top Quark Physics”, in proceeding of the “Workshop on Standard Model Physics (and More) at the LHC”, CERN report 2000-004 (2000) 419 [hep-ph/0003033];
-
[10]
ALEPH Coll., A. Heister et al., Phys. Lett. B 543 (2002)
173;
DELPHI Coll., OPAL Coll., G. Abbiendi et al., Phys. Lett. B 521 (2001) 181;
L3 Coll., P. Achard et al., Phys. Lett. B 549 (2002) 290. - [11] ZEUS Coll., S. Chekanov, Phys. Lett.B 559 (2003) 153.
- [12] CDF Coll., F. Abe et al., Phys. Rev. Lett. 80 (1998) 2525.
- [13] R. Bonciani et al., Nucl. Phys. B529 (1998) 424; N. Kidonakis and R. Vogt, Phys. Rev. D68 (2003) 114014.
- [14] J. Campbell et al., Phys. Rev.D70 (2004) 094012; J. Campbell and F. Tramontano, Nucl. Phys. B726 (2005) 109.
- [15] Technical Design Report, ATLAS detector and physics performance, Vol.II, ATL-TDR-15, May 1999.
- [16] L. Chikovani, T. Djobava, “ATLAS sensitivity to the Flavour-Changing Neutral Current decay ”, ATL-PHYS-2001-007, March 1999; hep-ex/0205016, May 2002.
- [17] J.Carvalho, N.Castro, A.Onofre, F.Veloso, “Study of ATLAS Sensitivity to FCNC top decays”, ATL-PHYS-PUB-2005-009.
- [18] J. Dodd et al., “Study of ATLAS Sensitivity to Rare Top Quark Decays , ATL-PHYS-2003-016, May 1999.
- [19] O. Çakır, S.A. Çetin, “Anomalous single top quark production at the CERN LHC”, SN-ATLAS-2004-046, August 2004.
- [20] T. Sjöstrand et al., Comput. Phys. Commun. 135 (2001) 238.
- [21] S.R. Slabospitsky, L. Sonnenschein, Comput. Phys. Commun. 148 (2002) 87.
- [22] E. Richter-Was, D. Froidevaux, L. Poggioli, “ATLFAST 2.0 — a fast simulation package for ATLAS, ATL-PHYS-98-138, November 1998.
-
[23]
Athena - The ATLAS Common Framework,
http://atlas-computing.web.cern.ch
/atlas-computing/documentation/swDoc/AthenaDeveloperGuide-8.0.0-draft.pdf - [24] S. Eidelman et al., Phys. Lett. B592 (2004) 1.
-
[25]
DELPHI Coll., A.L. Read, DELPHI 97-158 PHYS 737 (1997);
A.L. Read, CERN report 2000-005 (2000) 81 - [26] L. Chikovani, T. Djobava, “Study of ATLAS sensitivity to FCNC top quark decay ”, hep-ex/0008010, Aug. 2000.
- [27] A. Juste, “Top quark current experimental status”, in proceeding of the “TOP 2006: International Workshop on Top Quark Physics”, PoS TOP2006:007,2006 (see presentation in http://nautilus.fis.uc.pt/personal/top2006/programme.shtml)
a) b) c) d)

a) b)

a) b)

a) b)
a) b)
c) d)
e) f)
a) b)
c)
a) b)
c)
a) b)
a) b)
c)
a) b)
c)
a) b)
c) d)
e)
a) b)
c)
a) b)
c) d)
e) f)
g)