The Belle Collaboration
Recent results on mixing from Belle
Abstract
We report on recent measurements of the mixing and violation parameters performed by the Belle experiment. The evidence for the mixing phenomena in the system of neutral mesons, arising in the study of decays is presented first. Using a time dependent Dalitz analysis of decays we also obtained the most precise up-to-date determination of the mass difference of the two meson mass eigenstates. The presented results are based on 540 fb-1 of data recorded by the Belle detector at the KEKB collider. We conclude with short prospects for the future measurements.
I Introduction
Measurements in the field of charmed hadrons experience a revival in the recent years. The reason for an increased interest is twofold: the B-factories provide for an abundant source of charmed hadrons. The integrated luminosity fb-1 of the KEKB collider KEKB corresponds to a production of around charmed hadron pairs in a clean environment of collisions. Secondly, a dual role of charm physics is exploited: as an experimental test ground for different theoretical predictions, most notably the lattice QCD, enabling in turn a more precise determinations of the Cabibbo-Kobayashi-Maskawa (CKM) matrix elements; and as a standalone field of various Standard model (SM) tests and searches of new physics (NP) phenomena.
Search for the mixing (a quest started soon after the discovery of mesons in 1976 goldhaber ) belongs to the latter category. It is governed by the lifetime of mesons, , and by the mixing parameters and . and denote the masses and widths of the mass eigenstates and , respectively,
| (1) |
is the average decay width. The mixing rate is severely suppressed due to the small SU(3) flavor symmetry breaking () and smallness of the CKM matrix element shipsey . Calculations based on the effective Hamiltonian (i.e. contribution of the box diagram, providing a satisfactory description of mixing in the systems of and mesons) yield a negligible mixing parameter magnitude . Long distance contributions to the - transitions are difficult to calculate. Approaches based on the operator product expansion bigi1 or summation over exclusive intermediate states, accessible to both and falk , result in and , respectively.

Regardless of large uncertainties of the predictions, the SM probability of meson to oscillate into its antiparticle before decaying, , is small, at most of the order . New as-yet-unobserved particles could contribute to the loop diagrams and thus significantly increase the value of . A limit of would put significant constraints on the parameter space of large number of NP models golowich . As an example a possibility of the fourth family of fermions, including a down-like quark of mass , may be considered (Fig. 1). An experimental value of would constrain the CKM matrix elements product for GeV/c2, a limit much more stringent than the one following from the current CKM matrix unitarity requirement. Similar parameter constraints can be put to 17 out of 21 NP models considered in golowich . The width difference (), on the other hand, is governed by decays into physical states, where no significant deviations from the SM have been observed up to date. However, is known to vanish in the limit of exact SU(3) flavor symmetry. Hence NP contributions not vanishing in this limit could affect the value of regardless of their small contribution to the decay amplitudes golowich2 .
Beside the possible effects on the mixing parameters, NP could produce a sizable violation of the symmetry () in meson decays nir . Within the SM the is expected to be small. Of the three types of the violation, in decays, in mixing and in the interference between mixing and decays, the first one is expected to be present only in the singly Cabibbo suppressed decays. To these, beside the tree amplitude also penguin diagrams () can contribute, and the existence of at least two amplitudes of different strong and weak phase is a necessary condition for this type of violation to occur pdg_cpv . The weak phase difference between the two amplitudes is , which represents a rough estimate of the expected effect shipsey . The asymmetries due to in mixing and interference can be expressed as and , respectively, where is the weak phase between the mixing and decay amplitudes. Hence the magnitude of these types of is even smaller. Observation of the violation an order of magnitude larger than these expectation would clearly point to the intervention of NP.
The presented studies were carried out by the Belle detector, a general purpose full solid-angle spectrometer belle operating at the asymmetric KEKB collider KEKB . The center-of-mass (CMS) energy of the collisions corresponds to the mass of the , decaying to a pair of mesons. In addition to the production, the cross section for the continuum production of and quark pairs through a virtual photon exchange at this energy is several times larger. In the presented measurements the mesons produced in are reconstructed 111Unless explicitly noted, mentioned processes and particles imply also the charge conjugated ones.. Two main features of the detector are exploited for this purpose. The identification of detected charged tracks is performed using a combined information from several detector sub-modules nakano . An illustration of the performance can be given by the efficiency for the charged kaon identification, , with the misidentification rate for tracks with momenta between 1 GeV/ and 3.5 GeV/. A silicon vertex detector enables a precise determination of the decay time of short-lived particles. For decays, the distribution of estimated uncertainties on peaks at around and has an average of (see Fig. 2, left staric ); is the world average value of the lifetime PDG .


II Measurements
There is a long list of measurements devoted to the - mixing from the Belle collaboration. Both, semileptonic urban and hadronic decays liming1 have been exploited in the past. The most sensitive recent measurements, using decays to a eigenstate (, with ) staric and to a self-conjugate final state () liming2 , are presented in this paper.
There are several methods and selection criteria in common to the presented measurements. In order to search for events where a undergoes a transition to the flavor of the initially produced neutral meson must be tagged. This is achieved by reconstruction of decays or . The charge of the characteristic low momentum pion tags the flavor of the initially produced meson. The energy released in the decay,
| (2) |
has a narrow peak for the signal events and thus helps in rejecting the combinatorial background. Here, is used to denote the invariant mass of the decay products, and for the nominal mass of . mesons produced in decays have different decay time distribution and kinematic properties than the mesons produced in continuum. In order to obtain a sample of neutral mesons with uniform properties we require the momentum of the reconstructed mesons in the CMS to be larger than 2.5 GeV/c2. Since the momentum of in is kinematically constrained, this requirement completely rejects the ’s from the latter source. Last but not least, the selection criteria are optimized using the MC simulation, in order not to bias the results of the measurements.
II.1 Evidence for charm mixing in
In the limit of no the mass eigenstates of neutral charmed mesons, with distinct values of lifetime , are also eigenstates. Hence only the mass eigenstate component of with the eigenvalue equal to the one of contributes to decays. By measuring the lifetime of in decays to one determines the corresponding or . On the other hand, both states contribute in decays to non- final states, like . The measured value of the effective lifetime in the latter process corresponds to a mixture of and . By explicit writing of decay time rates in the presence of oscillations, and taking into account , one derives a relation between lifetimes as measured in and in decays to a mixed final state to be bergman
| (3) |
with denoting the eigenvalue of . represents the effective lifetime as measured in decays to non- eigenstates () and the relative difference of the lifetimes is described by the parameter .
The final states are eigenstates with . The ratio of lifetimes measured in these decays and in the yields the value of :
| (4) |
Expressed in terms of the mixing parameters, reads bergman
| (5) |
with and describing the in mixing and interference between mixing and decays, respectively. If for the moment the possibility of is neglected (; search for the is described separately in a later section), one notes that . The described method of determination has been exploited in staric .
Selection of the candidate decays is based on (where is the decay channel dependent resolution), and . Distributions of and for are shown in Fig. 3.
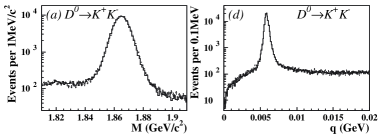
The signal yields and purities of selected and samples, following from the fit to the tuned simulated samples, are given in Table 1. The amount of background in all three reconstructed channels is low.
| Final state | Signal yield | Purity |
|---|---|---|
| 111 | 98% | |
| 1220 | 99% | |
| 49 | 92% |
Final state tracks are refitted to a common decay vertex. The production point is found by constraining the momentum vector and from the decay to originate from the interaction region. The proper decay time is calculated as a projection of the vector joining the two vertices onto the momentum of , . To determine we perform a simultaneous binned likelihood fit to the decay time distributions in the three decay modes, with lifetimes related by a free parameter .
The distributions are described as a sum of the signal and background contribution . The signal contribution is a convolution of an exponential and a detector resolution function :
| (6) |
The composition of the resolution function is illustrated in Fig. 2, left. Normalized distributions of estimated , based on the uncertainties of the decay length determination, are plotted for individual decay channels. In an ideal case each value represents a Gaussian resolution term with a weight . Study of the normalized residual distributions, , however, reveals that they cannot be described by a single Gaussian function. They are well described by the sum of three Gaussians, , with weights , widths and a common mean . It follows that each represents a resolution term composed of three Gaussians. The final parametrization of the resolution function is thus
| (7) |
with . The scale factors are introduced to describe small differences between the simulated and real .
The background distribution is represented by a sum of an exponential and function, convolved with the resolution function parametrized as above. Parameters of are determined from fits to distributions of events in the sidebands.
Several running periods, coinciding with changes to the detector, were identified based on the resulting . For one of the periods the resolution function (7) is modified to be slightly asymmetric in order to yield a consistent lifetime. This is achieved by introducing a decay mode dependent difference of ’s of the first two Gaussian terms in . This behaviour has been reproduced by generating a special MC sample which includes a small additional misalignment between the vertex detector and central drift chamber of the Belle detector. The lifetime measured in decays shows a good consistency among the running periods as well as with the world average value PDG (Fig. 2, right).
Simultaneous fits to decay time distributions of and were performed for individual running periods and the resulting values averaged to obtain the final result. Fits are presented in Fig. 4(a)-(c) by summing the data points and the fit function values. The agreement of the fit function with the data is excellent, . The same is true for all individual fits as well. The final value obtained is
| (8) |

The largest systematic uncertainties follow from the assumption of equal for different decay channels (estimated by relaxing this constraint), possible deviations of acceptance dependence on decay time from a constant (estimated by a fit to the generated distribution of reconstructed MC events) and variation of selection criteria (effect estimated using high statistics MC samples).
The resulting deviates from the null value by more than 3 standard deviations (more than 4 standard deviations considering the stat. error only) and represents a clear evidence of mixing, regardless of possible . The difference of lifetimes is made visually observable by ploting the ratio of decay time distributions for decays to and in Fig. 4(d).
II.2 Measurement of charm mixing parameters in
To a hadronic multi-body final state several intermediate resonances can contribute. In a specific example of the self-conjugated mode contributions from Cabibbo favored decays (e.g. ), doubly Cabibbo suppressed decays (e.g. ) and decays to eigenstates (e.g. ) are present. Individual contributions can be identified by analyzing the Dalitz distribution of the decay (see Fig. 5).
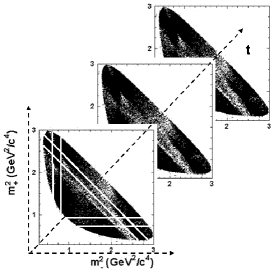
Different types of intermediate states exhibit also a specific time evolution (due to their specific superposition from the mass eigenstates). While the decay time distribution of eigenstates depends on the parameter , the evolution of doubly Cabibbo suppressed decays depends on and , where is a strong phase difference between these and the corresponding Cabibbo favored decays. Since in decays to both types interfere it is possible to disentangle the relative phase by performing a fit to the Dalitz distribution. This in turn enables a direct determination of the mixing parameters and instead of their rotated versions and . The method was successfully exploited in liming2 .
The two Dalitz variables are defined as and . Decay time dependent matrix element for decay, where the initially produced meson is a , is written as
| (9) |
In the above expression and are the instantaneous amplitudes for and decays. The dependence on the mixing parameters arises upon squaring the matrix element in which . describing the decay of an initially produced is written in an analogous form. Neglecting one finds .
Amplitudes for decays are parametrized in the isobar model as a sum of Breit-Wigner resonances and a constant non-resonant term:
| (10) |
Functions are products of Blatt-Weisskopf form factors and relativistic Breit-Wigners cleo_Dalitz . The described signal distribution is convolved by the detector mass resolution function (for invariant mass only) and multiplied by dependent efficiency. The expected decay time distribution is convolved with a resolution function described by a sum of three Gaussians with a common mean. The mean and scale factors for the widths of the resolution function are free parameters of the fit.


The isolation of signal is based on and variables, described in the previous section. Selected sample of decays used for the measurement consists of signal decays with a purity of 95%. Fractions of individual backgrounds are obtained from the two-dimensional fit of and distributions.
The Dalitz distribution of combinatorial background (4%) is obtained from events in the sidebands. This probability density function (p.d.f.) is multiplied by a sum of an exponential and functions to represent the distribution, and convolved with the same resolution function as for the signal. The background with a true and a random slow pion represents 1% of the sample. The p.d.f. of this background is the same as the one of the signal.
An unbinned likelihood fit is performed to distribution of events in the signal region. Results of the fit in which we neglect possible are projected to the Dalitz variables in Fig. 6. The Dalitz model which includes 18 intermediate states represents a good description of the data.
The effective value of the lifetime following from the fit, fs, is in good agreement with the world average value PDG . The decay time projection of the fit is presented in Fig. 7.

Finally, the result for mixing parameters is
| (11) | |||
| (12) |
The systematic uncertainties are divided into two categories: uncertainties related to the Dalitz model, and others. The former are estimated by repeating the fit with the K-matrix parametrization of the scalar resonances, and by estimating possible biases in the ratios of doubly Cabibbo suppressed and Cabibbo favored decays using the simulation. The largest uncertainty in the latter category arises from the variation of the selection on the CMS momentum and from the assumption of factorization of the Dalitz and decay time distributions of combinatorial background (estimated by using Dalitz distribution of combinatorial background from different intervals).
The resulting value of the mass difference is the most precise measurement of this parameter, improving the precision of the previous measurement cleo_x by an order of magnitude.
II.3 Search for
The value of measured in depends on the parameters describing violation (eq. (5)). The definition of the parameters is bergman
| (13) |
where is a sign of the in mixing and of the in the interference between mixing and decay. In decays to a eigenstate one can define a asymmetry:
| (14) |
which can be expressed in terms of fundamental parameters as
| (15) |
Hence by separately measuring the lifetime of and tagged decays, we measure staric
| (16) |
Systematic uncertainty receives similar contributions as in the case of measurement. The in mixing and interference is thus not observed with a sensitivity of .
To search for in decays a more general fit than the one described in the previous section is performed liming2 . In addition to previous parameters we allow for and . To check for a possibility of in decays the parameters and of Eq. (10) are allowed to be different for and decays. The resulting Dalitz parameters are consistent for the two samples and no sign of in decays is observed. Results of the consequent fit assuming no direct are
| (17) |
Also this measurement shows no evidence of .
The 95% confidence level region in plane, following from the no- and allowed fits to decays, is shown in Fig. 6, top left. It should be noted that if the parameters are left free in the fit, the solution is an equally probable solution as the . In terms of Fig. 6 this means that contours reflected over the point also represent an allowed region of parameters space. A peculiar shape of the allowed contour in the vicinity of the point is a consequence of no possible in mixing or in interference between mixing and decays when (in rest of the region the sensitivity of measurement is spread among two mixing and two parameters; close to the sensitivity of the measurement is mainly to and and thus the likelihood function becomes steeper).
Belle also obtained a preliminary result of - and Dalitz plane-integrated search in meson decays to . The amount of signal and backgrounds in the selected sample is determined by a fit to and distributions, shown in Fig. 8.

The number of decays is calculated from the Dalitz distribution of events by subtraction of the background. Background distribution is determined using MC simulation and the uncertainty due to the modelling is included in the systematic error. The background subtracted yield is corrected for the efficiency in bins of Dalitz plane. By performing the described calculation separately for and tagged decays, we obtain
| (18) |
III Outlook and summary
Belle has recently presented a first evidence of mixing in decays of charmed mesons to eigenstates staric and the most precise measurement of the mass difference in the neutral charmed meson system liming2 . The 68% confidence regions of mixing parameters and arising from the two measurements are presented in Fig. 9.

The charm subgroup of the Heavy Flavor Averaging Group HFAG has at the time of the conference presented world averages of measurements in the field of charm mixing and . By summation of the likelihood curves depending on various observables (and thus accounting for non-Gaussian distribution of some experimental uncertainties) the 2-dimensional contours in plane are presented in Fig. 10.

The shape of the contours is a non-trivial result of summing likelihoods of specific shapes. Especially the constraints arising from the decays, when rotated in plane due to the uncertainty in knowledge of the strong phase difference , exhibit an almost circular region of increased values around the point.
The average central values are found to be
| (19) |
The no-mixing point is excluded at more than standard deviations.
Due to a larger number of free parameters the method of averaging experimental results which allow for a possibility of is a minimization. Nevertheless the results for the mixing parameters are almost unchanged, and parameters are consistent with no violation of the symmetry:
| (20) |
The world averages are dominated by results from the existing B-factories, with a significant contribution from Cleo-c and Tevatron other_lp . The results presented in this paper were obtained by the Belle collaboration using around one half of the expected full data set. The experimental errors are mainly dominated by statistical uncertainties and will thus improve in the next year. However, considering the uncertainty of the SM predictions as well as the small expected within, it is unlikely that the full range of high scientific interest in the measurements of the charm mixing will be fulfilled by the end of the data taking of Belle and BaBar. It is thus instructive to make an attempt of predicting the accuracy that may become available at some of the future experiments. In Table 2 the expected one standard deviation errors on the key parameters are given for an average of measurements to be performed at the proposed Super-B factory. The values are estimated by scaling the current Belle statistical sensitivity and an educated guess on possible improvements of systematic uncertainties. Two values of expected integrated luminosity are considered; the lower one represents a modest data sample that could be collected at the Super-B factory while the higher one is an ultimate goal. The ’s shown are of course to be taken with a grain of salt since the systematic errors which are difficult to estimate are important if not the dominating part of the total error. Nevertheless they are worth presenting, if for nothing else then for an easy-to-remember pattern.
| Parameter | ab-1 | ab-1 |
|---|---|---|
| 0.1% | 0.07% | |
| 0.1% | 0.07% | |
| 0.1 | 0.07 | |
| 0.1 rad | 0.07 rad |
The expected sensitivities can be compared to expectations from the LHCb experiment scheduled to start data taking in the coming year. With fb-1 (expected to be collected in around 5 years of running at the nominal luminosity) one hopes for , and lhcb . These estimates can be roughly placed in between ab-1 and ab-1 expectations from the Super-B factory.
Considering the results presented in this and other charm mixing related papers submitted to the conference, it is fair to say that the year 2007 (31 years after the meson discovery) was the year of experimental confirmation of the mixing (to be compared to the time span of 6 years between similar observations in system, 4 years in system and 14 years in the case of mesons). At the moment we are facing a somewhat rare situation of experimental evidence without an accurate theoretical guidance on whether the phenomenon is entirely due to the SM physics or not. The largest interest determining the work ahead lies in a precise determination of and search for the violation in the charm sector. For it is in this field of measurements where we can expect an answer to the above question. Observation of effects at the existing facilities would be a sign of NP. A proposed Super-B factory would enable searches for the asymmetries to the level, a range covered by the current SM expectations and thus an interesting area of search for NP to appear.
References
- (1) S. Kurokawa, E. Kikutani, Nucl. Instr. Meth. A499, 1 (2003), and other papers in this volume.
- (2) G. Goldhaber et al., Phys. Rev. Lett. 37, 255 (1976).
- (3) G. Burdman, I. Shipsey, Ann. Rev. Nucl. Sci. 53, 431 (2003).
- (4) I.I. Bigi, N. Uraltsev, Nucl. Phys. B592, 92 (2001).
- (5) A.F. Falk et al., Phys. Rev. D69, 114021 (2004).
- (6) E. Golowich et al., arXiv:0705.3650, subm. to Phys. Rev. D.
- (7) E. Golowich, S. Pakvasa, A.A. Petrov, Phys. Rev. Lett. 98, 181801 (2007).
- (8) For a review of new physics effects in singly suppressed decays see Y. Grossman, A.L. Kagan, Y. Nir, Phys. Rev. D75, 036008 (2007).
- (9) For definition of different types of see the review D. Kirkby, Y. Nir, CP Violation in Meson Decays, in reference PDG .
- (10) A. Abashian et al. (Belle Collaboration), Nucl. Instr. Meth. A479, 117 (2002).
- (11) E. Nakano, Nucl. Instr. Meth. A494, 402 (2002).
- (12) M. Starič et al. (Belle Coll.), Phys. Rev. Lett. 98, 211803 (2007).
- (13) W.-M. Yao et al. (Particle Data Group), J. Phys. G33, 1 (2006).
- (14) U. Bitenc et al. (Belle Coll.), Phys. Rev. D 72 , 071101(R) (2005).
- (15) L.M. Zhang et al. (Belle Coll.), Phys. Rev. Lett. 96, 151801 (2006); J. Li et al. (Belle Coll.), Phys. Rev. Lett. 94, 071801 (2005); K. Abe et al. (Belle Coll.), Phys. Rev. Lett. 88, 162001 (2002).
- (16) L.M. Zhang et al. (Belle Coll.), Phys. Rev. Lett. 99, 131803 (2007).
- (17) S. Bergmann et al., Phys. Lett. B 486, 418 (2000).
- (18) S. Kopp et al. (Cleo Coll.), Phys. Rev. D 63 , 112009 (2001).
- (19) D.M. Asner et al. (Cleo Coll.),Phys. Rev. D 72 , 012001 (2005).
-
(20)
D. Asner, B. Golob, B. Petersen, A. Schwartz,
http://www.slac.stanford.edu/xorg/hfag/
charm/index.html - (21) See presentations by W. Lockman, K. Tollefson and R. Briere at the conference.
- (22) P. Spradlin, G. Wilkinson, F. Xing, LHCb public note LHCb-2007-049 (2007).