Photometric Properties and Scaling Relations of Early Type Brightest Cluster Galaxies
Abstract
We investigate the photometric properties of the early type Brightest Cluster Galaxies (BCGs) using a carefully selected sample of 85 BCGs from the C4 cluster catalogue with redshift less than 0.1. We perform accurate background subtractions, and surface photometry for these BCGs to 25 in the Sloan -band. By quantitatively analysing the gradient of the Petrosian profiles of BCGs, we find that a large fraction of BCGs have extended stellar envelopes in their outskirts; more luminous BCGs tend to have more extended stellar halos that are likely connected with mergers. A comparison sample of elliptical galaxies was chosen with similar apparent magnitude and redshift ranges, for which the same photometric analysis procedure is applied. We find that BCGs have steeper size-luminosity () and Faber-Jackson () relations than the bulk of early type galaxies. Furthermore, the power-law indices ( and ) in these relations increase as the isophotal limits become deeper. For isophotal limits from 22 to 25 , BCGs are usually larger than the bulk of early type galaxies, and a large fraction () of BCGs have disky isophotal shapes. The differences in the scaling relations are consistent with a scenario where the dynamical structure and formation route of BCGs may be different from the bulk of early type galaxies, in particular dry (dissipationless) mergers may play a more important role in their formation; we highlight several possible dry merger candidates in our sample.
keywords:
galaxies : E/S0s — galaxies: cD — galaxies: cluster of galaxies — galaxies : photometry — galaxies1 INTRODUCTION
The Brightest Cluster Galaxies (BCGs) are the most luminous and most massive galaxies in the universe. BCGs are located close to the centre of the clusters of galaxies based on the X-ray observations or gravitational lensing observations (e.g., Jones & Forman 1984; Smith et al. 2005). It was noted very early on that some BCGs show an excess of light (‘envelopes’) over the de Vaucouleurs () profile at large radii (Matthews et al. 1964; Oemler 1973, 1976; Schombert 1986, 1987, 1988; Graham et al. 1996), and a large fraction of BCGs are termed as cD galaxies (e.g., Patel et al. 2006). Although the origin of such extended envelopes is still not completely clear (e.g., Patel et al. 2006), the extended stellar halos of BCGs to surface brightness are likely from BCGs themselves: the intra-cluster light has much lower surface brightness and only dominates at large radius (; for detailed discussions, see Zibetti et al. 2005; Bernardi et al. 2007; Lauer et al. 2007).
There has been debate on the formation mechanisms for BCGs and cD galaxies. Several mechanisms have been proposed, such as galactic cannibalism (the merging or capture of cluster satellites due to dynamical friction, Ostriker & Tremaine 1975; White 1976; Ostriker & Hausman 1977), tidal stripping from cluster galaxies (Gallagher & Ostriker 1972; Richstone 1975, 1976; Merritt 1985), and star formation on BCGs by cooling flows (e.g., Fabian 1994). Therefore, it is important to study the photometric properties of BCGs using large and homogeneous BCG samples, which has now become available due to large surveys such as the Sloan Digital Sky Survey (SDSS; for earlier studies, e.g. Postman & Lauer 1995, see references below). Moreover, the statistical properties of the extended envelopes of BCGs may also help to understand how the BCGs form and evolve, especially when combined with high-redshift cluster samples such as EdisCS (White et al. 2005).
Recently, there has been much progress in this area from both observational and theoretical fronts. Observations show that BCGs have distinct properties from the bulk of elliptical galaxies. The size-luminosity relation and Faber-Jackson relation ( relation) for BCGs are significantly steeper than those of non-BCG elliptical galaxies (Lauer et al. 2007; Bernardi et al. 2007; Desroches et al. 2007; von der Linden et al. 2007). It implies that BCGs are larger and have lower velocity dispersions than non-BCG elliptical galaxies, which confirms the pioneering work based on a small BCG sample by Oegerle & Hoessel (1991). The differences between BCGs and non-BCG elliptical galaxies demonstrate that the BCGs may form in a qualitatively different way from non-BCG elliptical galaxies (De Lucia & Blaizot 2007). Furthermore, the steeper relation for BCGs than those of non-BCG elliptical galaxies leads to a contradiction in the prediction of black hole (BH) masses using the or relationships. The usual relation cannot predict black hole masses larger than in the universe, which is inconsistent with values estimated by other means (Lauer et al. 2007).
Recent simulations and semi-analytic works in the cold dark matter hierarchical structure formation framework provide a plausible picture for the formation of BCGs: they tend to form at high-density peaks when their inhabited dark matter halos collapse at high redshift, and then X-ray driven cooling flows allow a rapid collapse and the formation of a stellar component (Cowie & Binney 1977; Fabian & Nulsen 1977; Fabian 1994). While more than half of the stellar mass in the BCGs may have formed before redshift three, BCGs still grow substantially through dry (dissipationless) mergers when their host massive halos accrete and merge with other halos since redshift one (Gao et al. 2004; De Lucia & Blaizot 2007). This picture is largely consistent with observations, which does not require cooling flows to provide the cold gas if BCGs form late; it also overcomes a potential problem that the merger rate in clusters may be too low due to the high velocity dispersion in dynamically relaxed clusters. Furthermore, dry mergers have been directly observed in cluster environments as well as in the field (e.g., Lauer 1988; van Dokkum 2005; Tran et al. 2005; Bell et al. 2006). However, there are still no systematic investigations on the formation of cD-like BCGs galaxies, especially how the extended stellar halos of cD galaxies form: whether they appear during the dry merger phase, and whether they are the primary cause of the distinct properties of BCGs. There is also no agreement about the contributions of the intra-cluster light (e.g., Gonzalez et al. 2005; Zebetti et al. 2005; Lauer et al. 2007).
The C4 cluster catalogue (Miller et al. 2005) with 748 cluster of galaxies was constructed from the spectroscopic data of Second Data Release (DR2) of the Sloan Digital Sky Survey (SDSS). This is one of the largest published homogeneous database of nearby clusters and groups (). In principle, it is suitable for statistical studies of BCGs (see also the more recent, much larger maxBCG catalogue of 13,823 clusters of Koester et al. 2007). Based on BCGs from this published cluster catalogue, or the un-published C4 cluster catalogue selected from SDSS DR3, Bernardi et al. (2007) and von der Linden et al. (2007) find that BCGs have different properties, in particular their scaling laws, from non-BCG early type galaxies. Their results are, however, not entirely consistent with each other, which could be due to different sample selections or photometry methods. In fact, the slope indices in the size-luminosity and Faber-Jackson () relations found by Bernardi et al. (2007) are also significantly different from those of Lauer et al. (2007), although the trends are the same and these two groups use similar methods to measure luminosities and effective radius ; both are based on fitting the law to the band surface brightness profiles within 50 kpc or to some surface brightness limit of the BCGs. However, the samples they used are different. Lauer et al. (2007) use their own all sky, volume limited (z0.05) survey of 119 BCGs with precise ground-based surface photometry (Postman & Lauer 1995). Therefore, it is worth investigating whether sample selections and photometry can lead to inconsistencies on scaling laws. In this paper, we construct a different, nearby (with redshift ) BCG sample based on the C4 cluster catalogue, and perform our own photometry. In particular, we examine how the scaling relations change when different isophotal limits are applied, and compare the results with those of Bernardi et al. (2007), Lauer et al. (2007) and von der Linden et al. (2007).
The outline of the paper is as follows. In §2 and §3 we describe the selection of our local BCG sample and photometric data reduction. We present our main results in §4 and finish with a discussion & summary in §5. Throughout this paper we adopt a cosmology with a matter density parameter , a cosmological constant and a Hubble constant of ().
2 SAMPLE
Our early type BCG sample is drawn from the early version of the C4 cluster catalogue (Miller et al. 2005). Given that BCGs are located near the centre of clusters of galaxies which is often crowded with galaxies and contaminated by intra-cluster light, to ensure the reliable photometric measurement with high enough SN ratio for each sample BCG to mag/arcsec2 that is significantly higher than the intra-cluster light (Zibetti et al. 2005; Lauer et al. 2007; Bernardi et al. 2007), we restrict our BCG sample to be brighter than 14.5 mag in the SDSS -band model magnitude. After we exclude 10 duplicated objects (Bernardi et al. 2007), there are 114 galaxies selected out of a total of 748 BCGs in the C4 cluster catalogue.
Due to fiber collisions in the spectroscopic data, it is necessary to incorporate the SDSS photometric catalogue to avoid missing BCGs using the C4 algorithm. The DR2 version of the C4 catalogue tried to correct for this by selecting the brightest cluster galaxy based on the photometric catalog. However, as several works (e.g., Bernardi et al. 2007; von der Linden et al. 2007) noticed, some stars or spiral galaxies (some of these are located at the edge of clusters) have been mis-classified as BCGs. we thus performed visual inspections of two-colour images in the -band and -band for all the 114 BCG candidates and their clusters in a region of and , respectively. We found that C4 1024, C4 2092, C4 2097, C4 2031, C4 2109, C4 3021 and C4 3268 are seriously contaminated by adjacent bright stars or foreground galaxies; C4 3047 is located at the edge of the corrected frame (Stoughton et al. 2002); C4 3235 is a star; C4 2178 and C4 3257 are nearly edge-on galaxies with dust lanes. In addition, there are 5 objects (C4 1265, C4 1332, C4 2130, C4 3098, and C4 3205) whose parent cluster richness, defined as the number of galaxies within 1 , is less than 10, and hence they may be wrong identifications. In the remaining 98 objects, there are 10 BCGs that are late type galaxies with obvious spiral arms (C4 1023, C4 1053, C4 1324, C4 1366, C4 2001, C4 3016, C4 3143, C4 3246, C4 3282, and C4 3286). These are also excluded from our early type BCG sample, leaving us with 88 possible early-type BCGs. We further excluded 3 objects (C4 1048, C4 1186 and C4 3285) with that are fainter than galaxies ( for , see Blanton et al. 2003a) and they are unlikely BCGs (Bernardi et al. 2007). The detailed information for all 29 rejected objects are listed in Table 1. Our final sample consists of 85 BCGs that are in the redshift mange of 0.03z0.09 and band (model) apparent magnitude in .
Furthermore, we carefully searched for the second ranked cluster galaxies in the 85 C4 clusters and found that the BCGs are about 1.6 mag brighter on average than the second ranked cluster galaxies for the band absolute magnitude at . Only 6 BCGs have absolute magnitudes within 0.5 mag of the second ranked cluster galaxies. During this process, we found one mis-identified BCG for C4 2020 (Abell 0119), the brightest galaxy in this cluster is UGC 00579, instead of ARK 021 as listed in the C4 catalog. We caution that such cases may also exist in the unpublished C4 catalogue based on the DR3 of the SDSS (see von der Linden et al. 2007).
Notice that there are 4 BCGs (C4 2049, C4 1176, C4 3311 and C4 1035) in our BCG sample described above with obvious merger features. C4 2049, 1176 and 1035 are merger galaxies with two close nuclei and C4 3311 is with clear asymmetrical shapes. We will discuss these four objects in more detail in §4.2.
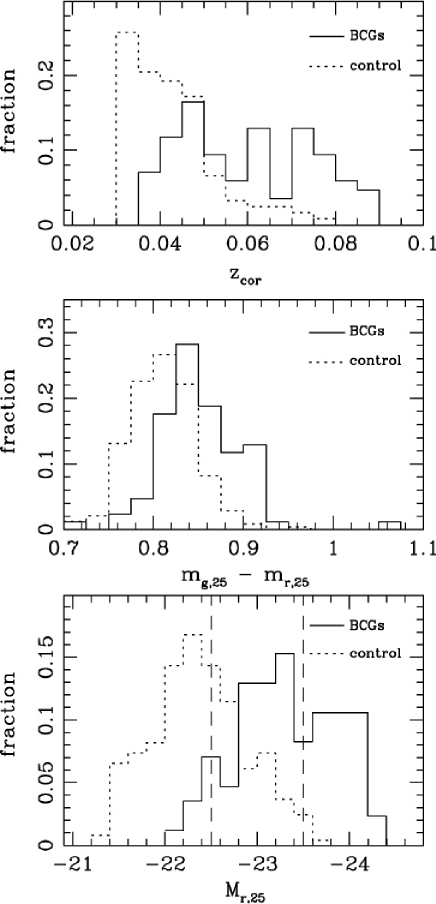
In order to perform direct comparisons with non-BCGs, we construct a control sample of normal early-type galaxies from the SDSS DR2 spectroscopic catalogue with galaxy velocity dispersion measurement in the MPA galinfo catalogue 111http://www.mpa-garching.mpg.de/SDSS/DR4/rawdata.html. These control galaxies are chosen to be in the same redshift and apparent magnitude ranges as sample BCGs, i.e., 0.03z0.09 and 13.5mag14.5. 244 early-type galaxies are selected as the control sample after excluding nearly edge-on objects (most of them have dust features), contaminated sources, and objects identified as C4 BCGs. The distributions of the corrected redshifts relative to the Local Group (see Blanton et al. 2005), (m) colour, and absolute magnitudes at for these two samples are shown in Fig. 1. It can be seen that the control sample has a lower redshift range than those of BCGs. This is because non-BCGs are intrinsically fainter than the BCGs222 Bernardi et al. (2007) found that all galaxies brighter than 24 in the -band are BCGs. Lin Mohr (2004) found that BCGs are about one magnitude (0.83) brighter on average than the second ranked cluster galaxies even within a small metric radius of kpc. This does not contradict with the larger difference (1.6 mag on average) we found for our BCG sample because we measure the magnitudes to , which corresponds to a larger physical size than the radius used by them. (see the bottom panel), so for the same magnitude limit, they reside more locally. Therefore, it is difficult to construct a control sample in the same luminosity range as that of BCGs. Instead we attempt a comparison in a narrow luminosity range, (indicated by two vertical dashed lines at the bottom panel of Fig. 1) where there are sufficient overlaps between the control sample and BCGs (see §4.4 for comparisons). Furthermore, both samples have colour , implying that all of them are early type galaxies colour-wise (see Blanton et al. 2003b; Shen et al. 2003 and reference therein). Also the concentration index for virtually all our galaxies is larger than 2.6, again consistent with their being early-type galaxies (Shimasaku et al. 2001; Strateva et al. 2001). All the basic parameters for these 85 BCGs are listed in Table 2.
| C4 ID | R.A.(J2000) | Dec.(J2000) | reason for rejection |
|---|---|---|---|
| (1) | (2) | (3) | (4) |
| 1023 | 153.664827 | -0.830910 | late type |
| 1053 | 228.307961 | 4.287565 | late type |
| 1324 | 223.045968 | -0.256108 | late type |
| 1366 | 223.396096 | 0.010394 | late type |
| 2001 | 350.862674 | 14.325841 | late type |
| 3016 | 187.452774 | 64.033013 | late type |
| 3143 | 247.104069 | 41.168463 | late type |
| 3246 | 136.572283 | 50.089290 | late type |
| 3282 | 249.318427 | 44.418227 | late type |
| 3286 | 184.232511 | 63.409922 | late type |
| 1024 | 226.688031 | -1.231709 | contaminated by bright star |
| 2031 | 324.773334 | -0.706191 | contaminated by bright star |
| 2092 | 24.225138 | -0.533071 | contaminated by bright star |
| 2097 | 338.797166 | -1.049529 | contaminated by bright star |
| 2109 | 24.314061 | -9.197611 | contaminated by bright star |
| 3268 | 239.339150 | 54.671105 | contaminated by bright star |
| 3021 | 247.489689 | 40.630707 | contaminated by foreground spiral |
| 2178 | 351.297310 | 15.199853 | edge-on galaxy with dust lane |
| 3257 | 249.074493 | 44.135700 | edge-on galaxy with dust lane |
| 3235 | 119.610850 | 37.732302 | a star |
| 3047 | 158.245415 | 56.748148 | at the edge of the frame |
| 1265 | 168.680626 | 4.024536 | richness 10 |
| 1332 | 167.820450 | -0.824176 | richness 10 |
| 2130 | 50.701678 | -6.694635 | richness 10 |
| 3098 | 246.907102 | 42.638233 | richness 10 |
| 3205 | 135.367430 | 55.044549 | richness 10 |
| 1048 | 147.895859 | 1.112059 | |
| 1186 | 183.990581 | 3.305910 | |
| 3285 | 259.895020 | 56.630066 |
![[Uncaptioned image]](/html/0712.0927/assets/x2.png)
![[Uncaptioned image]](/html/0712.0927/assets/x3.png)
3 DATA REDUCTION
3.1 Estimation of the Sky Background
Given that the SDSS image survey in the and bands are relatively shallow and the band images suffer from the ‘red halo’ effect (e.g., Michard 2002; Wu et al. 2005), we use the and band images in this work. The corrected frames have already been processed by the SDSS photometric pipeline (PHOTO), including bias-subtraction, flat-fielding, cosmic ray removal and corrections for pixel defects. We use the astrometry for these two bands obtained by the SDSS astrometry pipeline (ASTROM), which has a typical error of less than (Stoughton et al. 2002). On the other hand, for reasons we will discuss below we perform our own photometry.
Although the images from the SDSS archive were processed with photometric corrections, as Wu et al. (2005) pointed out, some spurious features still exist in some images. The spatial variation of these features was about 1-2 ADU. Without corrections, target galaxies that happen to be located within such features will have inaccurate background subtraction and poor surface brightness profiles, especially in the outskirts of the images. We thus first correct for these structures following Wu et al. (2005) before constructing the sky background model below.
As Lauer et al. (2007) pointed out that the SDSS photometric reduction systematically under-estimates the luminosities and half-light radius of BCGs. This arises because the PHOTO pipeline often over-estimates the sky background for galaxies with large size and/or in crowded fields. Both problems are present for BCGs. As a result, Bernardi et al. (2007) performed their own photometric reductions for their sample. On the other hand, von der Linden et al. (2007) address this problem by adding up to 70% of the difference between the local (256 256 pixels) and the global (2048 1498 pixels) sky background (both are available from PHOTO) around the BCGs to the radial surface brightness profiles and the photometry. However, the sky background in the SDSS frames often shows spatial gradients and asymmetry (see the third row of Fig. 2 for an example). Therefore, adding a constant background value to the radial surface brightness profiles may not yield the most accurate photometry, at least on one-to-one basis (see Fig. 4 for comparisons). Therefore, we performed our own photometry following the method of Zheng et al. (1999) and Wu et al. (2002), which was developed to perform deep photometry for nearby large spiral galaxies. This method has been applied to NGC 5907 and NGC 4565, which achieved accurate photometry down to an isophotal limit of in the intermediate bands of the BATC system (Fan et al. 1996).
To obtain accurate information of the sky background, we first generate a 2048 1498 pixels () background-only image using SExtractor (Bertin Amounts 1996) by masking all the detected objects with counts above 1 noise (of the whole frame) in a frame smoothed by a circular Gaussian with a standard deviation = 3 pixels. As most of sample BCGs have sizes of a few square arcminutes, there are sufficient regions in the masked image to determine the sky background. A median filter with pixels is then convolved with the unmasked pixels, after which second-order Legendre polynomials are used to fit both rows and columns respectively (see Zheng et al. 1999 and Wu et al. 2002). The fitted Legendre polynomials are then further smoothed using a circular Gaussian filter with = 9 pixels to obtain our final sky background model. For most BCGs, we find that the sky background is tilted with a spatial variation about 1 2 ADU across the whole frame. We can subtract this model from the frame to obtain the sky-free image. Our sky subtraction procedure is similar to that in Gonzalez et al. (2005). Furthermore, the sky background subtracted not only includes the contributions of the intra-cluster light (which is at a much lower level), but also from other astrophysical sources (dust emission etc., see Gonzalez et al. 2005 for a discussion).
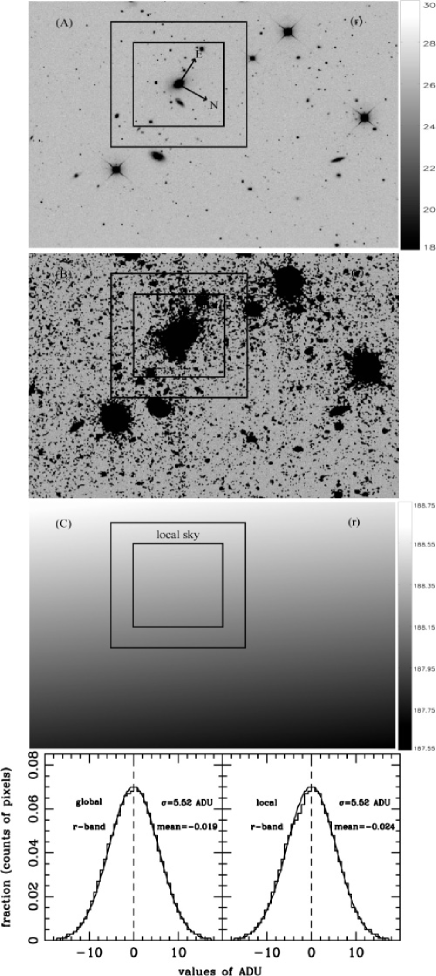
Our procedure is illustrated in Fig. 2 for C4 3086. The first, second and third rows of Fig. 2 show the frame, the masked frame and the smoothed sky background in the band. Notice that the sky background shows a gradient across the frame. The bottom panels show the distributions of counts in the sky-subtracted frame for all unmasked pixels and for the local vicinity around the target BCG. If the sky background model is successful, then we expect the background counts to follow a Gaussian distribution with a mean close to zero. This is indeed the case, as can be seen from the bottom panels of Fig. 2. The distributions in the band for the whole image and the local region are well-fit by Gaussians with dispersion of 5.52 ADU and a mean value of about ADU.
After background subtraction, we geometrically align the two-colour frames, and then trim the corrected frames to 501501 pixels centred on the target. We run SExtractor again on the trimmed frame to generate a ‘SEGMENTATION’ image, which identifies all objects with flags in the frames. A mask image with all the detected objects except the galaxy of interest flagged can then be obtained from the ‘SEGMENTATION’ image. We carefully examined all the mask images in two colours and corrected a few bad images manually to create good mask images for all galaxies. Photometry is then performed on the trimmed images with the masked areas excluded from the reduction; we discuss the details below.
3.2 Isophotal photometry
To compare the scaling relations, such as the size-luminosity relation and Faber-Jackson relation, of BCGs with those of the bulk of elliptical galaxies, we need to perform accurate surface photometry. In this work, we measure the isophotal magnitudes within a certain radius, instead of magnitudes based on a model (e.g., a de Vaucouleurs [1948] model or a Srsic [1968] model) as a large fraction of BCGs is not well described by such simple models. Furthermore, to see how the scaling relations vary as a function of isophotal limits, we measure the photometric parameters to four different surface brightness limits, 22, 23, 24, and 25 mag/arcsec2. We emphasize that the photometry for the control sample has been performed in the same manner as that for BCGs.
The surface photometry analysis is performed following Wu et al. (2005). We briefly outline the procedures below; the readers are referred to that paper for more details. The ISOPHOTE/ELLIPSE task in IRAF is used to fit each of the trimmed background-subtracted images with a series of elliptical annuli from the centre to the outskirts. The width of annuli is chosen to increase uniformly in logarithmic steps, with the semi-major axis radius increasing by 10% between two adjacent annuli. The size of the annuli in the outer parts is therefore larger, which suppresses the shot noise in the outer regions where the signal-to-noise ratio (S/N) is lower. The ellipticity, position angle, and other quantities are also fitted simultaneously. The band images are first used to define the isophotal annuli, which are then applied to the band images. The coordinates of the photometric peak in both band and band are obtained by the DAOPHOT package and are fixed during fitting.
We estimate the seeing of our galaxies in two colours by averaging the star profiles in the corresponding frames respectively. The average values of the FWHMs of the seeings in both colours are , which are similar to the measurements by the SDSS collaboration. We integrate the observed surface brightness profiles directly to estimate the isophotal apparent magnitudes and half-light radius , within which half of the integrated flux of galaxies is contained, under each isophotal limit. The absolute magnitude () is derived from the obtained isophotal apparent magnitude () by , taking into account the extinction () in each filter by the SDSS, and the k-correction (using the KCORRECT algorithm of Blanton & Roweis 2007). Other photometric parameters, such as ellipticities, coefficients of lowest order deviations from perfect ellipse and (see Bender et al. 1988), are derived following Hao et al. (2006). Notice that the parameters are weighted by the intensity between twice the seeing radius and the radius where the surface brightness is in the band. We discuss the isophotal shapes in Sect. 4.3.
All our radial profiles in this paper use the equivalent radius of an ellipse, , where and are the lengths of semi-major and semi-minor axes of the ellipse. The surface brightness profiles in the two bands are performed accounting for the Galactic extinction correction, cosmological dimming, and the k-correction (Blanton & Roweis 2007). The photometric errors are estimated as in Wu et al. (2005). The observational errors in the surface brightness profiles in each band include random errors (e.g., readout noise, the shot noise of the sky background and BCGs) and the error from the sky subtraction.
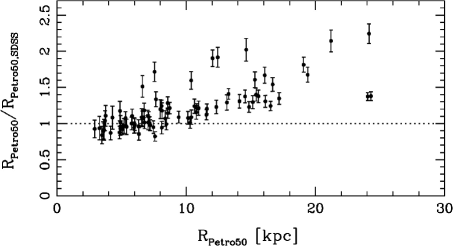
To illustrate the performance of our photometry, we show the comparison of our determined Petrosian parameters with those of SDSS in Fig. 3. One can see that the SDSS pipeline under-estimates the sizes (and thus luminosity) of BCGs, which has been pointed out by other workers (e.g., Lauer et al. 2007). There is a systematic trend: the under-estimation becomes more serious for larger (brighter) BCGs. This is in good agreement with the results of Desroches et al. (2007, see their Fig. 1.).
As mentioned before, von der Linden et al. (2007) adopted a simple prescription to correct for the sky subtraction problem. In Fig. 4 we show a comparison between their surface brightness profile, ours and that from the SDSS for three example galaxies. It can be seen that our results are in very good agreement with those of von der Linden et al. (2007). While there are small differences at faint surface brightness (), such differences have little impact on their results since they adopted a surface brightness of to measure the physical quantities. So for statistical purposes, their method can offer an efficient way of performing photometry, particularly at high surface brightness limits.
4 RESULTS
4.1 The Extended Envelopes of BCGs
As discussed in the introduction, the surface brightness profiles of the majority of cD galaxies show strong deviation from a perfect de Vaucouleurs or Srsic profile due to cD galaxies embedded in an extensive luminous stellar halo. In order to quantitatively measure the extended envelope of BCGs, we use an objective method based on the Petrosian profiles (Patel et al. 2006), defined as
| (1) |
where is the surface brightness in magnitudes at radius and is the mean surface brightness within (Petrosian 1976). There is a distinct signature of a plateau in the Petrosian profiles for cD galaxies with an extended stellar halo (see below). Such a plateau is not present for normal elliptical galaxies which are usually well-fit by a de Vaucouleurs’ surface brightness profile (e.g., Kjrgaard et al. 1993; Brough et al. 2005). Furthermore, notice that the plateau is not present for the Srsic surface brightness profile that better fits some ellipticals (see Fig. 1a of Graham et al. 1996).
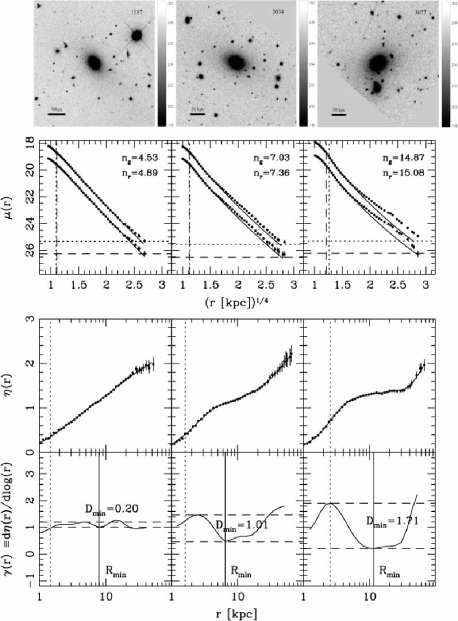
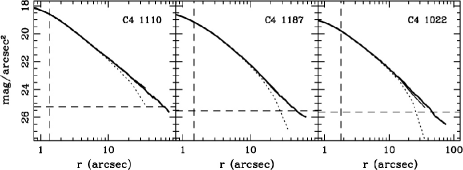
Fig. 5 shows the surface brightness profiles and Petrosian profiles for 3 BCGs. For BCG C4 1187, its profile is well fit by a Srsic with (in the -band) model, and the profile does not show any distinct feature. In contrast, for C4 3034 and C4 3077, their surface brightness profiles deviate significantly from a single Srsic profile (or the profile, for the de Vaucouleur profile), and the profile shows a plateau. Furthermore, we can see that the more significant the deviation of the surface brightness profile from the a single Srsic profile (i.e., the more prominent the stellar halo in the outskirt), the flatter the plateau in the profile becomes.
To quantitatively determine how a surface brightness profile deviates from the profile we calculate the gradient of , . As mentioned before, a single model profile always results in a monotonic profile for any . The bottom panels of Fig. 5 show this quantity as a function of radius. It is clear that galaxies with the most significant deviation from the model profile also have deeper valleys in the profile. We label the radius of the minimum in as , and also define a depth, , as the difference between the minimum and maximum of outside twice the seeing radius and .
The right histogram in Fig. 6 shows the distribution of for our sample BCGs (the median value is ). We can see that the distribution of shows a weak bi-modality, but is still consistent with a continuous distribution within Poisson error bars. This shows that the deviation of the surface brightness profiles from the a single Srsic profile does not have any sharp transitions. Therefore, it is difficult to give an unambiguous criterion to separate cD galaxies from non-cD BCGs.
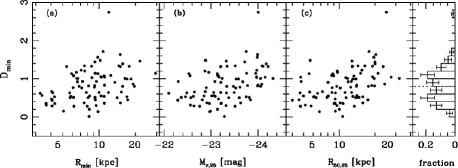
The left panel of Fig. 6 shows the correlations between and . The null-hypothesis that there is no correlation between vs. can be rejected at the level. So statistically the larger the radius , the more significant the extended envelope a BCG appears to have. The middle and right panels in Fig. 6 show the correlations between with the band luminosity and the half-light radius for BCGs. The null-hypothesis that there are no correlations between vs. , and vs. can be rejected at the , and confidence levels. These correlations demonstrate that more luminous and larger BCGs tend to have more extended stellar envelopes and therefore the fraction of cD galaxies increases.
4.2 Mergers and Envelopes in BCGs
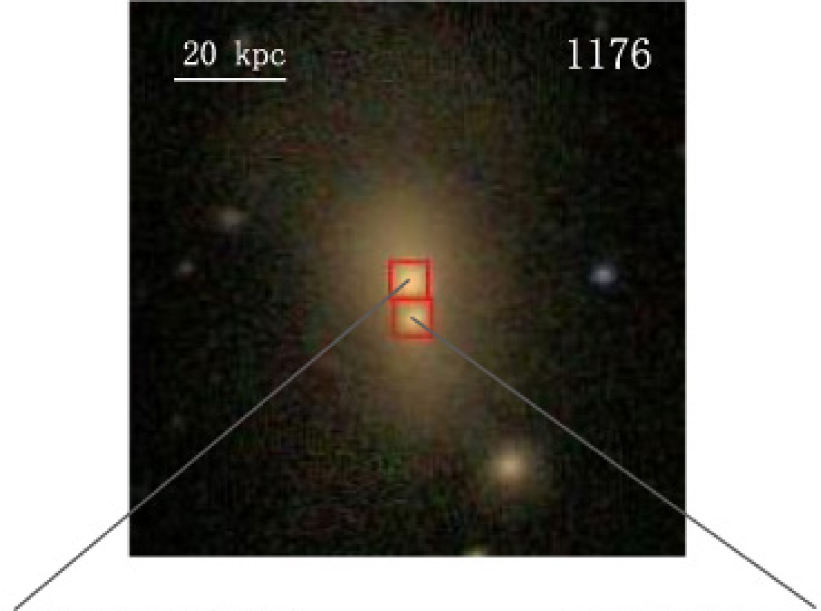
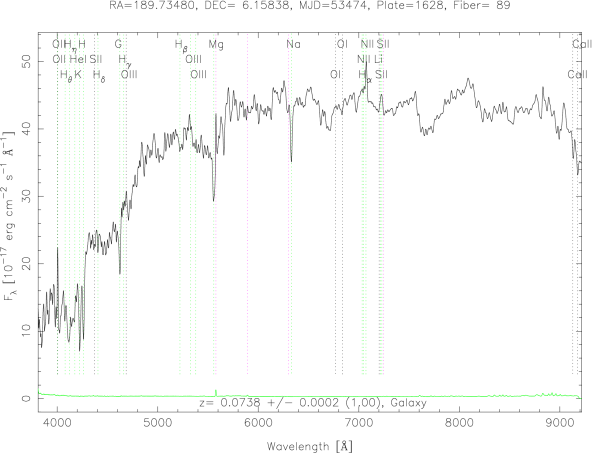
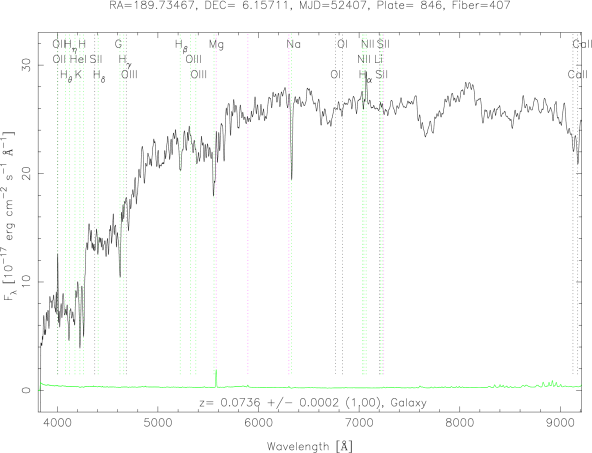
As mentioned in §2 that there are four galaxies in our BCG sample that have either two close nuclei or other clear merging signatures, such as broad faint fans or asymmetry in the morphology. The top panel of Fig. 7 shows the image of C4 1176, from which one can clearly see two nuclei and a broad surrounding fan to the north of the image. The SDSS provides the spectra for both nuclei, which are shown in the bottom panels of Fig. 7. From the spectra the redshifts of the two nuclei are 0.0738 and 0.0736 respectively, corresponding to only 60 difference in the line-of-sight velocity. The angular distance between the two nuclei, , implies a projected separation of just . Therefore, C4 1176 is most likely a merger galaxy with two nuclei. Furthermore, the spectroscopic properties of these two nuclei are similar; both are typical of early type galaxies with weak emission lines of LINER characteristics, indicating that BCG C4 1176 may be a dissipationless (dry) merger system.
For the other three BCGs, we can see from the top panel of Fig. 8 that C4 2049 and C4 1035 also have two possible close nuclei. From the SDSS spectra, we find that the projected distance between the two nuclei for C4 1035 is only and the relative line-of-sight velocity is 120 , and thus may be another merging BCG. For C4 2049, the SDSS has only spectrum for one nucleus. The angular distance between these two nuclei is . If they are at the same redshift, then the projected distance is . Hence C4 2049 is another possible merger BCG. For C4 3311, although one cannot see double nuclei at its centre (down to the SDSS spatial resolution), it shows clear asymmetry in shape, which is indicative of merging activities.
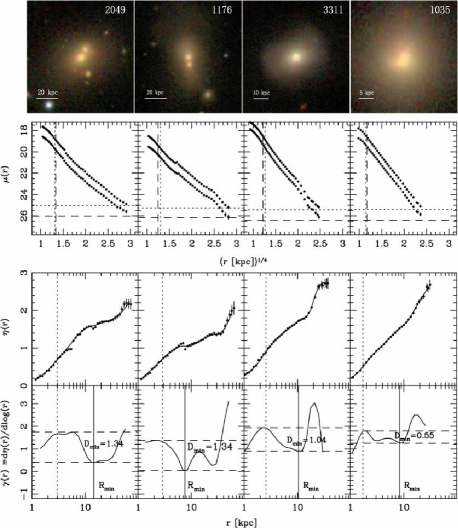
The second, third and bottom rows of Fig. 8 show the surface brightness profiles, profiles and profiles for all four merger/possible merger BCGs. As can be seen, there are obvious plateaus in the profiles for 3 out of 4 merger BCGs (C4 2049, 1176, and 3311). The values measured from the profile are 1.34, 1.34, and 1.04, for C4 2049, 1176, and 3311 respectively, which are much larger than the median value () for the whole BCG sample. Therefore, these three BCGs clearly have extended envelopes in their outskirts and are likely cD galaxies.
The high fraction of cD galaxies in merger BCGs and the fans corresponding to cD galaxy envelopes suggest that the extended stellar halos of BCGs are from mergers and they appear shortly after merging takes place.
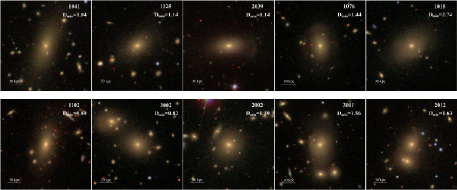
In fact, the role of dry (dissipationless) mergers in the formation of ellipticals has recently received much attention. As pointed out by Bell et al. (2006) and van Dokkum (2005), the typical morphological signatures of dry mergers are broad stellar fans, short tidal tail with similar colour as the galaxy itself, and asymmetries at very faint surface brightness levels. The four examples of merger BCG candidates in our sample shown at Fig. 8 indeed have all these signatures, but they also show even more direct merger signs: in three of these four cases, there are two close nuclei. Fig. 9 shows ten more examples of possible merger systems from our sample. They have broad low-surface brightness fans or distinct asymmetries (top panels); many visually appear to inhabit in environment with multiple small satellites (bottom panels). These images provide strong evidence for the connection of mergers with the formation of stellar halos in BCGs. The 59 BCGs with spectroscopy from SDSS have spectra similar to the examples shown in Fig. 7, indicating our BCG samples are typical early-type galaxies. Their spectra do not show significant star formation at the centre, although one third of our BCGs show weak emission lines with LINER characteristics. Therefore, the mergers appear to be largely dissipationless (dry). We will return to the role of mergers in the formation of BCGs in a future study.
4.3 Isophotal Shapes
We also investigated the shapes of isophotes for BCGs and compared with those of the control sample. The isophotes of ellipticals are usually well fit by ellipses. However, small but significant deviations exist, which are usually described by the Fourier components of the deviations. The most significant one is the (Lauer et al. 1985; Bender et al. 1989), with a positive (negative) indicating a disky (boxy) isophotal shape.

Fig. 10 shows how the parameter varies with the luminosity of galaxies for both the BCGs and the control sample. It is clear from Fig. 10 that decreases as the luminosity of galaxies increases, hence the fraction of boxy galaxies increases for both samples; this trend has been pointed out by many authors (e.g., Bender et al. 1989; Hao et al. 2006). However, the boxy fraction for BCGs (51%) is not much larger than that of the bulk of ellipticals (37%), even though BCGs are more luminous than the bulk of ellipticals in the control sample. In particular, we can see from Table 2 and Fig. 10 that the boxy fractions of BCGs with luminosities in the range of and mag are and respectively. So there are still a large fraction of very luminous early type galaxies with disky isophotes (), which is consistent with the HST image results on BCGs by Laine et al. (2003). Faber et al. (1997) and Lauer et al. (2005) pointed out that galaxies brighter than mag (corresponding to mag, after correcting the difference in , and taking , Krick et al. 2006) tend to have ‘cored’ luminosity profile, while galaxies fainter than mag (corresponding to mag) tend to have ‘power-law’ luminosity profiles (see also Rest et al. 2001; Lauer et al. 2005). Other works (e.g., Rest et al. 2001) show that bright galaxies are slowly rotating, boxy systems (Davies et al. 1983) while faint elliptical galaxies are fast rotating, disky systems (Bender 1988; Bender et al. 1989; Nieto et al. 1988). However, BCGs appear to somewhat contradict with this trend: some very luminous BCGs still have disky isophotes. The flattening in elliptical galaxies can arise either from an-isotropic motions or from rotation. Faint ellipticals appear to be flattened by rotation (e.g., van den Bosch et al. 1994; Lauer et al. 2005), while the luminous ones may be supported by an-isotropic motions. As we have shown in the last subsection, BCGs may have experienced fairly recent merging events, and thus may still retain some of the orbital angular momentum from merging, and their isophotes may be disky.
4.4 Scaling relations
There have already been many works on the scaling relation of BCGs based on homogeneous BCG samples (Bernardi et al. 2007; Desroches et al. 2007; von der Linden et al. 2007; Lauer et al. 2007). However, so far no work has investigated how the slopes change with the isophotal limit, which can in principle provide more knowledge of the dynamical structure of BCGs.
4.4.1 The size-luminosity relation
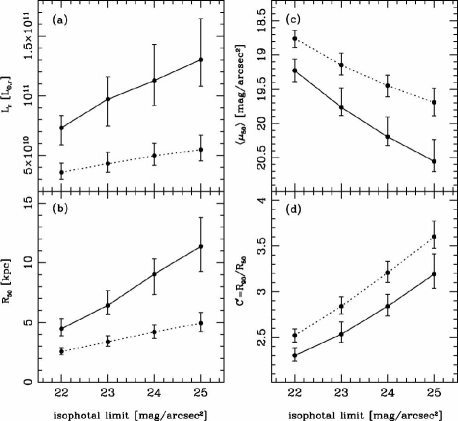
The left panels of Fig. 11 show how the size () and luminosity () vary with the isophotal limits. It is clear that the size () and luminosity of BCGs increase more sharply than that of the control sample as the isophotal limit becomes deeper. The right panel shows how the mean surface brightness within () and the concentration factor () vary with the isophotal limit. We can see that of BCGs decreases more sharply than that of control sample, but of BCGs has the same trend as that of the control sample as the isophotal limit becomes deeper. Therefore, BCGs appear to have significantly larger average sizes and are more diffuse in surface brightness. These trends agree with those found in previous studies (e.g., Lugger 1984; von der Linden et al. 2007).
Fig. 12 shows the size-luminosity relations for our BCGs and the control sample, measured to four isophotal limits, , , and mag/arcsec2 respectively. The solid and dotted lines in each panel show the best power-law () fits; the value is indicated at the top left corner of each panel.333Notice that the intrinsic scatters in the data points are much larger than the statistical error bars, and so the formal per degree of freedom is large, indicating the presence of systematics. To approximately account for these, we renormalised the statistical errors by a constant factor until the per degree of freedom is unity. The errors on the power-law indices are obtained using these renormalised errors. A similar procedure was adopted in von der Linden et al. (2007).
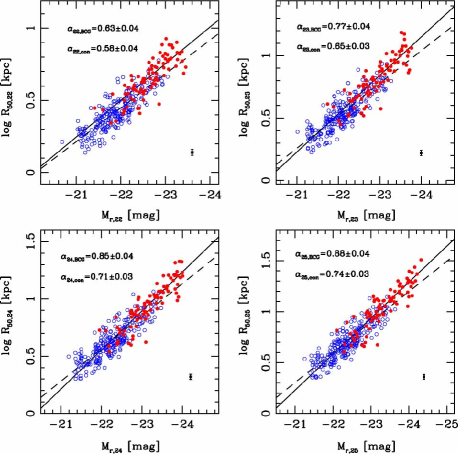
Clearly the size-luminosity relation becomes steeper as the isophotal limit becomes fainter for both the BCG and the control sample. However, we can also see that the size-luminosity relation for BCGs is steeper than that of the control sample at the same isophotal limit. In particular, the size-luminosity relations for BCGs is already slightly steeper (but not very statistically significant) than those of the bulk of ellipticals when the isophotal limit is , corresponding to a physical half-light radius of about 5 kpc (see Fig. 11). It indicates that the deviation of size-luminosity relation for BCGs from that of bulk of ellipticals may already occur for the inner regions of ellipticals, and thus is not because most BCGs have extended stellar halos. Rather, this suggests the deviations arise from different dynamical structures of BCGs from the bulk of ellipticals. Bernardi et al. (2007) arrived at a similar conclusion by comparing the size-luminosity relations for BCGs with and without extended stellar envelopes (see also von der Linden 2007).
The power-law index () for the size-luminosity relation we derived for BCGs at an isophotal limits of mag/arcsec2 is slightly smaller than the value () obtained by Bernardi et al. (2007), but the power-law index () for the control sample at the same isophotal limit is a bit larger than their value (). The difference in the slope measured by us and by Bernardi et al. (2007) may be because we measure the isophotal magnitudes by integrating the observed surface brightness profiles directly, while Bernardi et al. (2007) measured the magnitude using a de Vaucouleurs or Srsic model for the surface brightness profile. In fact, when we use the same method as Bernardi et al. (2007) to perform photometry, the power-law index for the size-luminosity relation we obtain is almost the same () as that of Bernardi et al. (2007), indicating that different ways of photometry can give different power-law indices in the size-luminosity relation.
von der Linden (2007) also derived the size-luminosity relation down to 23 for their BCGs. The slope they derived is , similar to that for their control sample (). Our slope for the BCGs () is steeper than their value at the same isophotal limit, while the slope for our control sample () agrees well with theirs. We have 66 overlapping galaxies with the BCG samples used by von der Linden et al. (2007). If we use only these galaxies, we derive a slope similar to theirs. Our steeper slope appears to arise from the fact that our BCGs are brighter since their sample includes more fainter BCGs which makes their slope shallower (von der Linden 2007, private communication). Therefore, the sample construction also influences the power-law index in the size-luminosity relation.
The power-law index in the size-luminosity relation by Lauer et al. (2007) for their core galaxies with (most core galaxies with are BCGs) measured in a similar way as Bernardi et al. (2007) is significantly steeper than those of Bernardi et al. (2007), von der Linden (2007) and our results. It again illustrates that how samples are constructed and the methods used to do the photometry lead to different power-law indices in the size-luminosity relation. Comparisons between different studies should be aware of this.
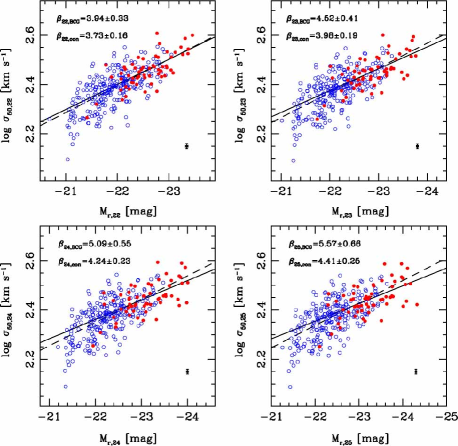
4.4.2 The Faber-Jackson relation and Fundamental plane
It is well known that the luminosities and velocity dispersions of many early type galaxies satisfy the Faber-Jackson relation, , where (Faber & Jackson 1976). Given that the SDSS spectra were taken within a 3 fiber aperture (Jrgensen et al. 1995; Bernardi et al. 2003a), we correct the velocity dispersions for BCGs and the control sample following von der Linden et al. (2007, see their equation 4). The uncorrected value of for each BCG is shown in Column 5 of Table 2.
Fig. 13 shows the relation for 59 out of 85 BCGs and the control sample with SDSS spectral information, measured to four different isophotal limits, 22, 23, 24, and 25 . Clearly at a given surface brightness limit, the slope for BCGs in the Fabor-Jackson relation is steeper than that of the bulk of early type galaxies. The index for both the BCG and control samples increases as the isophotal limits become deeper. The value for the control sample is around 4, consistent with the canonical value for the Faber-Jackson relation. However, this is not the case for BCGs: only when the isophotal limit is 22 , corresponding to the inner region of BCGs, is about 4. For deeper isophotal limits, the values for BCGs are significantly larger, approaching 5.6 for a surface brightness limit of . von der Linden (2007) found for their BCGs at an isophotal limit of , which is within of our value (). For their control samples, they found , within of our result (). Lauer found for their core galaxies with , which is significantly larger than those of values mentioned above. Note that the sample Lauer et al. (2007) used is not a pure BCG sample, although most of their core galaxies with are BCGs.
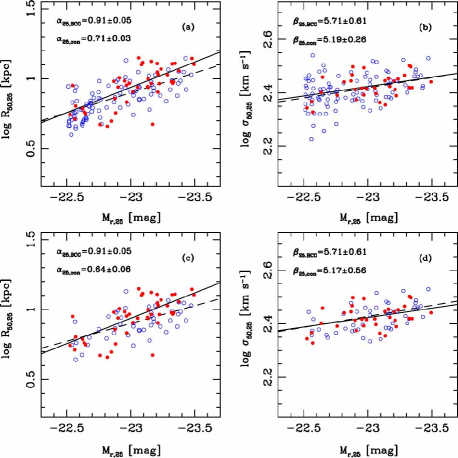
The steeper power-law indices in the size-luminosity and (to a less extent) in the Faber-Jackson relations may arise because BCGs are brighter than the control sample or because there are intrinsic differences between BCGs and the bulk of elliptical galaxies. In order to differentiate these two possibilities, we repeat the above analysis for our BCG and control samples in the same magnitude range, (see §2). Fig. 14 shows the size-luminosity (left) and Faber-Jackson (right) relations. The top panels use all the 94 control-sample galaxies and 45 BCGs within the luminosity range. Since Fig. 1 shows the control sample is still fainter on average than the BCG sample within this narrow range, we have randomly selected 45 out of the 94 control-sample galaxies so they match well with the luminosity distribution of the 45 BCGs. The statistical results for different realisations are similar; the bottom panels shows the results for one realisation. From this figure, we clearly see that the power-law indices for the size-luminosity relations for BCGs are steeper than those for bright non-BCG elliptical galaxies; the power-law indices for the Faber-Jackson relations are also steeper, but only at levels, and so are not statistically significant. To summarise, the data are consistent with a scenario where the cluster environment plays an important role on the BCG formation. However, the numbers of galaxies in our control and BCG samples are still too small to differentiate the two possibilities mentioned above.
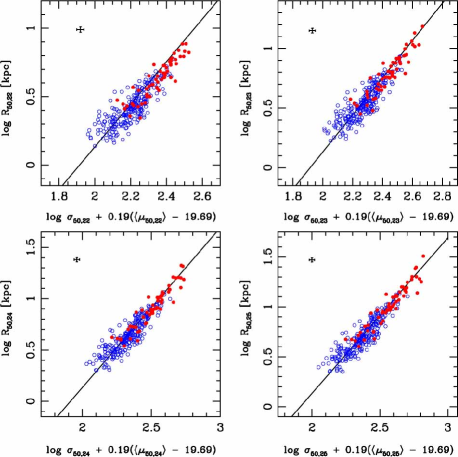
Fig. 15 shows the fundamental plane for our BCGs and the control sample. While they appear to have different power-law slopes in the Faber-Jackson relation, both BCGs and the control sample follow roughly the same fundamental plane, although the scatters in the BCGs appear smaller. At bright isophotal limits, , and , the fundamental planes for BCGs and the control samples appear to differ somewhat. These results are in good agreement with Bernardi et al. (2007).
5 SUMMARY
In this paper we have studied the properties of 85 BCGs carefully selected from the C4 cluster catalog (Miller et al. 2005). To address the problems of the SDSS pipeline PHOTO in crowded fields and for large galaxies, we have performed our own photometry for these BCGs, as well as for a control sample of galaxies in similar redshift and apparent magnitude ranges. Particular attention was paid to accurate extraction of the sky background in clusters using a method developed for high-precision photometry for large, nearby spiral galaxies (Zheng et al. 1999; Wu et al. 2002, see §3). It came as somewhat a surprise to us that the simple recipe of von der Linden et al. (2007) gives surface brightness profiles similar to ours, and hence for many statistical purposes their simple recipe can be adopted as a more efficient alternative.
We analysed the surface brightness properties of our BCGs using the profiles (see eq. 1). We demonstrate that its gradient, , can be used as an indicator of extended envelopes of cD galaxies (Patel et al. 2006). Furthermore, we find that the depth of valley, in the profiles can be used to quantitatively measure the properties of the plateaus in the surface brightness profiles. Generally, the deeper the valleys are (corresponding to a larger value of ), the flatter and wider the plateaus are in the profiles. However, the parameter appears to vary in a continuous way with the galaxy parameters, such as their size and luminosity. While there is a clear trend that more luminous and larger BCGs have larger stellar halos. the continuous variation makes it difficult to un-ambiguously classify cD or non-cD galaxies based on the surface brightness profiles alone.
We measured the photometric properties of galaxies to four different isophotal limits, , and , and used these to investigate the scaling laws and their dependence on these limits. The latter is of particular relevance as some previous investigations derived scaling relations for BCGs using different samples and different isophotal limits (e.g., the study of von der Linden et al. 2007 used an isophotal limit of 23). We find that the size-luminosity relation and Fabor-Jackson () relations of BCGs are consistent with being steeper than those of the bulk of early type galaxies for a control sample selected within the same absolute magnitude range (), although the latter is not statistically significant due to the limited sample sizes.
Furthermore, as the photometric limit becomes deeper, the size-luminosity relation for BCGs and the bulk of the ellipticals becomes steeper. However, there are already (small) differences between BCGs and regular ellipticals at , a surface brightness that probes the inner parts of galaxies. This, together with the relatively small difference in the scaling relations between and , suggests that there may be intrinsic differences in the dynamic structures between BCGs and the bulk of early type galaxies (Bernardi et al. 2007; Lauer et al. 2007). One possibility may be that the amount of dark matter in the central parts of BCGs and regular ellipticals is different (von der Linden et al. 2007), or perhaps the relative importance of an-isotropy and rotation may be different. In this context, it is interesting to note that we find a large fraction of very luminous early type galaxies with disky isophotes. This appears to somewhat contradict with the usual expectation that the most luminous galaxies should show boxy isophotes. Also notice that it is difficult to measure high-redshift galaxies to very faint surface brightness due to the cosmological dimming. Thus a proper comparison between local and high-redshift samples will need to explicitly account for the surface brightness dependence we found in the paper.
In this work we uncovered four strong dry merger candidate BCGs (see Fig. 8), three of which have two close nuclei within kpc and with nearly identical radial velocities. We also found another 10 BCGs in our sample with possible dry merger signatures (see Fig. 9), as advocated by Bell et al. (2006). This strongly suggests merging at the centre of clusters is an important physical process that affects a variety of properties of BCGs, both in photometry and kinematics. An analysis of the statistics for the fraction of dry mergers in BCGs is ongoing and the results will be reported elsewhere.
Acknowledgements
We thank C. N. Hao, Simon White for discussions, and in particular A. von der Linden for sharing data, helpful discussions and comments on a draft. We acknowledge Dr. Tod Lauer, the referee, for a constructive report that improved the paper. This project is supported by the NSF of China 10333060, 10273012, 10640430201, 10773014 and 973 programs No. 2007CB815405 and 2007CB815406. SM acknowledges the Chinese Academy of Sciences and the Alexander von Humboldt Foundation. Funding for the creation and distribution of the SDSS Archive has been provided by the Alfred P. Sloan Foundation, the Participating Institutions, the National Aeronautics and Space Administration, the National Science Foundation, the U.S. Department of Energy, the Japanese Monbukagakusho, and the Max Planck Society. The SDSS Web site is http://www.sdss.org/. The SDSS is managed by the Astrophysical Research Consortium (ARC) for the Participating Institutions. The Participating Institutions are The University of Chicago, Fermilab, the Institute for Advanced Study, the Japan Participation Group, The Johns Hopkins University, the Korean Scientist Group, Los Alamos National Laboratory, the Max-Planck-Institute for Astronomy (MPIA), the Max-Planck-Institute for Astrophysics (MPA), New Mexico State University, University of Pittsburgh, Princeton University, the United States Naval Observatory, and the University of Washington.
References
- Bell et al. (2006) Bell E. F. et al., 2006, ApJ, 640, 241
- Bender (1988) Bender R., 1988, A&A, 193, L7
- Bender et al. (1988) Bender R., Döbereiner S., Möllenhoff C., 1988, A&AS, 74, 385
- Bender et al. (1989) Bender R., Surma P., Doebereiner S., Moellenhoff C., Madejsky R., 1989, A&A, 217, 35
- Bernardi et al. (2003a) Bernardi M. et al., 2003a, AJ, 125, 1817
- Bernardi et al. (2003b) Bernardi M. et al., 2003b, AJ, 125, 1866
- Bernardi et al. (2007) Bernardi M., Hyde J. B., Sheth R. K., Miller C. J. Nichol R. C., 2007, AJ, 133, 1741
- Bertin & Arnouts (1996) Bertin E., Arnouts S., 1996, A&AS, 117, 393
- Binney & Merrifield (1998) Binney J., Merrifield M., 1998, Galactic Astronomy (Princeton: Princeton Univ. Press)
- Blanton et al. (2003a) Blanton M. R. et al., 2003a, ApJ, 592, 819
- Blanton et al. (2003b) Blanton M. R. et al., 2003b, ApJ, 594, 186
- Blanton et al. (2005) Blanton M. R. et al., 2005, AJ, 129, 2562
- Blanton & Roweis (2007) Blanton M. R., Roweis S., 2007, AJ, 133, 734
- Brough et al. (2005) Brough S., Collins C. A., Burke D. J., Lynam P. D., Mann R. G., 2005, MNRAS, 364, 1354
- Cowie & Binney (1977) Cowie L. L., Binney J., 1977, ApJ, 215, 723
- Davies et al. (1983) Davies R. L., Efstathiou G., Fall S. M., Illingworth G., Schechter P. L., 1983, ApJ, 266, 41
- De Lucia & Blaizot (2007) De Lucia G., Blaizot J., 2007, MNRAS, 375, 2
- Desroches et al. (2007) Desroches Louis-Benoit, Quataert E., Ma Chung-Pei, West A. A., 2007, MNRAS, 377, 402
- de Vaucouleurs (1948) de Vaucouleurs G., 1948, Ann. Astrophys., 11, 247
- Faber et al. (1997) Faber S. M. et al., 1997, AJ, 114, 1771
- Faber et al. (1976) Faber S. M., Jackson R. E., 1976, ApJ, 204, 668
- Fabian (1994) Fabian A. C., 1994, ARA&A, 32, 277
- Fabian & Nulsen (1977) Fabian A. C., Nulsen P. E. J., 1977, MNRAS, 180, 479
- Fan et al. (1996) Fan X. et al., 1996, AJ, 112, 628
- Gallagher & Ostriker (1972) Gallagher J. S., Ostriker J. P., 1972, AJ, 77, 288
- Gao et al. (2004) Gao L., Loeb A., Peebles P. J. E., White S. D. M., Jenkins A., 2004, ApJ, 614, 17
- Gonzalez et al. (2005) Gonzalez A. H., Zabludoff A. I., Zaritsky D., 2005, ApJ, 618, 195
- Graham et al. (1996) Graham A., Lauer T. R., Colless M., Postman M., 1996, ApJ, 465, 534
- Hao et al. (2006) Hao C. N., Mao S., Deng Z. G., Xia X. Y., Wu H., 2006, MNRAS, 370, 1339; erratum, MNRAS, 373, 1264
- Jones & Forman (1984) Jones C., Forman W., 1984, ApJ, 276, 38
- Jorgensen et al. (1995) Jrgensen I., Franx M., Kjrgaard P, 1995, MNRAS, 276, 1341
- Kjaergaard et al. (1993) Kjrgaard P., Jrgensen I., Moles M., 1993, ApJ, 418, 617
- Koester et al. (2007) Koester B. P. et al., 2007, ApJ, 660, 239
- Krick et al. (2006) Krick J. E., Bernstein R. A., Pimbblet K. A., 2006, AJ, 131, 168
- Laine et al. (2003) Laine S., van der Marel R. P., Lauer T. R., Postman M., O’Dea C. P., Owen F. N., 2003, AJ, 125, 478
- Lauer (1985) Lauer T. R., 1985, MNRAS, 216, 429
- Lauer (1988) Lauer T. R., 1988, ApJ, 325, 49
- Lauer et al. (2005) Lauer T. R. et al., 2005, AJ, 129, 2138
- Lauer et al. (2007) Lauer T. R. et al., 2007, ApJ, 662, 808
- Lin (2004) Lin Y.-T., Mohr J. J., 2004, ApJ, 617, 879
- Lugger (1984) Lugger P. M., 1984, ApJ, 286, 106
- Matthews (1964) Matthews T. A., Morgan W. W., Schmidt M., 1964, ApJ, 140, 35
- Merritt (1985) Merritt D., 1985, ApJ, 289, 18
- Michard (2002) Michard R., 2002, A&A, 384, 763
- Miller et al. (2005) Miller C. J. et al., 2005, AJ, 130, 968
- Nieto et al. (1988) Nieto J.-L., Capaccioli M., Held V. E., 1988, A&A, 195, L1
- Oegerle (1991) Oegerle W. R., Hoessel J. G., 1991, ApJ, 375, 15
- Oemler (1973) Oemler A., Jr., 1973, ApJ, 180, 11
- Oemler (1976) Oemler A., Jr., 1976, ApJ, 209, 693
- Ostriker & Hausman (1977) Ostriker J. P., Hausman M. A., 1977, ApJ, 217, L125
- Ostriker & Tremaine (1975) Ostriker J. P., Tremaine S. D., 1975, ApJ, 202, L113
- Patel et al. (2006) Patel P., Maddox S., Pearce F. R., Aragón-Salamanca A., Conway E., 2006, MNRAS, 370, 851
- Petrosian (1976) Petrosian V., 1976, ApJ, 209, L1
- Postman & Lauer (1995) Postman M., Lauer T. R., 1995, ApJ, 440, 28
- Rest et al. (2001) Rest A., van den Bosch F. C., Jaffe W., Tran H., Tsvetanov Z., Ford H. C., Davies J., Schafer J., 2001, AJ, 121, 2431
- Richstone (1975) Richstone D., 1975, ApJ, 200, 535
- Richstone (1976) Richstone D., 1976, ApJ, 204, 642
- Schombert (1986) Schombert J. M., 1986, ApJS, 60, 603
- Schombert (1987) Schombert J. M., 1987, ApJS, 64, 643
- Schombert (1988) Schombert J. M., 1988, ApJ, 328, 475
- Sersic (1968) Srsic J. L., 1968, Atlas de Galaxies Australes (Cordoba: Observatories Astronomica)
- Shen et al. (2003) Shen S. et al., 2003, MNRAS, 343, 978
- Shimasaku et al. (2001) Shimasaku K. et al., 2001, AJ, 122, 1238
- Smith et al. (2005) Smith G. P., Kneib J.-P., Smail I., Mazzotta P., Ebeling H., Czoske O., 2005, MNRAS, 359, 417
- Stoughton et al. (2002) Stoughton C. et al., 2002, AJ, 123, 485
- Strateva et al. (2001) Strateva I. et al., 2001, AJ, 122, 1861
- Tran et al. (2005) Tran K.-V., van Dokkum P. G., Franx M., Illingworth G. D., Kelson D. D., Schreiber N. M. F., 2005, ApJ, 627, L25
- van den Bosch et al. (1994) van den Bosch F. C., Ferrarese L., Jaffe W., Ford H. C., O’Connell R. W., 1994, AJ, 108, 1579
- van Dokkum (2005) van Dokkum P. G., 2005, AJ, 130, 2647
- von der Linden et al. (2007) von der Linden A. et al., 2007, MNRAS, 379, 867
- White (1976) White S. D. M., 1976, MNRAS, 174, 19
- White (2005) White S. D. M. et al., 2005, AAP, 444, 365
- Wu et al. (2002) Wu H. et al., 2002, AJ, 123, 1364
- Wu et al. (2005) Wu H., Shao Z. Y., Mo H. J., Xia X. Y., Deng Z. G., 2005, ApJ, 622, 244
- Zebetti et al. (2005) Zibetti S., White S. D. M., Schneider D. P., Brinkmann J., 2005, MNRAS, 358, 949
- Zheng et al. (1999) Zheng Z. Y. et al., 1999, AJ, 117, 2757