2 Shanghai Normal University, 100 Guilin RD, Shanghai, 200234, China
3 Argelander-Institut für Astronomie, Universität Bonn, Auf dem Hügel 71, 53121 Bonn, Germany
4 Department of Physics and Astronomy, University of Victoria, Victoria, B.C. V8P 5C2, Canada
5 University of British Columbia, Department of Physics and Astronomy, 6224 Agricultural Road, Vancouver, B.C. V6T 1Z1, Canada
6 Canadian Institute for Theoretical Astrophysics, University of Toronto 60 St. George Street Toronto, Ontario, M5S 3H8, Canada
7 Department of Physics and Astronomy, University of Waterloo, Waterloo ON N2L 3G1, Canada
8 Laboratoire d’Astrophysique de Marseille, UMR 6110 CNRS-Université de Provence, BP 8, 13376 Marseille Cedex 12, France
9 Institute for Astronomy, 2680 Woodlawn Drive, Honolulu, HI 96822-1897, United States
10 Department of Physics, University La Sapienza, Pl. A. Moro 2, 00185, Roma, Italy
Very weak lensing in the CFHTLS Wide:
Cosmology from cosmic shear in the linear regime
††thanks: Based on observations obtained
with MegaPrime/MegaCam, a joint project of CFHT and CEA/DAPNIA, at
the Canada-France-Hawaii Telescope (CFHT) which is operated by the
National Research Council (NRC) of Canada,
the Institut National des Sciences de l’Univers of the Centre National de
la Recherche Scientifique (CNRS) of France, and the University of Hawaii.
This work is based in part
on data products produced at Terapix and the Canadian Astronomy Data
Centre as part of the Canada-France-Hawaii Telescope Legacy Survey, a collaborative project of
NRC and CNRS.
Abstract
Aims. We present an exploration of weak lensing by large-scale structure in the linear regime, using the third-year (T0003) CFHTLS Wide data release. Our results place tight constraints on the scaling of the amplitude of the matter power spectrum with the matter density .
Methods. Spanning 57 square degrees to over three independent fields, the unprecedented contiguous area of this survey permits high signal-to-noise measurements of two-point shear statistics from 1 arcmin to 4 degrees. Understanding systematic errors in our analysis is vital in interpreting the results. We therefore demonstrate the percent-level accuracy of our method using STEP simulations, an E/B-mode decomposition of the data, and the star-galaxy cross correlation function. We also present a thorough analysis of the galaxy redshift distribution using redshift data from the CFHTLS T0003 Deep fields that probe the same spatial regions as the Wide fields.
Results. We find using the aperture-mass statistic for the full range of angular scales for an assumed flat cosmology, in excellent agreement with WMAP3 constraints. The largest physical scale probed by our analysis is 85 Mpc, assuming a mean redshift of lenses of 0.5 and a CDM cosmology. This allows for the first time to constrain cosmology using only cosmic shear measurements in the linear regime. Using only angular scales arcmin, we find , which agree with the results from our full analysis. Combining our results with data from WMAP3, we find and .
Key Words.:
Cosmology, dark matter, gravitational lensing, large-scale structure of the Universe1 Introduction
A primary scientific goal of the Canada-France-Hawaii Telescope Legacy Survey (CFHTLS111http://www.cfht.hawaii.edu/Science/CFHTLS/) is the exploration of the properties of the dark matter power spectrum and its evolution with redshift using weak gravitational lensing. The weak lensing signal manifests itself in a modification of the apparent galaxy ellipticity induced by the cumulative weak gravitational shear effects of large-scale structure (hereafter cosmic shear). The statistical properties of the distortion field, as a function of angular scale, reflect the properties of the Universe and of the dark matter power spectrum projected along the line of sight (see reviews from Bartelmann & Schneider 2001; Van Waerbeke & Mellier 2003; Refregier 2003; Munshi et al. 2006).
The CFHTLS Deep and Wide surveys have been designed to maximise the scientific reward of the CFHT MegaPrime/MegaCam instrument and in particular to produce a high-quality cosmic shear survey. The Deep and Wide surveys provide image quality, depth and survey size optimised for weak lensing studies as well as () colours over the whole field to get photometric redshifts (Ilbert et al. 2006). Both depth and field of view have been increased by roughly one order of magnitude as compared to the first-generation of weak lensing surveys, like the Red Cluster Sequence (RCS, Hoekstra et al. 2002a) and VIRMOS-Descart (Van Waerbeke et al. 2000, 2001, 2002, 2005) surveys that were carried out at CFHT.
The first CFHTLS cosmic shear results were analysed by Semboloni et al. (2006) and Hoekstra et al. (2006) who demonstrated that MegaPrime/MegaCam provides excellent quality data for weak lensing studies. Despite the optical distortion of the MegaPrime Wide field corrector, after correction, no significant B-modes, nor any obvious critical systematic residuals that may affect the weak lensing signal at the percent level, were found. The shear statistics as a function of angular scale were in good agreement with the theoretical predictions of the most popular cosmological models, and Semboloni et al. (2006) showed that the amplitude of shear signal convincingly increased with depth, as expected from its sensitivity to redshift. These early CFHTLS cosmic shear data were used by Semboloni et al. (2006) and Hoekstra et al. (2006) to derive constraints on - and by Schimd et al. (2007) to explore some physical models of dark energy. The results were consistent with the past CFHT weak lensing surveys but their precision was still limited by the small sky coverage of the early CFHTLS data and by the poor knowledge of the redshift distribution of sources. Benjamin et al. (2007)(hereafter B07) overcame these limitations by using the early CFHTLS Wide data together with the Red Cluster Sequence survey, VIRMOS-Descart and the Garching-Bonn Deep Survey (GaBoDS, Hetterscheidt et al. 2007) weak lensing surveys, and the photometric redshifts of the joint CFHTLS-VIMOS VLT Deep Survey (VVDS) analysis (Ilbert et al. 2006). They then derived much more reliable and accurate - constraint, lowering the upper limits on to be fully consistent with Spergel et al. (2007).
The early CFHTLS weak lensing analysis, the joint B07 and the recent Cosmic Evolution Survey studies (COSMOS, Massey et al. 2007b) explore only small scale lensing. Their cosmological interpretation is therefore sensitive to the non-linear evolution of the dark matter power spectrum and several other physical and systematic effects that primarily contaminate the lensing signal at small scales. The most serious are the high contribution of non-Gaussianity to the error budget (Semboloni et al. 2007) and the signal contamination on scales below 20 arcmin by the shear-shape correlation (Hirata & Seljak 2004; Heymans et al. 2006b) and by the intrinsic ellipticity correlation (King & Schneider 2002; Heymans & Heavens 2003).
The CFHTLS Wide survey has been designed to probe angular scales up to 8 degrees (the largest scale explored by all Wide fields). The exploration of angular scales beyond one degree is technically challenging due to the decreasing amplitude of the lensing signal. Systematics in this unexplored territory are also still poorly understood or unknown. However, they depend on the large-scale accuracy and stability of field-to-field astrometric, photometric and Point Spread Function (PSF) calibrations, and thus there is a need for data homogeneity when analysing galaxy pairs separated by more than the one-degree MegaCam field of view.
The third release CFHTLS T0003 circumvents these issues: The T0003 Wide data explore angular scales up to 8 degrees, that is more than one order of magnitude larger than the largest non-linear angular scales. It covers a total field of view slightly smaller than B07, but with the great advantage of forming a single homogeneous sample and of being easily calibrated using the CFHTLS-VVDS photometric redshifts of Ilbert et al. (2006) that are also derived from the T0003 release.
This work presents a weak lensing analysis of the CFHTLS T0003 -band Wide survey. It extends the previous analysis of the CFHTLS Wide to angular scales up to 230 arc minutes (about 85 Mpc, assuming and , a flat Universe and a mean lens redshift of 0.5). Its sky coverage is 57 square degrees, that is nearly two times larger than early CFHTLS data and about 35% of the final CFHTLS wide sky coverage. Furthermore, it includes a new uncorrelated field, W2, providing a better estimate of the field-to-field variance. The shear measurement pipeline is calibrated and its performance is evaluated using simulated images produced by the Shear TEsting Programme (STEP, Heymans et al. 2006a; Massey et al. 2007b). The signal error budget includes non-Gaussian corrections to the cosmic variance, using the fitting formulae proposed by Semboloni et al. (2007). The effective redshift distribution of sources is determined from the CFHTLS T0003 Deep survey and calibrated using the VVDS (Ilbert et al. 2006).
The paper is organized as follows: In Sect. 2 we give a description of the data set, including the image stacking procedure used in this work. In Sect. 3 we describe the production of weak lensing catalogues. After a brief review of the theoretical background, we present the two-point shear results, together with the sky curvature correction needed at large angular scales in Sect. 4. The redshift distribution is discussed in Sect. 5. In Sect. 6 we show the cosmological parameter estimates, discuss the constraints from linear scales and compare to other data sets. In Sect. 7 we discuss the contamination to our weak lensing measurement from shear-shape correlations. Finally, we summarise and give our conclusions in Sect. 8.
2 Data Description
2.1 Overview of the CFHTLS T0003 release
The Canada-France-Hawaii Telescope Legacy Survey (CFHTLS) is a 5-year project set up jointly by the Canadian and French agencies. The Deep and Wide observations are all carried out in service mode by the CFHT operation staff using the MegaPrime/MegaCam instrument mounted at the prime focus of the telescope. The MegaCam camera is composed of an array of 9 4 CCDs (2048 4612 pixels each). The pixel size at MegaPrime focus is , so that MegaCam comprises a compact field of view of (Boulade et al. 2003).
Details on the Deep and Wide fields have been introduced in Semboloni et al. (2006) and Hoekstra et al. (2006), respectively. After completion the W1, W2 and W3 Wide fields will be composed of 89, 77, 77 different MegaCam pointing positions, respectively222http://terapix.iap.fr/cplt/oldSite/Descart/ summarycfhtlswide.html. Each centre position is separated by its nearest neighbour fields by about one degree. For each field, a sequence of 7-second -band exposures, separated by a small dither, is taken. The dithering pattern is encompassed within a box. Hence, neighboring pointings overlap in right ascension by a minimum of two and a maximum of three arc minutes, whereas the overlap in declination is bounded between three and four arc minutes. The overlapping regions are used for the pointing-to-pointing internal astrometric calibration and flux-rescaling processes.
The CFHTLS Wide T0003 release is produced from all MegaCam CFHTLS images obtained between June 1st, 2003 and September 5th, 2005, that passed both the CFHT and initial Terapix validation processes. Each individual raw image has been pre-processed (bias/dark/fringe subtractions and flatfielding), CCD-to-CCD flux-rescaled and photometrically calibrated at CFHT using the Elixir pipeline (Magnier & Cuillandre 2004). The Elixir products are archived at CADC and then transferred to the Terapix data centre for further higher level processing and the production of the CFHTLS releases333Details on the T0003 release can be found at http://terapix.iap.fr/rubrique.php?id_rubrique=208.
In this paper we use the -band pointings from the T0003 release, but we introduce a more severe image selection in order to optimise and homogenise the depth and the image quality over the whole field used for weak lensing studies. Each -band image must fulfil the following second-level criteria before entering into the calibration and stacking processes:
-
•
half-light diameter of the Point Spread Function below ;
-
•
individual exposure time larger than 500 seconds;
-
•
at least 4 exposures per stack.
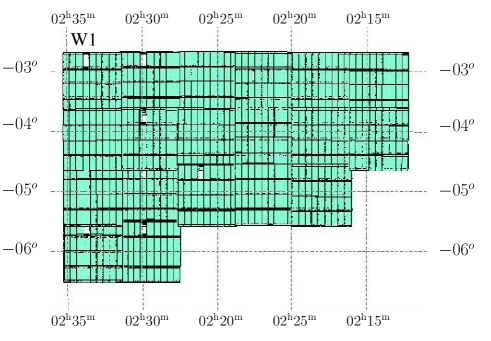
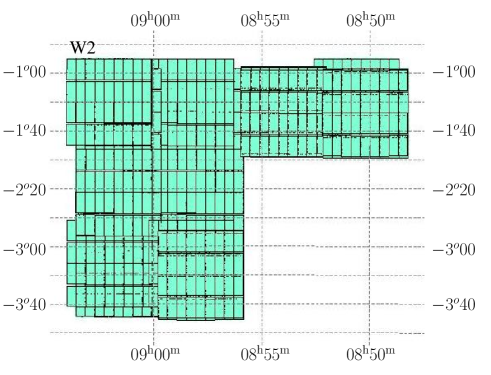
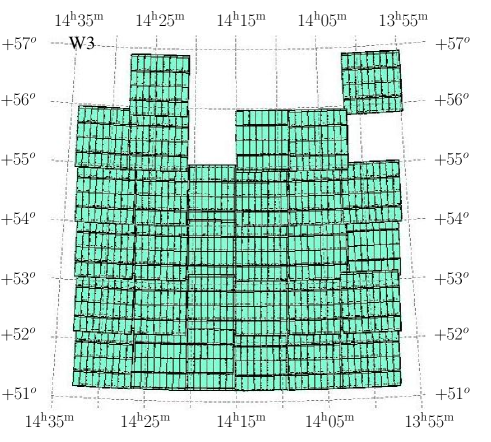
Field-to-field seeing and depth variations are then minimised. Over the 63 -band pointings, 57 pass the second level weak lensing criteria and have been included in this work. They are distributed as follows: 19 pointings on W1, 8 on W2, and 30 on W3 (see Fig. 1). The W2 field is significantly less covered than W1 and W3 but is useful in order to derive an estimate of the CFHTLS Wide field-to-field variance.
2.2 Image Production
The input stack images used in this work are produced using the same Terapix procedures and software tools as the T0003 CFHTLS release. Terapix first generates individual weight map images and individual primary catalogues. It then proceeds to astrometric calibration, MegaCam field-to-field photometric rescaling, image re-centering, image resampling, image warping and, finally, image stacking. Both a co-added image and its weight map are produced, as well as an ASCII DS9 readable mask file and a series of quality control meta-data. A description of these processing steps and software tools can be found on the Terapix web site444http://terapix.iap.fr/soft as well as on the Terapix release document (Mellier et al. 2005). All T0003 configuration files, parameter lists and processing command lines are archived at CADC. Only -band images are considered in this work since other filters cover a much smaller field of view, with a large scatter in sky coverage and depth between each filter.
All fields are astrometrically calibrated and flux-rescaled using SCAMP555http://terapix.iap.fr/soft/scamp (Bertin 2005a, 2006). The astrometric reference catalogue is USNO-B1, which is sufficiently accurate for the external astrometric precision needed for this work. Internal astrometry and MegaCam pointing-to-pointing flux rescaling is done by identifying common objects located in each overlap area. The image re-centering, resampling and stacking are produced by SWarp666http://terapix.iap.fr/soft/swarp (Bertin 2005b), using the same configuration and image processing parameters as those discussed by McCracken et al. (2003). All stacked images have a pixel size of .
The astrometric calibration was performed for each pointing individually. For each pointing, only exposures located inside a circle of radius of 1.5 degrees were selected. This circle encompasses all images at the centre field position together with all exposures located around, at the 8 nearest neighbour centre positions. We experienced that selecting images located beyond this radius did not improve the accuracy and stability of the astrometric solution, and sometimes would have even degraded it. The 8 nearest neighbour fields provide enough common stars in overlap regions to stabilise the solutions at the boundary of each field. The internal error estimates of the astrometric calibration derived from the common objects of nearest neighbour fields is for both MegaCam directions, where the uncertainty denotes the mean field-to-field scatter. The external error is totally dominated by the USNO-B1 internal error, which is in both directions.
In contrast, each stack does not use nearest neighbour images, but only composes together a sequence of exposures having a small dither with respect to a centre field. Each stack is produced by SWarp, using the weighted median value of each pixel and a Lanczos3 interpolation kernel. All output images have 1935419354 pixels of , with North-East orientation along the and pixel coordinates. For all images we use a tangent projection and the Equatorial J2000.0 astrometric coordinate system.
The reference photometric zero-point has been derived by CFHT using standard Landoldt calibration fields (Landoldt 1992), but all catalogues produced prior to weak lensing analysis have a default zero point magnitude set to 30.0. The magnitude system is instrumental AB. An inspection of stellar colour-colour diagrams of each field observed in 5 bands shows that the field-to-field scatter in the overlapping regions is 0.03 mag. Comparison of SDSS and CFHTLS common stars shows that the -band photometry agrees within 0.01-0.02 magnitude 777http://terapix.iap.fr/article.php?id_article=593. However, only 10 W3 and 2 W1 fields have common objects with SDSS, so similar external quality assessments cannot be done for all Wide pointings.
The mask files produced at image processing consist on a set of polygons defined for each pointing in WCS coordinates. They mask the periphery of each MegaCam field of view and all halos and saturated spikes produced by bright stars. In order to avoid contamination by halos or diffusion from very luminous objects, all bright stars located up to a radius of 45 arc minutes from the centre position are automatically masked. The size of polygons is scaled to their apparent magnitude provided in the USNO-B1 catalogue.
The masks are then tuned by adding or modifying polygons from a visual inspection of each stacked image. This step is necessary to clean all images from non-stellar contamination or stellar defects that were missed by the automatic masking process. This includes big halos produced by extremely bright stars, nearby galaxies or any features that may produce a diffuse light component with sufficiently steep gradient to contaminate the second moments of a galaxy’s surface brightness profile which is used to derive its ellipticity. Regions with low signal-to-noise ratio are also masked. In particular, the imprints of gaps between CCDs as well as the boundary of each field are discarded and masked systematically. They are revealed by low-noise strips with a typical rectangular shape that draws the border of each detector. Finally, meteorite, asteroid and aeroplane tracks that may still remain in the stacks are masked as well. The size of each polygon is generally significantly larger than the visual size of the defect it masks. Using this conservative masking process, the final effective sky coverage of the 57 selected Wide fields drops to 34.2 deg2, roughly 60% of the total field.
3 Production of weak lensing catalogues
Our shear measurement pipeline was optimised and calibrated using the STEP1 and STEP2 simulations from Heymans et al. (2006a) and Massey et al. (2007b). See appendix A for a description of both our pipeline and the STEP simulations. Table 3 lists the optimised parameter values of our pipeline.
3.1 Object selection
The lensing catalogue is generated by the IMCAT software (Kaiser et al. 1995). The size of each object is defined by the aperture radius parameter given by the IMCAT peak finding algorithm. The significance detection threshold, as defined by the IMCAT parameter , is set to (i.e. above the rms noise). This value was set according to the STEP tests in order to maximise the number of objects detected while still keeping the bias on the shear components negligible. The catalogue is then filtered to remove objects with radius smaller than the seeing or larger than 6.75 pixels (about 1.3 arc seconds). Pairs with angular separation smaller than 10 pixels () are also discarded in order to avoid contamination from overlapping isophotes.
The magnitude of each object is derived by computing its flux within an aperture radius of . Only objects with IMCAT magnitude are kept into the final analysis catalogue. Beyond this limit, the sample completeness drops significantly below 50%, most objects are too noisy and their shapes are no longer reliable for the precision needed for weak lensing studies. The final catalogue based on the T0003 release of CFHTLS W1, W2 and W3 fields contains roughly two million galaxies. Due to the different weighting applied during the sample selection, the effective number of galaxies used for the weak lensing analysis is 1.7 million, spread over the effective area of 34.2 deg2. It corresponds to a galaxy number density of 13.3 gal/arcmin2. The shapes of these galaxies are quantified by measuring their ellipticities.
3.2 PSF correction

The ellipticities of galaxies are corrected from the PSF produced by telescope, detector, optical and atmospheric effects, using the Kaiser, Squires and Broadhurst method (Kaiser et al. 1995; Luppino & Kaiser 1997; Hoekstra et al. 1998), hereafter KSB+. Our implementation of KSB+ is based on the one used in Van Waerbeke et al. (2000, 2001, 2002, 2005, referenced as ‘LV’ in Heymans et al. 2006a). We calibrated it and modified its input parameters after a new series of optimisations made with the STEP simulations. The results are presented in Appendix A. The version used in this work recovers shear with an underestimation of only 1% to 3% on the simulated images.
The PSF is measured at the stellar positions. After identifying the stars in the images and assuming the PSF changes smoothly across the field, the KSB-quantities known at the stellar positions can be estimated at the galaxies positions by using a polynomial fit. The typical pattern of the PSF anisotropy across one field shows a significant variation across the whole camera (Fig. 2) which suggests the need to perform the fit in each CCD separately. Each CCD covers and contains an average of 43 stars, which allows an accurate mapping of the PSF with a second order polynomial function.
A weight, , is assigned to the ellipticity components of each galaxy and used in the shear measurement (see Eq. 10). We use the Hoekstra et al. (2002b) weighting scheme
| (1) |
where is the error on the ellipticity measurement defined in Hoekstra et al. (2002b) and is a shear polarisability (Luppino & Kaiser 1997). The weight also depends on the intrinsic ellipticity dispersion, , which is derived from the mean intrinsic ellipticity dispersion of the whole galaxy catalogue. We find a value of .
The shape of the weighting as function of the magnitude is shown in Fig. 3. It decreases for fainter magnitudes since the error on the ellipticity increases when the signal-to-noise ratio decreases.

4 Two-point cosmic shear statistics
4.1 Theoretical background
The cosmic shear power spectrum is identical to the lensing convergence power spectrum, , which is a projection of the dark matter power spectrum, , along the line of sight (see for example Bartelmann & Schneider 2001):
| (2) | |||||
where is the comoving distance along the light ray and is the limiting comoving distance of the survey; is the comoving angular diameter distance; is the redshift distribution of the sources and is the modulus of a two-dimensional wave vector perpendicular to the line of sight. Equation (2) shows that the cosmological information contained in the lensing power spectrum is degenerate with the redshift of the sources.
The convergence power spectrum can be derived from the two-point shear correlation functions. In particular, the correlation functions relate to the power spectrum according to
| (3) |
where and are the tangential and rotated ellipticity correlation functions (given in Eq.10), is the angular separation between galaxy pairs, and are Bessel functions of the first kind.
Other two-point functions of the shear field may be derived from , such as the top-hat filtered variance of the shear and the variance of the aperture-mass, in circular apertures (Schneider et al. 2002b). Respectively,
| (4) | |||||
and
| (5) | |||||
The filter functions and are defined in Schneider et al. (2002b),
| (6) | |||||
| (7) |
where denotes the Heaviside step function.
All second-order statistics are different filtered versions of the convergence power spectrum. Therefore they probe different properties of the same power spectrum.
The cosmological shear field is (to first order) curl-free and is called an E-type field. It is useful to decompose the observed shear signal into E (non-rotational) and B (rotational) components. A detection of non-zero B-modes indicates a non-gravitational contribution to the shear field, which reveals a likely systematic contamination to the lensing signal. Crittenden et al. (2002) and Pen et al. (2002) derived an analogous decomposition for the shear correlations, which is also used in this work:
| (8) |
where the definition of is also given in Schneider et al. (2002b)
| (9) |
Both and have infinite support, which implies the E/B decomposition of the shear correlation function and of the top-hat shear variance are non-local. They can be computed from data, up to an offset value which depends on the largest angular separation . This offset is a constant for and a function of for . In contrast, the aperture-mass variance decomposition is local, providing an unambiguous decomposition. In practice, however, a lower limit on the angular separation of galaxy pairs imposed by contamination of overlapping isophotes may bias its amplitude. The lack of galaxy pairs closer than around causes an underestimation of the aperture-mass dispersion. This bias is small, of order 5% for and smaller than one percent on scales larger than 2 arc minutes (Kilbinger et al. 2006).
4.2 Sky curvature correction at large angular scales
The shear correlations are computed as follows:
| (10) |
where is the separation of pairs. The ellipticities are locally decomposed in each pair frame in a tangential and a cross-component. The tangential component is computed orthogonal to the line connecting each galaxy pair. The cross-component is derived at a angle to the connecting line. Using Eqs. (4)-(8) we estimate the E and B modes of the top-hat variance, of the aperture-mass variance and of the shear correlations.
We correlate galaxies which are up to more than seven degrees apart. At such large angles the curvature of the sky is no longer negligible. To avoid a potential bias due to projections we calculate distances and angles in spherical co-ordinates as follows.
The distance between two objects at right ascension and declination , computed along the great-circle connecting the 2 objects is given by
| (11) |
In order to decompose the ellipticity in tangential and cross components, we need to consider the angle between the great circle defined by the two galaxies and a parallel, since each pointing is aligned with lines of constant declination. This is the course angle, given by
| (12) |
Not only the distances but also the galaxy ellipticities are affected by the sky curvature. The ellipticity modulus of a galaxy remains virtually unchanged, curvature on scales of a few arc seconds is negligible. However, since ellipticity is also characterized by its orientation, one has to be careful when correlating ellipticities at large angular distances (Castro et al. 2005). In our case, the ellipticity components and are measured in the local Cartesian co-ordinate frame given by the - and -axes of the corresponding individual CFHTLS Wide pointing. Since each pointing is projected using its own tangent point and defines its own co-ordinate frame, we correlate ellipticities of galaxies from different pointings by using their components measured in the respective local co-ordinate systems. In doing that, the sky curvature is neglected over the scale of a single pointing but it is taken into account between pointings. The effect in a single pointing corresponds to a small ellipticity rotation for galaxies which are at a finite distance from the pointing centre, at most 43 arc minutes.
We compared the shear statistics computed using spherical co-ordinates and using the following simple projection: Cartesian co-ordinates (, ) of a galaxy with right ascension and declination are defined by and , where is the declination of the field centre. The relative error is on the order of a couple of percent on average. On larger scales, where the shear signal is small, this relative error can be much higher. Therefore, throughout this paper we take the sky curvature into account by calculating the shear statistics in spherical co-ordinates.
4.3 Results
The shear correlation functions are computed in narrow bins. We use angular separations in the range between a conservative lower limit of 3 arc seconds and a maximum separation where the number of pairs per bin becomes very small. For each field, the number of pairs per bin shows a similar “top-hat” behavior: a very steep increase from followed by a roughly constant value up to a where it starts a very steep decrease to zero. This separation is for W1, for W2, and for W3.
From the two-point shear correlation functions we calculate the shear top-hat variance and the aperture-mass dispersion up to a radius of which is half of the largest separation , according to Eq. (4) and (5).
The missing information for and on scales larger than is accounted for by adding theoretical predictions of these off-sets to the data using a fiducial cosmological model. Alternatively, we may set the B-modes of the shear correlation function and top-hat variance to zero on the angular scales where we measure zero aperture-mass dispersion B-modes. We checked that both methods produce very similar and small off-set values and thus this procedure does not bias the cosmological interpretation towards the fiducial model used. Furthermore, our cosmological estimates are made using the aperture-mass dispersion and are free of this small arbitrariness.
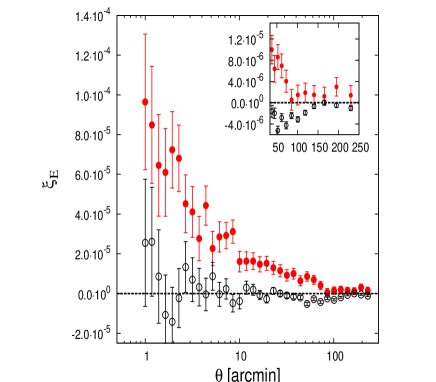
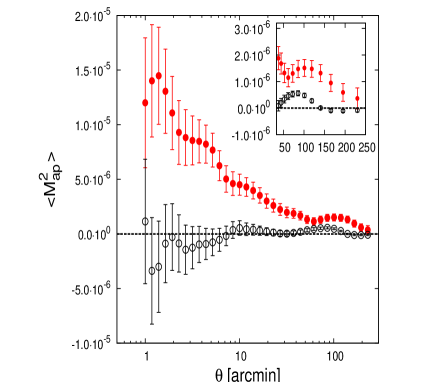
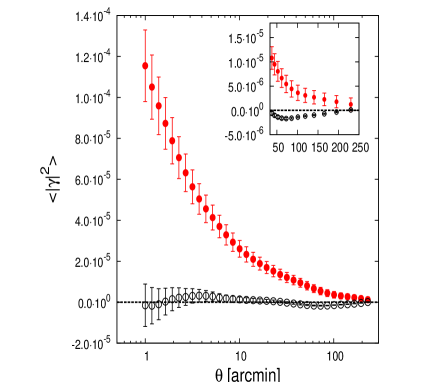
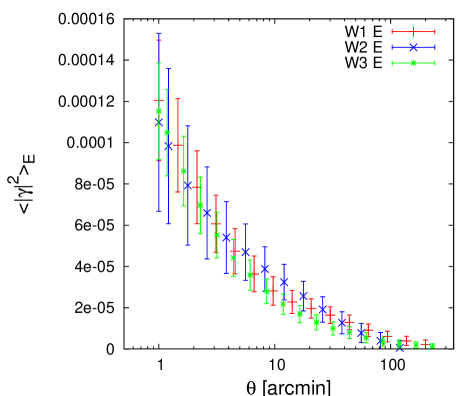
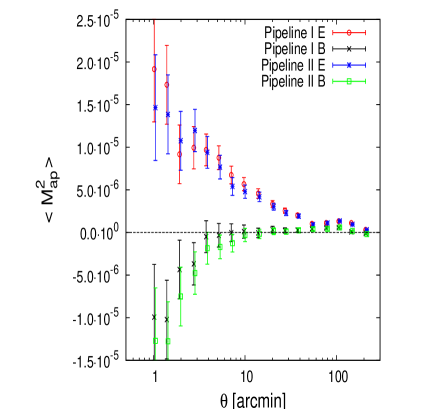
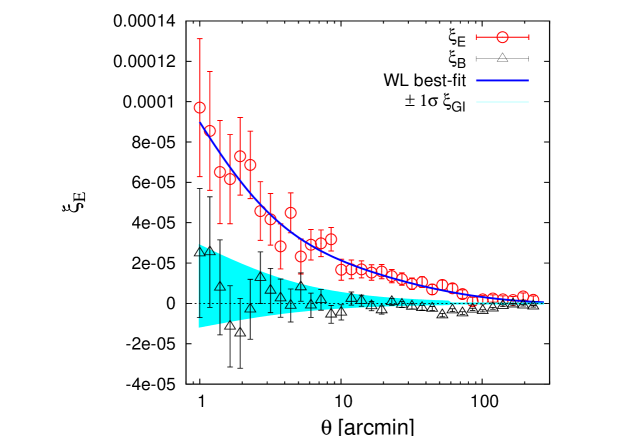
The three statistics are plotted in Fig. 4 and the corresponding values and errors are provided in Table 4-5 in Appendix B. It is worth noting that this is the first time that a cosmic shear signal has been measured down to , beyond scales of one degree . Notice also that the independent measurements of the shear statistics made in the three individual fields W1, W2, W3 are statistically consistent at all scales. This is illustrated by Fig. 5, where the three measurements of top-hat dispersion are shown.
In Fig. 4 the error bars of the E-modes include statistical noise and cosmic variance calibrated for non-Gaussianity, while the error for the B-modes only includes statistical uncertainty. We find a clear E-mode signal and a B-mode which is consistent with zero throughout the explored range of angular scales, except between 50 and 130 arc minutes where there is a small but significant feature in all three second-order functions. This bump of the B-mode peaks at about 60-80 arc-minutes which are the side and diagonal sizes of a Megacam field. We therefore guess it is due to a correlation in PSF residuals on the scale of the camera. In Sect. 6 we show that our cosmological results are not biased by this level of residual systematics on this range of angular scales.
On very large scales (-) we find a very small B-mode, much smaller than both the E-mode amplitude and cosmic variance, but which is not always within of a zero detection. Notice that the errors on the B-mode shown in Fig. 4 are theoretical (statistical) and not estimated from the data, which would include systematics (for example error contributions may arise from the incomplete PSF correction). Moreover, the signal-to-noise with the present CFHTLS Wide data is so high, even for B-modes, that subtle effects may dominate the very small Poissonian error, particularly on large scales where there are a significant number of galaxy pairs.
The field-to-field variation of the B-modes is a possible way to assess these effects on the error buget. We tried to measure this by splitting the 3 Wide fields into 11 blocks of 22 deg2 each, which allows to calculate the B-modes on scales up to 60 arcmin in each block. We obtained B-modes with amplitude very similar to Fig. 4 but the field-to-field scatter is larger than the plotted error bars and reaches a factor of 2 at . This is an interesting indication that we are likely underestimating the error on B-modes, even though it is not a precise measurement due to the small number of independant fields. A thorough analysis of this noise contribution needs many more field and is left to a future analysis of the CFHTLS four year data.
4.4 Cross-check and control of systematics
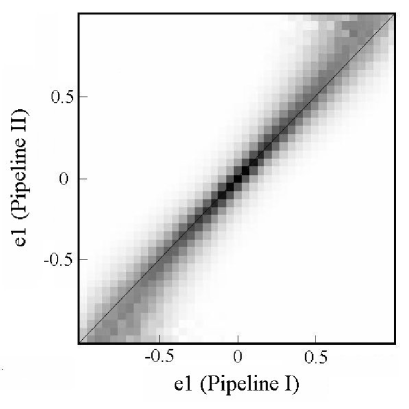
We cross-checked the shear measurement by using an independent analysis on the same data sets. This analysis was done with another version of KSB+ that has been tested with the STEP1+2 simulations (‘HH’ in Heymans et al. 2006a; Massey et al. 2007b). Hereafter, we refer to our analysis as ‘Pipeline I’ and to the ‘HH’ results as ‘Pipeline II’.
The left panel of Fig. 6 shows the shear estimated for each galaxy by each of the pipelines. The results are in good agreement for ellipticity values per component between and 0.6. For ellipticities outside this range the dispersion between the pipelines is larger and a trend for an underestimation of the shear from Pipeline I with respect to Pipeline II can be seen. Note however that the pipelines are not optimised for large ellipticities, since the STEP simulation galaxies have ellipticities that are smaller than 0.1.
We then compare the two-point functions using the aperture-mass variance. We choose this statistic because angular scales are less correlated than for the top-hat dispersion. Moreover, it does not have any ambiguity related to a non-local E/B decomposition. The values of are calculated from the two pipelines using only objects detected by both pipelines. Because the pipelines have different selection criteria the common objects are only two-thirds of the whole sample. Each object is assigned a weight which is the product of its weights in each of the two pipelines. The largest radius explored in the comparison is 210 arc minutes. As can be seen in Fig. 6 (right panel), the E- and B-modes of the two pipelines are remarkably similar. The differences are within the errors on all angular scales. The small B-mode bump appears in both results at 60-80 arc minutes, as in Fig. 4. It also drops to nearly zero at all scales beyond 120 arcmin for both pipelines. The bias between the two pipelines at large ellipticities, seen in the left panel of Fig. 6 is not visible here. The reason is that the large ellipticity galaxies represent less than 4% of the sample. Furthermore these galaxies are typically downweighted; large ellipticities are difficult to measure, resulting of a larger error on the ellipticity measurement, and the shear polarisability increases with ellipticities. They have consequently a lower weight according to Eq. (1).
These results are not expected to be identical to the aperture mass dispersion computed with the whole sample, shown in Fig. 4, because the number of objects in the two samples is different. They are however similar, except for the large B-modes on scales smaller than , which are detected by both pipelines on the smaller sample. Since both analyses use KSB, these B-modes may be due to similar residuals of the PSF correction, but we cannot rule out an intrinsic B-mode contribution. Whatever the origin we only use angular scales larger than for the cosmological parameter constraints (see also Sect. 4.1) in order to avoid any contamination.
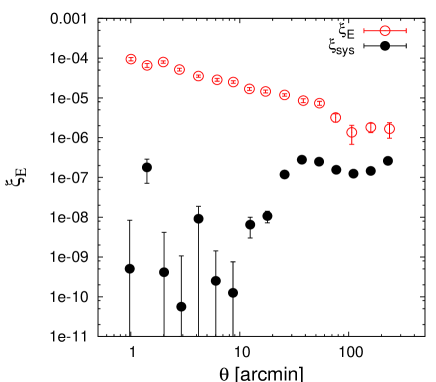
The most common and problematic source of contamination of the lensing signal is the imperfect PSF anisotropy correction. The angular dependence of any PSF systematic residual may be checked by computing the correlation between the corrected galaxy and uncorrected stellar ellipticities. Following Bacon et al. (2003) we normalise this quantity by the star-star uncorrected ellipticity correlation in order to assess its amplitude
| (13) |
where the symbol indicates a stellar quantity. Figure 7 shows this cross-correlation compared to the shear signal up to . Overall, the amplitude is at least one order of magnitude smaller than the signal. This demonstrates that the PSF correction is under control in our shear analysis up to an angular scale of nearly 4 degrees.
5 Source redshift distribution
The calibration of the source redshift distribution in the the CFHTLS Wide fields cannot be calculated from the Wide photometric data since only a few fields have already been observed in 5 bands. However, the CFHTLS Deep fields overlap, or are located very close to, the Wide fields. One can therefore use the photometric redshifts derived for the CFHTLS Deep data (Ilbert et al. 2006) as a representative sample of the Wide galaxy population, in particular for W1 that covers the D1 field.
5.1 Building of the parent Deep histogram
The Ilbert et al. (2006) catalogue samples photometric redshifts of more than 500,000 objects in the four CFHTLS Deep fields888http://terapix.iap.fr/rubrique.php?id_rubrique=227, with an limiting magnitude much fainter than that of the Wide survey, covering the range . It has been calibrated with spectroscopic redshifts obtained by the VVDS Survey in the CFHTLS Deep D1 field (Le Fèvre et al. 2005). In this photometric redshift catalogue 318,776 galaxies have a magnitude matching the range used in the Wide survey, i.e. . This sub-sample is used to build up our redshift distribution.
For each object in Ilbert et al. (2006), the released photometric redshift catalogue provides the maximum likelihood redshift and error estimates such as the left and right 1 error. In order to estimate the redshift distribution we build a normalised Gaussian probability distribution for each galaxy, with mean and dispersion given by the mean of the left and right error. We then draw a redshift randomly and repeat the procedure 1000 times. The variance of these 1000 randomizations is considered into the final error budget.
5.2 Rescaling to the Wide population
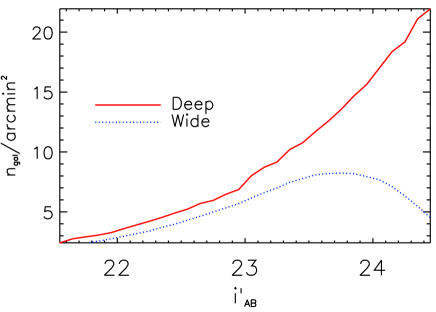
To take into account the different selection functions between the Deep parent sample and the Wide catalogue used in this work, each galaxy is weighted according to the ratio of the Wide to Deep galaxy number density, see Fig. 8. In addition, we include the weak lensing weight (Fig. 3) to match the redshift distribution to the weighted galaxy population selected for weak lensing. The redshift distribution is built up with all photometric redshifts in the range .
5.3 Error budget
The errors on the histogram have several contributions. First, the uncertainty in the photometric redshifts is estimated from the variance of the 1000 randomizations from the CFHTLS Wide redshift histogram constructed in Sect. 5.1. Second, Poisson noise, is added as , where is the number of galaxies per redshift bin. Third, we need to include sample variance, , since we estimate the redshift distribution from a reference catalogue. The sample variance is given as a function of Poisson noise and redshift for various survey areas in Van Waerbeke et al. (2006). We use the ratio of a one square degree survey, corrected for our bin size. We further rescale it according to the weak-lensing selection function, since this reduces the total number of galaxies, on which the ratio depends, as . Note that we do not divide the ratio by to account for having four independent Deep fields, since the Poisson error is calculated for the sum of the four fields.
With the large number of galaxies in our sample and the high accuracy reached by the photometric redshifts at , the sample variance is the dominating contribution to the error budget. Poisson noise and redshift uncertainties only contribute at but become dominant for where the number of galaxies is very low. As a cross-check, we have calculated the field-to-field variance of the four Deep photometric redshift catalogues. The result is consistent with the sample variance obtained by Van Waerbeke et al. (2006), using numerical simulations.
5.4 Fitting of the Wide weak-lensing sample
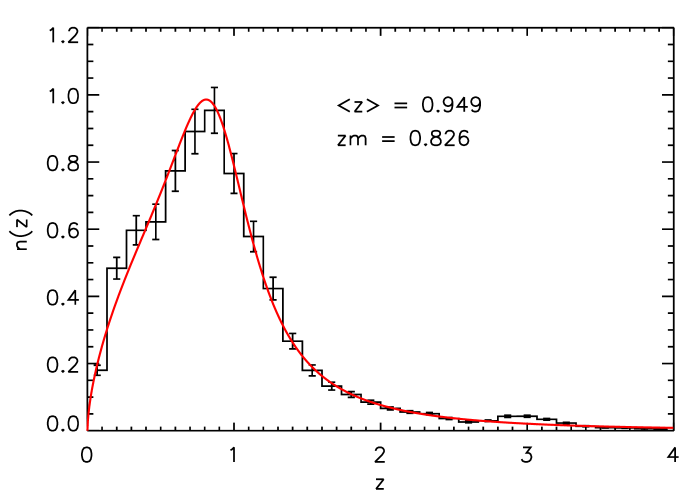
A histogram of the sources redshifts is shown in Fig. 9, where the error bars include redshift uncertainty, Poisson noise and sample variance. Although sample variance is taken into account, the histogram shows a significant bump at redshift . We cannot exclude the possibility that this small peak might be partly a real feature resulting from the joint spectroscopic, photometric and weak lensing selection functions of our galaxy sample. It is however more likely to be an artifact due to systematic photometric redshift misidentifications arising from degeneracies that exist between the optical spectral energy distributions of galaxies with and . The recent analysis of the spatial correlation of populations in different photo- bins (Van Waerbeke et al. 2007, in prep.) confirms that more than 50% of galaxies in the peak are most probably at redshift .
We do not have a reliable estimate of the histogram bin-to-bin correlation. Indeed, the off-diagonal sample variance was not calculated in the numerical simulation analysis of Van Waerbeke et al. (2006), and a field-to-field estimate using the four Deep fields is too noisy to be of practical and reliable use. Thus, in order not to propagate systematics present in the histogram into the cosmological constraints it is preferable to use a fitting function to the redshift distribution in the cosmological parameters estimation. For this we consider all galaxies in the range and fit the redshift distribution with the following function,
| (14) |
The normalization is determined by integrating until , the upper limit of the photometric redshift catalogue.
This function provides a better fit to the main peak and the tail of the distribution as compared to the power-law function used in B07. The distribution shown on Fig. 9 corresponds to the best-fit parameters listed in Table 1. As expected, the peak at is no longer present. It is worth mentioning that, although the histogram shows a significant fluctuation with respect to the best-fit model at redshift , the mean redshift derived from the best-fit distribution is within 1% of the mean value of the histogram.
6 Cosmology with CFHTLS Wide
6.1 Shear covariance
The covariance matrices for the shear two-point correlation functions are calculated using the expressions of Schneider et al. (2002a), valid for a Gaussian shear field. They consist of a statistical noise term, a cosmic variance term and a mixed term. To account for possible residual systematics in the shear signal, we add the measured B-mode at a given angular scale quadratically to the corresponding diagonal element of the covariance.
The first three terms are calculated using a Monte Carlo method applied to the measured galaxy positions and their weight similar to the bootstrapping defined in Sect. 5. In that way the survey geometry, boundary effects and the non-uniform, discrete galaxy distribution are taken into account (Kilbinger & Schneider 2004). Furthermore, this method allows to compute a statistical noise that not only includes the shape noise of the two-point functions estimators but also takes into account Poisson or shot noise.
The non-Gaussianity of the shear field on small scales is considered by applying a correction to the cosmic variance term using the calibration formula of Semboloni et al. (2007). The parameters for the model shear correlation function are and , using the Smith et al. (2003, hereafter S03) non-linear prescription. The redshift distribution is the best-fit of the data (see Sect. 5). For the non-Gaussian calibration a mean redshift of 0.95 was assumed.
The top-hat variance, the aperture-mass statistic and the E-/B-correlation functions are functions of both and (Eqs. 4-8). Therefore, their covariance matrices depend on the full covariance of the combined data vector (). However, we use only , the covariance of , since the non-Gaussian calibration to the cosmic variance was derived for this quantity (Semboloni et al. 2007). We divide the Poisson term of by two, which compensates for the additional information of . The other terms contributing to the total covariance (mixed, Gaussian and non-Gaussian cosmic variance) do not depend on the number of galaxy pairs per bin. Therefore, they are not affected by not taking into account the Poisson-noise contribution from and thus they are unchanged.
6.2 Parameter estimation
The theoretical model that we fit to the data is a flat CDM cosmology with scale-free, adiabatic and Gaussian primordial perturbations. The transfer function is the ‘shape fit’ from Eisenstein & Hu (1998) which takes into account baryonic suppression; we use a fixed . The non-linear evolution of the power spectrum is approximated with the fitting formula of S03.
The assumption of scale-invariance is not crucial for our results. Indeed, marginalization over the primordial spectral index stretches the confidence regions mainly along the - degeneracy direction. The obtained normalisation for a given or the - relation remains unchanged.
We calculate the log-likelihood on a grid of 6-dimensional parameter space: three cosmological parameters and three parameters of the redshift distribution .
The Gaussian lensing log-likelihood is
| (15) |
where an element of the data vector is either one of the measured , or , and is the covariance of the corresponding estimator. The model is the theoretical prediction of the shear statistic for the same angular separation , and is a function of cosmological and redshift parameters.
The grid intervals are for , for and for the Hubble parameter . The redshift parameters values are taken inside of their range: for , for and for . Translated into extreme values, this corresponds to an exploration range of . Since the three redshift parameters are correlated, the grid includes models that should be rejected by the redshift likelihood alone. For this reason we multiply the likelihood, Eq. (15), by a prior given by the likelihood of the redshift distribution estimation,
| (16) |
Here is the (normalised) number of galaxies in the -th redshift bin of Fig. 9 and the fitting function Eq. (14), evaluated at the redshift bin centre. The error on is the error bar of the histogram, we neglect the cross-correlation between different bins.
6.3 Constraints
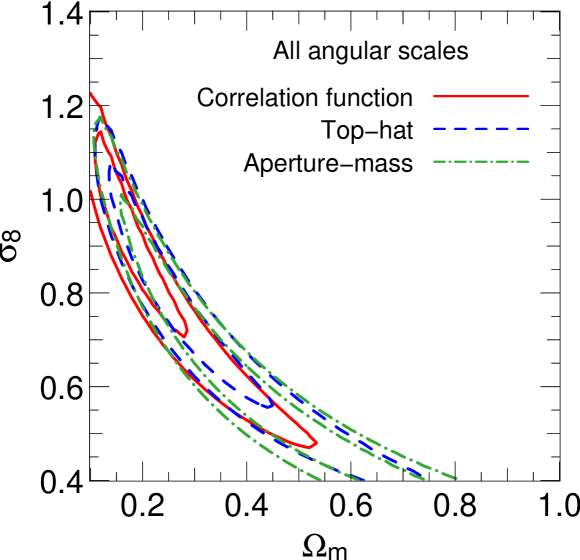
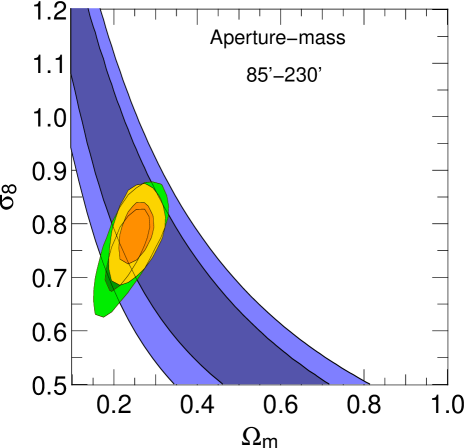
The left panel of Fig. 10 shows the marginalised 2D-likelihood contours for and using the of Table 1. A fit to the degeneracy direction yields
| for | |||||
| for | |||||
| for |
The results for all three statistics are in excellent agreement. Because of the E-/B-mode mixing (Kilbinger et al. 2006) we do not use on scales smaller than 2 arc minutes, therefore we omit the first four data points for this statistic (see Table 4-5). If we use the Peacock & Dodds (1996, hereafter PD96) non-linear power spectrum, the resulting is about 2% larger than for S03 for a fixed .
6.4 Separating small and large scales

Because of the large connected area of the CFHTLS Wide, we are able to obtain interesting cosmological constraints by using large scales only. Although the error bars increase when small scales are not taken into account, the sensitivity to several systematic effects is strongly reduced. The deviation from the linear prediction of the shear top-hat dispersion is 20% at a scale of , for the redshift range probed by the Wide survey. The non-linear to linear ratio of is 3 at and 1.5 at , respectively. Our signal on large scales is therefore in the linear regime and the resulting constraints do not depend on the details of the non-linear modeling. In particular, we are not sensitive to the difference between PD96 and S03 as can be seen in Fig. 11. Other systematics which might bias the results on small scales are baryonic effects (e.g. Zhan & Knox 2004), intrinsic alignment and, maybe most important, shear-shape correlations. All these effects are not yet well understood as they depend on structure formation on small scales and the relationship between galaxies and dark matter. In particular, the shear-shape correlation leads to an underestimation of (Hirata & Seljak 2004; Hirata et al. 2007). On scales larger than about the shear field is Gaussian. The non-Gaussian calibration of the covariance matrix is not needed and also the Gaussian assumption of the likelihood is justified. These two factors will yield more accurate error estimates on the cosmological parameters.
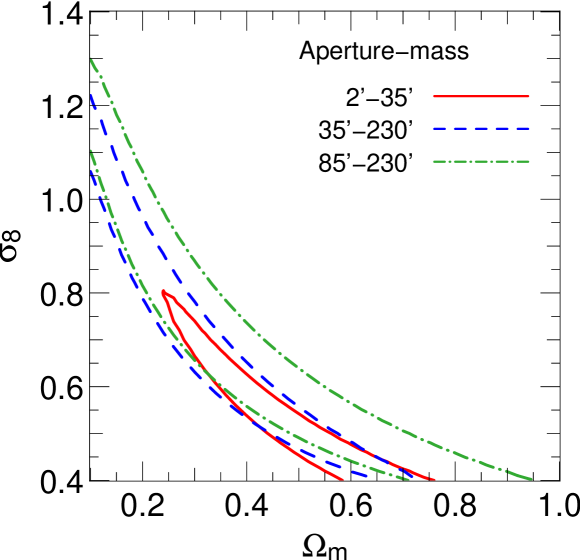
In the right panel of Fig. 10 the results for small and large scales are shown. By using only small scales we obtain tighter constraints than by using only large scales, as the signal-to-noise ratio is higher. Using the aperture-mass dispersion, the constraints derived from the three angular ranges are in very good agreement, with all mean values within :
| for | |||||
| for | |||||
| for |
These results are stable to changes in the smallest angular scale used. For example, changes by half a percent when only scales larger than 4 arc minutes are used.
We checked that these constraints are not sensitive to possible systematics on angular scales between 50 and 130 arc minutes, where the B-mode shows a significant bump. We fit cosmological parameters using scales with plus , and found the same results for and . On the other hand, fitting only the affected scales, , we get for , which is consistent with the results from other scales.
6.5 Comparison with other data sets
| Two-point function | Angular scales | ||
|---|---|---|---|
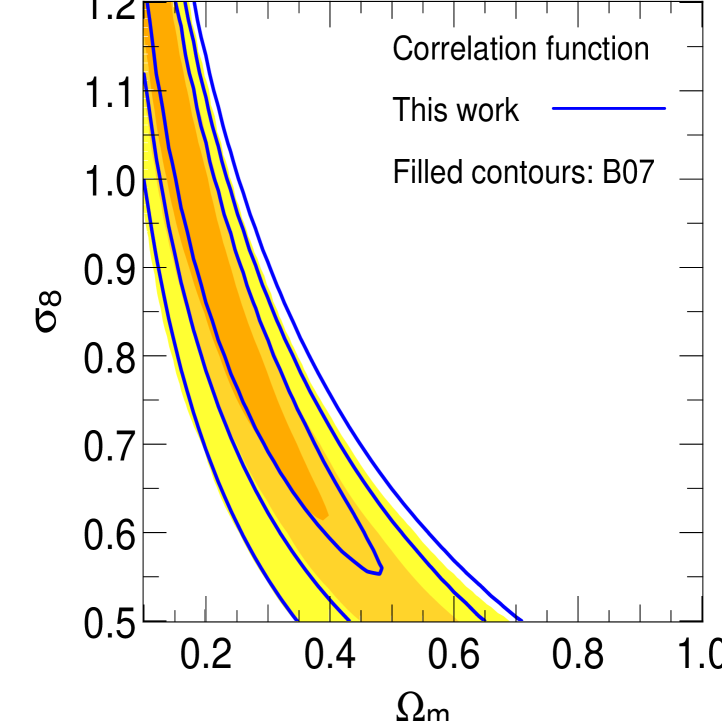
Our results on cosmological parameters are in very good agreement with the most recent cosmic shear analysis which combined the first CFHTLS Wide data release, the RCS, the VIRMOS-Descart and the GaBoDS surveys (the ‘100 square degree survey’, B07). In order to compare the two results we construct a new Wide histogram that has a consistent redshift distribution. Following B07, we only use CFHTLS Deep galaxies with a photometric redshift maximum peak probability in the range . We fit an exponential function proposed by Baugh & Efstathiou (1993) and Van Waerbeke et al. (2002) in the same -range. The mean redshift matches the one in B07. The left panel of Fig. 12 shows an excellent agreement between the two results. The comparatively smaller sky coverage of our survey is compensated by its larger range of angular scales. It is also interesting to notice that our results are in excellent agreement with the CTIO survey (Jarvis et al. 2003, 2006).
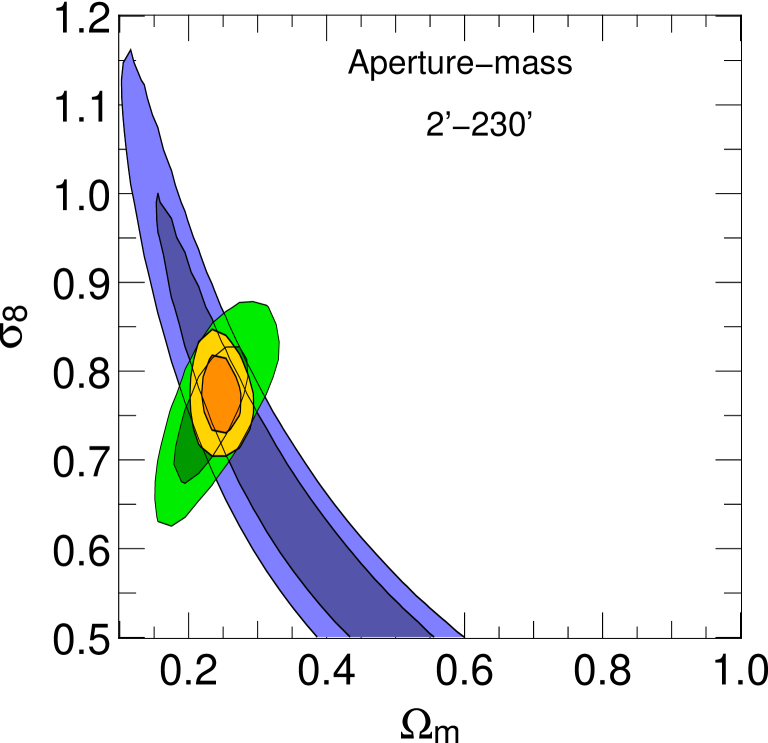
Next, we compare our results for and with the Wilkinson Microwave Anisotropy Probe 3-year constraints (WMAP3, Spergel et al. 2007). We combine our likelihood with a CMB one computed for a flat CDM cosmology using WMAP3 data only including temperature (TT), temperature-polarisation (TE) and polarisation (EE) modes. The combination of the two data sets leads to remarkably smaller confidence levels as compared to individual ones. In particular, as shown in the right panel of Fig. 12, the combination of CFHTLS using the aperture-mass variance and WMAP3 breaks the severe - degeneracy. This translates into a reduction of the region allowed with 95 confidence level by a factor of 3.15 as compared to WMAP3 only. The marginalised constraints for each parameter are shown in Table 2. This corresponds to a relative accuracy of in and in , improving the WMAP3 constraints of Spergel et al. (2007, Table 5) by a factor of 1.82 and 1.77 respectively. The combinations of CFHTLS and WMAP3 using the shear correlation function and top-hat shear variance show consistent results for and as listed in Table 2.
In view of the weak lensing signal we found on large scales, we combine the WMAP3 data with the CFHTLS beyond one degree only, and examine the cosmological constraints derived from the linear regime. We look at the constraints on and by separating the large angular scales (–) from the whole sample, which is listed in Table 2. They are shown in Fig. 13. One can see that the large angular scales alone have a significant contribution to the total constraint, although the survey only covers 57 deg2. It is then realistic to predict from this figure that weak lensing surveys may soon be able to explore cosmological models using linear theory only, similar to CMB physics of primary anisotropies. This is very promising for future surveys with sky coverage much larger than CFHTLS Wide at the same depth. Equivalent constraints from the linear structures, similar to the ones shown in Fig. 13 will then be narrower by a factor of at least 10.
Our joint analysis with WMAP3 data is in full agreement with similar studies presented in Spergel et al. (2007), using several other data sets. Our estimate for the matter density also coincides with the result derived by Astier et al. (2006) based on their SNIa light curves only, for a flat CDM Universe. The comparison with clusters of galaxies is, in contrast, less conclusive. Cluster observations estimate a broad range of values, with some being fully consistent with our results Gladders et al. (2007), (see also Hetterscheidt et al. (2007) for a compilation of results), while a recent analysis of simulations argue for higher values (Evrard et al. 2007; Yepes et al. 2007). The trends for a high value of are also derived from analyses of the Lyman-alpha forest (see Slosar et al. 2007, and reference therein).
7 Contamination by shear-shape correlation
The gravitational lensing signal may be contaminated by the intrinsic alignment and by the gravitational shear and intrinsic ellipticity (or shear-shape) correlations. We do not consider the first term since it would be negligible due to a broad redshift distribution of our sample. On the other hand, Mandelbaum et al. (2006) and Hirata et al. (2007) pointed out that the shear-shape anti-correlation may bias the estimate of by 1 to for a survey on angular scales that we have explored in this work. It is therefore important to estimate its amplitude and to which extent it may spoil our cosmological constraints. We
We attempt a rather simple analysis of the shear-shape correlation (GI) contribution to the shear signal. We use the following simple model for the GI correlation function , which is motivated by numerical simulations (Heymans et al. 2006b)
| (17) |
The lensing efficiency is weighted by the source redshift distribution
For our fiducial flat model with and the redshift distribution of Table 1, we obtain . We fix the scale to 1 arc minute, and further set on scales larger than 1 degree.
We perform a combined likelihood analysis using the six cosmological parameters as described in Sect. 6.2 and the GI amplitude . The sum is fitted to the data. Since the 7D-likelihood analysis is very time-consuming, we use the marginalised 2 likelihood-region from the pure lensing analysis (Sect. 6.3) as a flat prior and do not consider models outside this region. The marginalised result on is consistent with zero. We find for the amplitude in units of Mpc arcmin],
| for |
where the error indicates the confidence region. Figure 14 shows there is no significant signal detected at any scales. The positive (negative) limit from all scales imply a +32% (-13%) contamination of the total signal by GI at one arc minute.
Although the confidence region for the constrained GI amplitude is large it favours positive correlations, whereas from theory we would expect the GI signal to be negative (Hirata & Seljak 2004). As a consistency check we used a cosmology prior given by the marginalised likelihood region from a pure lensing analysis of the large scale results with arc minutes. The model is then fitted on scales with arc minutes. The resulting marginalised likelihood for favours negative GI models but is still consistent with zero. This ansatz gives a high weight to the large-scale cosmic shear signal, and any systematics still present will influence the result. The large scale increase in the measured star-galaxy cross correlation shown in Fig. 7 highlights this concern. As we cannot currently distinguish between GI and other possible systematic effects we can only conclude from our simple analysis that we find no evidence for a non-zero GI signal.
If our galaxy sample is strongly dominated by high-redshift spiral galaxies, then the GI signal may be considerably weakened, as one can anticipate from the morphological analysis of Mandelbaum et al. (2006). We do not have enough colour data to explore in detail the spectral/morphological types of the galaxies used in this work. However, Zucca et al. (2006) pointed out that about 80% of the VVDS spectroscopic galaxy sample up to is composed of spiral-like galaxies. It is then possible that the fraction of spirals is much higher than elliptical galaxies in the population we are sampling with cosmic shear. If so, it would reduce the contamination to a very small effective contribution (Heymans et al. 2006b). A more detailed investigation of the shear-shape analysis using photometric redshifts and spectrophotometric information of galaxies is therefore needed and will be discussed in a forthcoming paper.
8 Summary and conclusions
We have presented the weak lensing analysis of the CFHTLS T0003 Wide data. The survey covers 57 deg2, about two times the size of the previous analysis by Hoekstra et al. (2006), and includes a new independent field W2.
The galaxy shape measurements of a homogeneous sample of two million galaxies down to have been validated using the STEP1 and STEP2 simulations (Heymans et al. 2006a; Massey et al. 2007b). The top-hat shear variance, aperture-mass dispersion and the two-point shear correlation functions show a significant signal, with no galaxy-star correlations, from 1 arc minute up to 4 degrees. The B-mode is consistent with zero on most of these angular scales. It shows, however, a statistically significant feature in the range 50-130 arc minutes, of unknown origin. We have verified that this feature does not influence the cosmological results.
The two-point statistics show all expected properties of a cosmic shear signal up to angular scales 10 times larger than the largest non-linear scales of the survey. Hence, for the first time the cosmic shear signal can be explored with enough confidence to physical scales of about 85 Mpc assuming lenses at , for a flat Universe with and . This is by far the widest scale ever probed by weak lensing at that depth.
The weak lensing Wide data and the photometric redshifts sample of Ilbert et al. (2006) are both part of the CFHTLS T0003 release and cover common fields. The redshift distribution of the Wide data can therefore be calibrated using these photometric redshifts, assuming with a high confidence level that the two galaxy populations are similar. Taking into account the selection criteria of the weak lensing sample, we find a mean redshift of and a description of the redshift distribution in excellent agreement with B07.
Using this redshift distribution, an exploration of constraints on - has been carried out within the angular range . The marginalised result on - derived from the aperture-mass variance
is in excellent agreement with those obtained by the two other statistics (see Fig. 10). These constraints perfectly match those from B07 as shown in the left panel of Fig. 12. This is interesting because the two samples result from complementary approaches: the B07 sample explores the consistency of weak lensing results obtained from a heterogeneous sample consisting of four surveys. In contrast, our work analyses a very homogeneous data set consisting of one single survey, and using photometric redshifts derived from the same CFHTLS release within the same fields as the CFHTLS Wide.
There is a clear trend towards a lower as compared to Semboloni et al. (2006) and Hoekstra et al. (2006). This is a result of the less accurate redshift distributions used in these analyses which were estimated from the Hubble Deep Field photometric redshift sample. This is well confirmed when we combine our predictions on and with WMAP3 of Spergel et al. (2007), shown in the right panel of Fig. 12. There is a striking difference with respect to the early comparison done by Spergel et al. (2007), using the CFHTLS T0001 results. The tension is no longer visible; in contrast, there is a large overlap between the two data sets. The joint CFHTLS-WMAP3 likelihood analysis then leads to tight marginalised constraints on and ,
corresponding to an accuracy of 8% and 4% on these two parameters. Hence, using a much better photometric redshift sample, based on the Deep CFHTLS T0003 data sets that directly calibrate the genuine CFHTLS galaxy population, removes one of the primary uncertainties of earlier CFHTLS weak lensing analysis.
Considering the potential nuisances of systematic effects related to non-linear scales, we split the sample into three ranges of angular scales: the ‘highly non-linear’ (), the ‘intermediate’ () and the ‘linear’ () scales. The analysis of the three sub-samples do not reveal significant differences between each regime (see Fig. 10, right panel). The results are also stable to changes in the lower angular scales increasing from to . This shows that the CFHTLS Wide cosmic shear survey is not yet dominated by uncertainties related to our poor knowledge of astrophysical systematics at small scales. Finally, we find that excluding scales with a significant B-mode () from the analysis does not change our results. The constraints on are therefore insensitive to the level of residual systematics in our data. All these tests strengthen the confidence and reliability of our results.
The very large range of angular scales explored by the CFHTLS Wide opens a new window to cosmic shear surveys. It enables for the first time a comparison of cosmic shear and WMAP3 signals using only linear scales. The constraints shown in Fig. 13 demonstrate that there is still great predictive power from the linear regime only. Future weak lensing surveys which cover areas significantly larger than the CFHTLS will be able to pin down a much narrower region in parameter space. Thus, it will be possible to obtain cosmological parameters to percent-level accuracy and below from combining CMB and weak lensing using linear theory.
Finally, the impact of the contamination by the shear-shape correlation on cosmic shear surveys like CFHTLS is still unclear. We find its amplitude to be very low and compatible with zero at all scales we explored. The low amplitude derived from Hirata et al. (2007), using a survey shallower than the CFHTLS Wide, had already suggested that it should be a small effect and a difficult-to-detect signal in the CFHTLS-Wide, in particular if our galaxy sample is dominated by high-redshift spiral galaxies (Zucca et al. 2006). At present, we can measure to a precision of about and so this bias is still reasonably low. With future work, however, this bias may become the main source of error.
The CFHTLS is still in progress and the next release will include more sky coverage and also a new field, W4. In this work, we only use the wide -band data together with the photometric redshift from the Deep T0003 . The next step is therefore a more detailed analysis of multi-colour data sets. A better check of systematics will be possible by cross-correlating the lensing signal obtained independently in indifferent filters. The larger CFHTLS Wide sample with will also improve tomographic studies and will provide a photometric redshift to each individual galaxy. We will then be in the position to better control contaminations by intrinsic alignment and the shear-shape (GI) correlations (Bridle & King 2007) and to move towards a full tomographic exploration of the CFHTLS Deep and Wide surveys together.
Acknowledgements.
We warmly thank the CFHT, Terapix and CADC staff for their assistance and the considerable work they do to produce the CFHTLS data, and the VVDS consortium for providing the galaxy spectroscopic sample in the CFHTLS fields. This work has made use of the VizieR catalogue access tool, CDS, Strasbourg, France. We thank R. Massey and the STEP collaboration for producing the STEP simulations used in this analysis, and Caltech, the University of British Columbia and JPL for their support to STEP. We thank F. Bernardeau, T. Erben, B. Fort, M. Hetterscheidt, H. Hildebrandt, C. Schimd, P. Schneider, T. Schrabback-Krahe, U. Seljak, C. Shu, J.-P. Uzan for useful discussions. LF thanks the “European Association for Research in Astronomy” training site (EARA) and the European Commission Programme for the Marie Curie Doctoral Fellowship MEST-CT-2004-504604. ES aknowledges the support from the Alexander von Humboldt Foundation. JC, LF, MK and YM thank the CNRS-Institut National des Sciences de l’Univers (INSU) and the French Programme National de Cosmologie (PNC) for their support to the CFHTLS cosmic shear program. IT and YM acknowledge the support of the European Commission Programme 6th framework, Marie Curie Training and Research Network “DUEL”, contract number MRTN-CT-2006-036133. IT thanks the Deutsche Forschungsgemeinschaft under the project SCHN 342/8–1 and the Priority Programme 1177. MK is supported by the CNRS ANR “ECOSSTAT”, contract number ANR-05-BLAN-0283-04. LVW, HH and MH are supported by the Natural Sciences and Engineering Research Council (NSERC), the Canadian Institute for Advanced Research (CIAR) and the Canadian Foundation for Innovation (CFI). CH acknowledges the support of the European Commission Programme 6th framework, Marie Curie Outgoing International Fellowship, contract number M01F-CT-2006021891.References
- Astier et al. (2006) Astier, P., Guy, J., Regnault, N., et al. 2006, A&A, 447, 31
- Bacon et al. (2003) Bacon, D. J., Massey, R. J., Refregier, A. R., & Ellis, R. S. 2003, MNRAS, 344, 673
- Bartelmann & Schneider (2001) Bartelmann, M. & Schneider, P. 2001, Phys. Rep., 340, 297
- Baugh & Efstathiou (1993) Baugh, C. M. & Efstathiou, G. 1993, MNRAS, 265, 145
- Benjamin et al. (2007) Benjamin, J., Heymans, C., Semboloni, E., et al. 2007, MNRAS, 820 (B07)
- Bertin (2005a) Bertin, E. 2005a, in SCAMP v1.2.11 User’s guide
- Bertin (2005b) Bertin, E. 2005b, in SWarp v2.15.4 User’s guide
- Bertin (2006) Bertin, E. 2006, in Astronomical Society of the Pacific Conference Series, Vol. 351, Astronomical Data Analysis Software and Systems XV, ed. C. Gabriel, C. Arviset, D. Ponz, & S. Enrique, 112
- Boulade et al. (2003) Boulade, O., Charlot, X., Abbon, P., et al. 2003, in Proceedings of the SPIE, ed. M. Iye & A. F. M. Moorwood, Vol. 4841, 72–81
- Bridle & King (2007) Bridle, S. & King, L. 2007, e-prints astro-ph/0705.0166
- Castro et al. (2005) Castro, P. G., Heavens, A. F., & Kitching, T. D. 2005, Phys. Rev. D, 72, 023516
- Crittenden et al. (2002) Crittenden, R. G., Natarajan, P., Pen, U.-L., & Theuns, T. 2002, ApJ, 568, 20
- Eisenstein & Hu (1998) Eisenstein, D. J. & Hu, W. 1998, ApJ, 496, 605
- Evrard et al. (2007) Evrard, A. E., Bialek, J., Busha, M., et al. 2007, e-prints astro-ph/0702241
- Gladders et al. (2007) Gladders, M. D., Yee, H. K. C., Majumdar, S., et al. 2007, ApJ, 655, 128
- Hetterscheidt et al. (2007) Hetterscheidt, M., Simon, P., Schirmer, M., et al. 2007, A&A, 468, 859
- Heymans & Heavens (2003) Heymans, C. & Heavens, A. 2003, A&A, 339, 711
- Heymans et al. (2006a) Heymans, C., Van Waerbeke, L., Bacon, D., et al. 2006a, MNRAS, 368, 1323
- Heymans et al. (2006b) Heymans, C., White, M., Heavens, A., Vale, C., & Van Waerbeke, L. 2006b, MNRAS, 371, 750
- Hirata & Seljak (2004) Hirata, C. M. & Seljak, U. 2004, Phys. Rev. D, 70, 063526
- Hirata et al. (2007) Hirata, C. M., Mandelbaum, R., Ishak, M., et al. 2007, MNRAS, 839
- Hoekstra et al. (1998) Hoekstra, H., Franx, M., Kuijken, K., & Squires, G. 1998, ApJ, 504, 636
- Hoekstra et al. (2002a) Hoekstra, H., Yee, H. K. C., Gladders, M. D., et al. 2002a, ApJ, 572, 55
- Hoekstra et al. (2002b) Hoekstra, H., Franx, M., Kuijken, K., & VanDokkum, P. G. 2002b, MNRAS, 333, 911
- Hoekstra et al. (2006) Hoekstra, H., Mellier, Y., Van Waerbeke, L., et al. 2006, ApJ, 647, 116
- Ilbert et al. (2006) Ilbert, O., Arnouts, S., McCracken, H. J., et al. 2006, A&A, 457, 841
- Jarvis et al. (2003) Jarvis, M., Bernstein, G. M., Fischer, P., et al. 2003, AJ, 125, 1014
- Jarvis et al. (2006) Jarvis, M., Jain, B., Bernstein, G., & Dolney, D. 2006, ApJ, 644, 71
- Kaiser et al. (1995) Kaiser, N., Squires, G., & Broadhurst, T. 1995, ApJ, 449, 460
- Kilbinger & Schneider (2004) Kilbinger, M. & Schneider, P. 2004, A&A, 413, 465
- Kilbinger et al. (2006) Kilbinger, M., Schneider, P., & Eifler, T. 2006, A&A, 457, 15
- King & Schneider (2002) King, L. & Schneider, P. 2002, A&A, 396, 411
- Le Fèvre et al. (2005) Le Fèvre, O., Vettolani, G., Garilli, B., et al. 2005, A&A, 439, 845
- Luppino & Kaiser (1997) Luppino, G. A. & Kaiser, N. 1997, ApJ, 475, 20
- Magnier & Cuillandre (2004) Magnier, E. A. & Cuillandre, J.-C. 2004, PASP, 116, 449
- Mandelbaum et al. (2006) Mandelbaum, R., Hirata, C. M., Ishak, M., Seljak, U., & Brinkmann, J. 2006, MNRAS, 367, 611
- Massey et al. (2004) Massey, R., Refregier, A., Conselice, C. J., David, J., & Bacon, J. 2004, MNRAS, 348, 214
- Massey et al. (2007b) Massey, R., Rhodes, J., Leauthaud, A., et al. 2007a, ApJS, 172, 239
- Massey et al. (2007b) Massey, R., Heymans, C., Bergé, J., et al. 2007b, MNRAS, 376, 13
- McCracken et al. (2003) McCracken, H. J., Radovich, M., Bertin, E., et al. 2003, A&A, 410, 17
- Mellier et al. (2005) Mellier, Y., Bertin, B., McCracken, H., et al. 2005, Terapix T0002/T0003 CFHTLS release explanatory document
- Munshi et al. (2006) Munshi, D., Valageas, P., Van Waerbeke, L., & Heavens, A. 2006, e-prints astro-ph/0612667
- Peacock & Dodds (1996) Peacock, J. A. & Dodds, S. J. 1996, MNRAS, 280, L19 (PD96)
- Pen et al. (2002) Pen, U.-L., Van Waerbeke, L., & Mellier, Y. 2002, ApJ, 567, 31
- Refregier (2003) Refregier, A. 2003, ARA&A, 41, 645
- Schimd et al. (2007) Schimd, C., Tereno, I., Uzan, J.-P., et al. 2007, A&A, 463, 405
- Schneider et al. (2002a) Schneider, P., Van Waerbeke, L., Kilbinger, M., & Mellier, Y. 2002a, A&A, 396, 1
- Schneider et al. (2002b) Schneider, P., Van Waerbeke, L., & Mellier, Y. 2002b, A&A, 389, 729
- Semboloni et al. (2006) Semboloni, E., Mellier, Y., Van Waerbeke, L., et al. 2006, A&A, 452, 51
- Semboloni et al. (2007) Semboloni, E., Van Waerbeke, L., Heymans, C., et al. 2007, MNRAS, 375, L6
- Slosar et al. (2007) Slosar, A., McDonald, P., & Seljak, U. 2007, New Astronomy Review, 51, 327
- Smith et al. (2003) Smith, R. E., Peacock, J. A., Jenkins, A., et al. 2003, MNRAS, 341, 1311 (S03)
- Spergel et al. (2007) Spergel, D. N., Bean, R., Doré, O., et al. 2007, ApJS, 170, 377
- Van Waerbeke et al. (2000) Van Waerbeke, L., Mellier, Y., Erben, T., et al. 2000, A&A, 358, 30
- Van Waerbeke et al. (2001) Van Waerbeke, L., Mellier, Y., Radovich, M., et al. 2001, A&A, 374, 757
- Van Waerbeke et al. (2002) Van Waerbeke, L., Mellier, Y., Pelló, R., et al. 2002, A&A, 393, 369
- Van Waerbeke & Mellier (2003) Van Waerbeke, L. & Mellier, Y. 2003, e-prints astro-ph/0305089
- Van Waerbeke et al. (2005) Van Waerbeke, L., Mellier, Y., & Hoekstra, H. 2005, A&A, 429, 75
- Van Waerbeke et al. (2006) Van Waerbeke, L., White, M., Hoekstra, H., & Heymans, C. 2006, APh, 26, 91
- Van Waerbeke et al. (2007) Van Waerbeke, L., Leauthaud, A., & Heymans, C. 2007, in prep.
- Yepes et al. (2007) Yepes, G., Sevilla, R., Gottlöber, S., & Silk, J. 2007, ApJ, 666, L61
- Zhan & Knox (2004) Zhan, H. & Knox, L. 2004, ApJ, 616, L75
- Zucca et al. (2006) Zucca, E., Ilbert, O., Bardelli, S., et al. 2006, A&A, 455, 879
Appendix A STEP simulation calibration
One of the crucial issues for weak lensing studies is the reliability of galaxy shape measurement and the control of systematics. The detection and measurement of weak lensing is a technical challenge. Weak distortion induced by gravitational lensing in the observed shapes of galaxy images is only , much smaller than the typical intrinsic ellipticity dispersion . To further complicate the situation the observed shape of the galaxies is affected by the PSF. The Shear TEsting Programme999http://www.physics.ubc.ca/heymans/step.html (Heymans et al. 2006a; Massey et al. 2007b), hereafter STEP, is a collaborative project aiming to calibrate and improve weak lensing methods using realistic Wide field simulated images. The first and second generation of STEP simulations (hereafter STEP1 and STEP2) are designed for a ground-based survey. In order to check the reliability of the shear measurement used in this analysis, we calibrated the pipeline using all data sets from STEP1 and STEP2.
STEP1 simulations contain relatively simple galaxy morphologies generated using the SkyMaker software101010http://terapix.iap.fr/soft/skymaker. Five constant shears, [0.0, 0.005, 0.01, 0.05, 0.1], are applied to the galaxies, while the second component is always set to zero. Finally, galaxy and stellar point sources are convolved with six different constant PSFs which attempt to reproduce PSF shapes, that are typical of ground-based observations. In this way 30 sets of images, differing in PSF type and/or shear strength are produced. Each set is composed of 64 images. The sky noise is spatially uncorrelated.
STEP2 simulations contain complex galaxy morphologies produced using a shapelet simulation package (Massey et al. 2004). Six sets of 64 images with random constant input shears are convolved each with a different optical PSF. The six PSFs are chosen to span a range of realistic ground-based observing conditions. For each image, a twin image is produced, in which galaxies are rotated by before applying the same shear and the same PSF. Combining the shear analysis on rotated and non-rotated images demonstrates the pure measurement bias, since the noise due to the scatter in a galaxies’ intrinsic morphology is removed. The model of the sky noise is also more complex than the one adopted to generate STEP1 simulations. It is in fact a correlated noise which aims to reproduce the noise of the drizzling process.
Our pipeline is an application of the KSB+ method. The observed galaxy shape is modeled as a convolution of the sheared galaxy with the PSF, which in turn is modeled as a circular profile convolved with a small anisotropy. Assuming the mean of the intrinsic ellipticity distribution of galaxies to be zero and the PSF anisotropy to be small, the first-order of the shear, , can be computed from the observed ellipticities of galaxies, as follows:
| (18) |
where is the smear polarisability and is the anisotropic component of the PSF. The symbol ⋆ indicates those quantities are measured on stars. , defined in Luppino & Kaiser (1997), is the correction to the shear polarisability which includes circular smearing by the PSF.
We compute the stellar quantities, , and , with the same filter function in order to keep the calibration free of extra bias. Following Hoekstra et al. (1998) and the STEP results (Heymans et al. 2006a; Massey et al. 2007b), for each galaxy we compute all quantities, including those estimated from the stars, using a filter scale as given by IMCAT.
We did not apply the same PSF anisotropy correction to small and large objects. Using the STEP1 and STEP2 simulated catalogues we found that the measurement of moments from small objects can be significantly improved and are more robust by first resampling the intensity of light in each pixel. Each image is oversampled by a factor of two and interpolated using a nearest neighbour interpolation kernel, prior to measure shapes of objects. The interpolation works very well for objects with a size close to the star size and does not produce any detectable extra bias. However, it fails and may even degrade the signal as the object size increases. STEP simulations show the transition arises when object size exceeds 1.2 seeing.
We approximate by half of its trace, . Since individual are noisy, we derive their values from a fit as function of some galaxy properties. As described in Heymans et al. (2006a) and Massey et al. (2007b), the shear bias parameter often depends on object sizes, , and magnitudes . We therefore fit in the - plane using a polynomial that only depends on these two parameters. The -dependence on is more scattered than that on , so we choose a function that gives more weight on :
| (19) |
Table 3 summarises the key parameters of our shear measurement pipeline. As an illustration of its application, the left panel of Fig. 15 shows a compilation of all PSF measurements for all stars of the 57 pointings used in this work. The distribution of corrected stars ellipticities in the right panel, shows a reduction by a factor of 10 in both the average ellipticity and dispersion, without showing a preferential direction.
Applying the pipeline to the STEP simulations, we quantify the STEP results using the fit defined in Heymans et al. (2006a) and Massey et al. (2007b), which expresses the difference between measured and input shear through a linear relation:
| (20) |
where are the two shear components. For a perfect shear measurement, and would be zero. Figure 16 shows the values of the residual shear offset and of the multiplicative calibration bias for each of the STEP1 PSF models of the simulation. Averaging over the six STEP1 PSF models, our shear measurement bias is less than as can be seen in Fig. 16 (left panel). The two right panels of Fig. 16 show the bias found in the STEP2 simulations, once the rotated and unrotated images have been merged as described in Massey et al. (2007b). The two components of the shear are underestimated by about on average. Model C is the most similar to the seeing found in our CFHTLS images. It is worth noting that our poorest results come from PSF 2 of STEP1 and PSFs D and E of STEP2 which have the strongest anisotropy of all the simulations. Every shear method tested on these particular simulations had difficulty recovering the correct shear.
These results show the residual bias is well constrained and reasonably low for our purposes. In fact, the shape measurement bias is much lower than the total error affecting the cosmological parameter estimation. It should also be noticed that the STEP1 simulations have characteristics much more similar to the Wide data than STEP2 simulations. In particular, the structure of the noise and the PSF types adopted to generate the STEP1 simulations are very close to the ones of our data. For this reason the effective bias in the CFHTLS Wide shear catalogue is expected to be about .
| Source Detection | hfindpeaks |
|---|---|
| PSF: 2D polynomial model | 2nd order fit of , and |
| Galaxy radius size | from hfindpeaks |
| Quadrupole, and estimate | Interpolation (seeing seeing ), and |
| Approx ( seeing ), and | |
| correction | Fit in to |
| Weight | Hoekstra et al. (2002b) |
| Ellipticity cut | |
| Size cut | and |
| Significance cut | |
| cut | |
| Close pairs | removed |
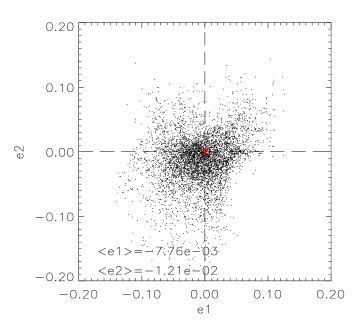

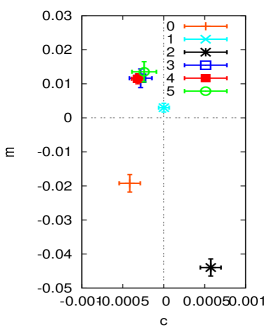
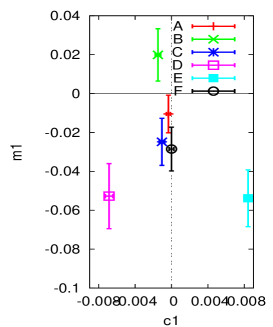
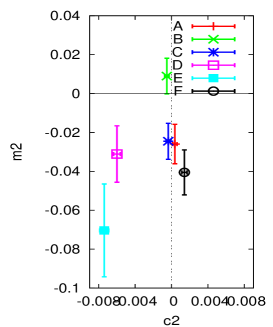
Appendix B Shear two-point correlation data
The data vectors and error bars plotted in Fig. 4, for the various shear two-point functions are listed in Table 4-5.
| 1.00 | 9.704e-05 | 2.494e-05 | 3.416e-05 | 3.200e-05 | 1.158e-04 | -1.809e-06 | 1.749e-05 | 1.036e-05 |
|---|---|---|---|---|---|---|---|---|
| 1.18 | 8.548e-05 | 2.546e-05 | 2.947e-05 | 2.739e-05 | 1.054e-04 | -2.083e-06 | 1.566e-05 | 8.874e-06 |
| 1.39 | 6.511e-05 | 7.956e-06 | 2.555e-05 | 2.352e-05 | 9.631e-05 | -1.422e-06 | 1.405e-05 | 7.606e-06 |
| 1.64 | 6.160e-05 | -1.138e-05 | 2.209e-05 | 2.012e-05 | 8.777e-05 | -1.570e-07 | 1.261e-05 | 6.521e-06 |
| 1.93 | 7.294e-05 | -1.479e-05 | 1.925e-05 | 1.730e-05 | 7.933e-05 | 9.634e-07 | 1.133e-05 | 5.593e-06 |
| 2.28 | 6.865e-05 | -2.900e-06 | 1.672e-05 | 1.486e-05 | 7.111e-05 | 1.695e-06 | 1.020e-05 | 4.800e-06 |
| 2.69 | 4.578e-05 | 1.275e-05 | 1.456e-05 | 1.277e-05 | 6.373e-05 | 2.020e-06 | 9.174e-06 | 4.122e-06 |
| 3.17 | 4.167e-05 | 6.394e-06 | 1.279e-05 | 1.101e-05 | 5.689e-05 | 2.544e-06 | 8.276e-06 | 3.542e-06 |
| 3.74 | 2.826e-05 | 2.609e-06 | 1.117e-05 | 9.473e-06 | 5.100e-05 | 2.656e-06 | 7.459e-06 | 3.045e-06 |
| 4.41 | 4.490e-05 | -1.043e-06 | 9.840e-06 | 8.201e-06 | 4.615e-05 | 2.538e-06 | 6.735e-06 | 2.617e-06 |
| 5.20 | 2.325e-05 | 8.105e-06 | 8.646e-06 | 7.050e-06 | 4.190e-05 | 2.210e-06 | 6.081e-06 | 2.247e-06 |
| 6.13 | 2.908e-05 | -9.270e-07 | 7.556e-06 | 5.996e-06 | 3.756e-05 | 1.671e-06 | 5.487e-06 | 1.929e-06 |
| 7.22 | 2.979e-05 | 1.723e-06 | 6.634e-06 | 5.099e-06 | 3.346e-05 | 1.241e-06 | 4.962e-06 | 1.656e-06 |
| 8.52 | 3.179e-05 | -5.419e-06 | 5.846e-06 | 4.398e-06 | 2.986e-05 | 1.020e-06 | 4.483e-06 | 1.421e-06 |
| 10.04 | 1.668e-05 | -4.458e-06 | 5.195e-06 | 3.793e-06 | 2.666e-05 | 7.947e-07 | 4.070e-06 | 1.219e-06 |
| 11.84 | 1.687e-05 | 2.365e-06 | 4.647e-06 | 3.257e-06 | 2.393e-05 | 5.714e-07 | 3.711e-06 | 1.044e-06 |
| 13.97 | 1.688e-05 | 1.362e-06 | 4.189e-06 | 2.748e-06 | 2.154e-05 | 4.431e-07 | 3.408e-06 | 8.937e-07 |
| 16.47 | 1.530e-05 | -1.318e-06 | 3.830e-06 | 2.338e-06 | 1.944e-05 | 2.889e-07 | 3.159e-06 | 7.649e-07 |
| 19.42 | 1.579e-05 | -3.319e-06 | 3.530e-06 | 2.004e-06 | 1.751e-05 | 1.432e-07 | 2.942e-06 | 6.548e-07 |
| 22.90 | 1.353e-05 | 7.628e-07 | 3.296e-06 | 1.727e-06 | 1.578e-05 | -8.315e-08 | 2.763e-06 | 5.609e-07 |
| 27.00 | 1.207e-05 | -5.854e-07 | 3.051e-06 | 1.477e-06 | 1.413e-05 | -3.782e-07 | 2.600e-06 | 4.812e-07 |
| 31.84 | 9.731e-06 | -1.522e-06 | 2.850e-06 | 1.274e-06 | 1.266e-05 | -7.709e-07 | 2.453e-06 | 4.135e-07 |
| 37.54 | 1.057e-05 | -2.188e-06 | 2.696e-06 | 1.110e-06 | 1.138e-05 | -1.175e-06 | 2.316e-06 | 3.562e-07 |
| 44.26 | 6.947e-06 | -2.544e-06 | 2.513e-06 | 9.671e-07 | 1.007e-05 | -1.595e-06 | 2.179e-06 | 3.076e-07 |
| 52.19 | 9.153e-06 | -5.789e-06 | 2.363e-06 | 8.417e-07 | 8.614e-06 | -1.932e-06 | 2.051e-06 | 2.664e-07 |
| 61.54 | 7.506e-06 | -3.359e-06 | 2.239e-06 | 7.335e-07 | 7.216e-06 | -2.172e-06 | 1.922e-06 | 2.315e-07 |
| 72.57 | 4.613e-06 | -4.799e-06 | 2.081e-06 | 6.492e-07 | 5.996e-06 | -2.245e-06 | 1.799e-06 | 2.020e-07 |
| 85.57 | 1.110e-06 | -2.967e-06 | 1.977e-06 | 5.706e-07 | 4.980e-06 | -2.150e-06 | 1.680e-06 | 1.774e-07 |
| 100.90 | 2.006e-06 | -3.665e-06 | 1.873e-06 | 5.117e-07 | 4.159e-06 | -1.927e-06 | 1.567e-06 | 1.570e-07 |
| 118.98 | 2.416e-06 | -2.401e-06 | 1.797e-06 | 4.636e-07 | 3.619e-06 | -1.689e-06 | 1.465e-06 | 1.407e-07 |
| 140.29 | 1.982e-06 | -1.174e-06 | 1.743e-06 | 4.272e-07 | 3.203e-06 | -1.482e-06 | 1.373e-06 | 1.284e-07 |
| 165.42 | 1.672e-06 | -4.094e-07 | 1.727e-06 | 4.059e-07 | 2.745e-06 | -1.171e-06 | 1.301e-06 | 1.206e-07 |
| 195.06 | 3.439e-06 | -9.141e-07 | 1.743e-06 | 3.961e-07 | 2.214e-06 | -7.842e-07 | 1.259e-06 | 1.223e-07 |
| 230.00 | 1.780e-06 | -1.420e-06 | 1.876e-06 | 4.081e-07 | 1.615e-06 | -2.919e-07 | 1.333e-06 | 1.686e-07 |
| 1.00 | 1.201e-05 | 1.143e-06 | 5.944e-06 | 5.695e-06 |
|---|---|---|---|---|
| 1.18 | 1.402e-05 | -3.377e-06 | 5.138e-06 | 4.875e-06 |
| 1.39 | 1.448e-05 | -3.000e-06 | 4.447e-06 | 4.173e-06 |
| 1.64 | 1.306e-05 | -8.902e-07 | 3.856e-06 | 3.571e-06 |
| 1.93 | 1.107e-05 | -2.830e-07 | 3.353e-06 | 3.059e-06 |
| 2.28 | 9.292e-06 | -8.651e-07 | 2.923e-06 | 2.622e-06 |
| 2.69 | 8.821e-06 | -1.441e-06 | 2.552e-06 | 2.248e-06 |
| 3.17 | 8.556e-06 | -1.258e-06 | 2.238e-06 | 1.930e-06 |
| 3.74 | 8.472e-06 | -9.641e-07 | 1.973e-06 | 1.657e-06 |
| 4.41 | 8.221e-06 | -9.198e-07 | 1.743e-06 | 1.423e-06 |
| 5.20 | 7.676e-06 | -7.686e-07 | 1.542e-06 | 1.222e-06 |
| 6.13 | 6.249e-06 | -5.371e-07 | 1.364e-06 | 1.048e-06 |
| 7.22 | 5.030e-06 | -1.800e-07 | 1.209e-06 | 8.971e-07 |
| 8.52 | 4.609e-06 | 3.606e-07 | 1.079e-06 | 7.693e-07 |
| 10.04 | 4.508e-06 | 5.421e-07 | 9.612e-07 | 6.611e-07 |
| 11.84 | 4.301e-06 | 4.289e-07 | 8.544e-07 | 5.684e-07 |
| 13.97 | 3.976e-06 | 3.853e-07 | 7.688e-07 | 4.874e-07 |
| 16.47 | 3.526e-06 | 3.019e-07 | 7.046e-07 | 4.171e-07 |
| 19.42 | 3.009e-06 | 2.118e-07 | 6.501e-07 | 3.572e-07 |
| 22.90 | 2.600e-06 | 1.249e-07 | 5.954e-07 | 3.066e-07 |
| 27.00 | 2.239e-06 | 4.597e-08 | 5.387e-07 | 2.633e-07 |
| 31.84 | 1.976e-06 | 2.932e-08 | 4.840e-07 | 2.261e-07 |
| 37.54 | 1.877e-06 | 8.679e-08 | 4.359e-07 | 1.944e-07 |
| 44.26 | 1.675e-06 | 1.961e-07 | 3.967e-07 | 1.674e-07 |
| 52.19 | 1.322e-06 | 3.382e-07 | 3.668e-07 | 1.443e-07 |
| 61.54 | 1.147e-06 | 4.524e-07 | 3.454e-07 | 1.245e-07 |
| 72.57 | 1.303e-06 | 5.266e-07 | 3.312e-07 | 1.077e-07 |
| 85.57 | 1.475e-06 | 5.585e-07 | 3.223e-07 | 9.356e-08 |
| 100.90 | 1.511e-06 | 4.750e-07 | 3.172e-07 | 8.174e-08 |
| 118.98 | 1.476e-06 | 2.712e-07 | 3.158e-07 | 7.206e-08 |
| 140.29 | 1.317e-06 | 3.462e-09 | 3.174e-07 | 6.437e-08 |
| 165.42 | 9.472e-07 | -9.410e-08 | 3.220e-07 | 5.879e-08 |
| 195.06 | 5.901e-07 | -1.055e-07 | 3.345e-07 | 5.692e-08 |
| 230.00 | 3.641e-07 | -7.764e-08 | 3.966e-07 | 7.353e-08 |