Present address: ]Insitute of Particle and Nuclear Studies, High Energy Accelerator Organization (KEK), Tsukuba, 305-0801, Japan Present address: ]Gifu University, Gifu, 501-1193, Japan Present address: ]Gifu University, Gifu, 501-1193, Japan
Photoproduction of neutral kaons on the liquid deuterium target in the threshold region
Abstract
The photoproduction process of neutral kaons on a liquid deuterium target is investigated near the threshold region, –1.1 GeV. events are reconstructed from positive and negative pions, and differential cross sections are derived. Experimental momentum spectra are compared with those calculated in the spectator model using a realistic deuteron wave function. Elementary amplitudes as given by recent isobar models and a simple phenomenological model are used to study the effect of the new data on the angular behavior of the elementary cross section. The data favor a backward-peaked angular distribution of the elementary process, which provides additional constraints on current models of kaon photoproduction. The present study demonstrates that the reaction can provide key information on the mechanism of the photoproduction of strangeness.
pacs:
13.60.Le: 25.20.LjI Introduction
Kaon production on a nucleon or a nucleus by the electromagnetic interaction provides invaluable information on the strangeness production mechanism, since the electromagnetic interaction is better understood than the hadronic interaction. Studies using real photon and electron beams were started in the early 1950s. The reaction was studied from the threshold up to 1.4 GeV by measuring the differential cross sections Anderson et al. (1968); Peck (1964); Groom (1967); Bleckmann et al. (1970); Fujii et al. (1970); Feller et al. (1972), total cross sections Erbe et al. (1969) and polarizations Groom (1967); Fujii et al. (1970). An experiment using the polarized target was also made Althoff et al. (1978). The isobar model for kaon photoproduction was developed to reproduce the experimental results in the 1960s Thom (1966).
Since the 1990s, new experiments have been carried out using advanced detector systems at accelerator facilities which provide higher-quality photon or electron beams. There are six isospin channels of elementary kaon photoproduction, , , , , , and , though kaon production reactions with proton targets have mainly been investigated to date. The reaction has been studied from the threshold region up to a photon energy of 2.95 GeV by measuring the differential and total cross sections at ELSA/SAPHIR Glander et al. (2004), JLab/CLAS Bradford et al. (2006) and SPring-8/LEPS Sumihama et al. (2006). Polarization transfer in the reaction has been also measured at CLAS Bradford et al. (2007), and the beam polarization asymmetries for the and reactions have been measured at SPring-8/LEPS Sumihama et al. (2006). To date, several theoretical models have been proposed Adelseck and Saghai (1990); Williams et al. (1992); David et al. (1996); Bennhold and Wright (1989); Janssen et al. (2001); Mizutani et al. (1998); Lee et al. (2001). Although a wide variety of observables in elementary kaon photoproduction processes has been investigated, no model has successfully explained them all. Therefore, further experimental and theoretical studies are eagerly awaited, particularly in other isospin channels. In particular, the reaction is expected to greatly help clarify the strangeness photoproduction process. This reaction has the following features:
-
(i)
The Born term in the t-channel does not contribute, in contrast to reactions with in the final state, because no charge is involved in the reaction.
-
(ii)
The coupling constants in the u-channel for and other isovector exchanges have the same value but are of opposite sign to those in the reaction due to the isospin symmetry.
Because of these characteristics, the interference among the diagrams in the production process is quite different from that in the process. Due to this differences, it was indicated that the angular distribution of the production process shows a backward peak Li et al. (1992). Therefore, comparison of and photoproduction data, especially the angular distribution, is very important for the investigation of the strangeness photoproduction mechanism. Note, that the absence of electric charge in the process (the s-channel Born term is gauge-invariant by itself) makes implementation of hadronic form factors easier than in the case. Besides the features mentioned above, the influence of the higher mass resonances can be considered to be small in the present experiment, which was carried out near the threshold, –1.1 GeV.
Prior to the present experiment, the photoproduction of neutral kaons on a carbon target near the threshold energy was measured for the first time at the Laboratory of Nuclear Science (LNS) of Tohoku University Watanabe et al. (2007). Neutral kaons were detected via the decay channel using the Neutral Kaon Spectrometer (NKS). The cross sections were compared with those for photoproduction Yamazaki et al. (1995) as a function of the incident photon energy. It was found that the cross sections for and production on 12C are almost of the same magnitude. The momentum spectra of kaons were also compared with simple model calculations based on recent isobar models for elementary production processes. However, analysis of the elementary reaction was limited because of the uncertainty due to the complex many-body nature of the process on the carbon target.
As a next step, we carried out measurements of neutral kaons with NKS using a liquid deuterium target and report the results in this paper. In Sec. II, the experimental apparatus and methods are described. In Sec. III, event selection, derivation of the momentum distributions, estimation of the background and detection efficiencies are discussed. Section IV presents results for momentum spectra for the deuteron target and their comparison with theoretical predictions. The conclusion is given in Sec. V.
II Experimental apparatus
The meson was inclusively measured via the decay channel using NKS, which was constructed and installed in the second experimental hall equipped with the STB-Tagger system Yamazaki (2005) at LNS. NKS was originally used as the TAGX spectrometer at the electron synchrotron of the Institute of Nuclear Study, University of Tokyo (INS-ES) Maruyama et al. (1996). In this section, the apparatuses of the beam line and the detectors of NKS are described.
II.1 Tagged-photon beams
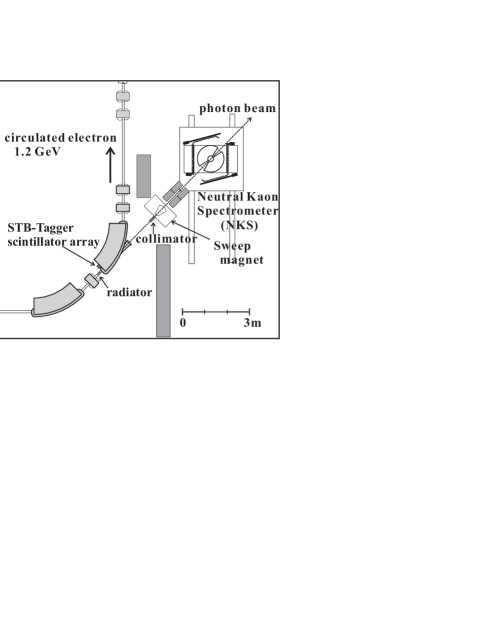
Figure 1 shows the experimental setup. A 200-MeV electron beam from the linear accelerator was injected into the STretcher Booster (STB) ring, accelerated up to 1.2 GeV typically in 1.2 s, and then stored for 20 s in the ring. Bremsstrahlung photons were generated by inserting a radiator made of a carbon fiber of 11 m at the entrance of one of the bending magnets. The generated photon energy was tagged by analyzing the momentum of a scattered electron with the bending magnet Yamazaki (2005). The tagging counter consisted of 50 plastic scintillators, the time resolution being evaluated to be 240 ps. The duty factor was about 64% with an 18 s beam every 25 s.
The tagged energy range was 0.8–1.1 GeV and the accuracy of the energy was estimated to be E = 10 MeV (see Sect. II.1.1). The total count rate of the counter array was 2 MHz on average.
As shown in Fig. 1, a sweep magnet of about 1.0 T and 0.5 m long was located between a extraction window and NKS to suppress the background of the and created at the exit window of the photon beam. In addition, a 25 cm long lead collimator with a 1.0 cm diameter aperture was placed just upstream of the sweep magnet to remove the photon beam halo. Furthermore, two helium bags were installed in the space between the sweep magnet and the target. The windows of the bags along the beam line were made of mylar film of 10 m thickness. The size of the photon beam at the target was 3–5 mm ().
II.1.1 Energy calibration
Energy calibration of the STB-Tagger system was carried out prior to the series of photoproduction experiments with NKS.
In the calibration experiment, the sweep magnet was used as a spectrometer for pairs generated in the conversion process. A copper converter of 0.9 mm was installed upstream of the magnet. The pairs were detected by a drift chamber installed downstream of the magnet. The momenta of pairs were analyzed using the magnetic field distribution calculated by the 3-dimensional finite element method program (TOSCA). Finally, the photon energy was derived by . The precision of the photon energy was determined to be 10 MeV considering the uncertainty of the magnetic field distribution.
II.2 NKS
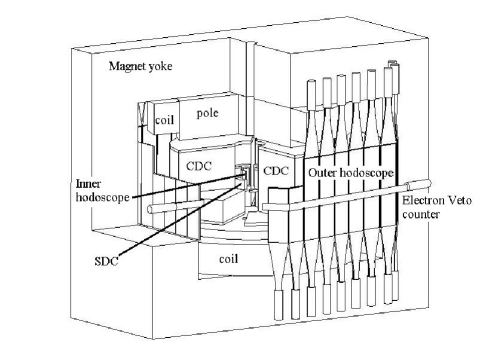
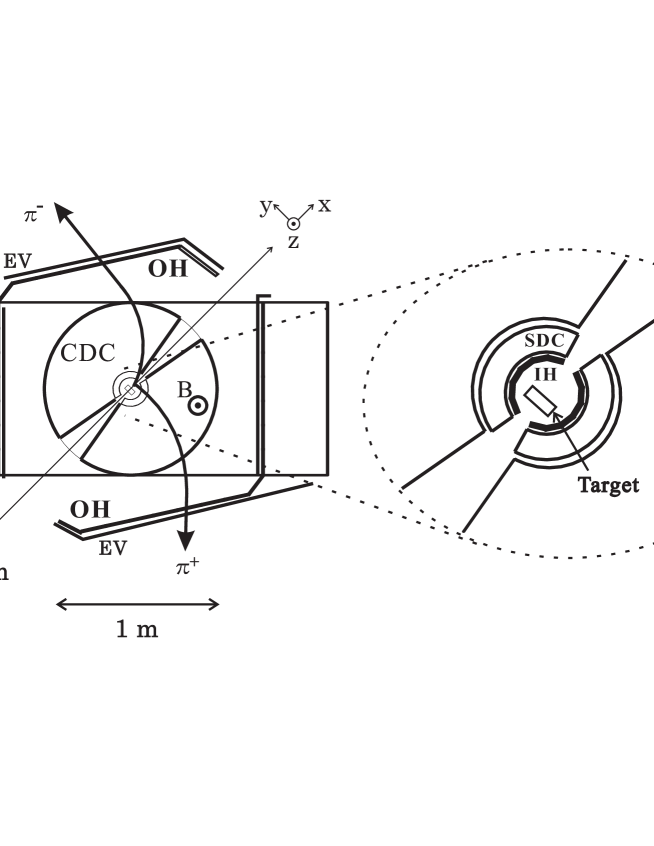
Figure 2 shows a schematic drawing of NKS and Fig. 3 shows the detector configuration. The spectrometer consisted of a 0.5-T dipole magnet of 107 cm diameter and 60 cm gap, with a pair of cylindrical drift chambers (CDC), a pair of straw drift chambers (SDC), inner and outer scintillator hodoscopes (IH, OH) and electron veto scintillation counters (EV).
IH surrounded the target 6 cm from the center. It was horizontally segmented into twelve pieces of 12 cm height and 0.5 cm thickness, covering the angular range from to . The scintillation photons were guided from the bottom end of each scintillator to the outside of the magnet gap through bundles of optical fibers about 1.5 m long. The time resolution of IH was about 470 ps ().
SDC covered the angular range from to , and the radial range from 7.18 to 10.19 cm. SDC had four layers of sense wires made of gold plated tungsten of 20 m with straw tubes made of aluminized mylar film 180 m thick. CDC covered the angular range from to , and the radial range from 13.8 to 48.6 cm. Field wires were arranged hexagonally around a sense wire. Since all the wires were vertical, the information of the track position was horizontal only. CDC had twelve layers grouped into four groups, each having three layers. In the present experiment, nine layers of the twelve were used since the third layer of each group was not active. The CDC sense wires were made of gold plated tungsten of 30 m for the inner two layers and of stainless steel for the third layers. The field wires were made of molybdenum of 100 m . The drift chamber gas was a mixture of argon (50%) and ethane (50%). High voltages were applied to the sense wires, typically 3000 V for CDC and 1900 V for SDC. The spatial resolutions were about 400 m for CDC and 500 m for SDC.
OH hodoscopes were installed outside the drift chambers. They were horizontally segmented into 34 pieces, the size of each counter being about 60 cm in height, 1.0 cm thick and typically 15 cm wide. Some of the scintillators were placed inside the magnet gap as shown in Fig. 3, and the scintillation photons were guided outside the magnet through the bundle of optical fibers. All the OH had photomultiplier tubes (PMT) at both ends and provided information on the time of flight between IH and OH with a time resolution of 510 ps. The vertical position of charged particles hitting an OH was also given by the time difference of the signals from two PMTs. The vertical position resolution of OH was about 4 cm.
The geometrical acceptance of NKS was about sr and the momentum threshold was 80 MeV/c. s were identified by the invariant mass of pair measured in coincidence with the left and right detector arms.
EV scintillators were installed on the midplane of NKS and next to the OH array, as shown in Fig. 3, in order to reject pairs which were distributed in the midplane and causing large background trigger. They covered a vertical range 2.5 cm at the OH array and therefore the NKS geometrical acceptance was reduced by about 8%.
II.3 Liquid deuterium target
The liquid deuterium target was inserted through the central holes of the pole and the yoke of the NKS magnet from the top of the yoke. The cryostat had a cylindrical part of 1200 mm long with a diameter of 100 mm for the insertion. The target cell was contained at the lower end of the cryostat. The two stage Gifford-McMahon refrigerator (Sumitomo Heavy Industry RD208B) was attached at the top of the cryostat. An oxigen free copper rod with a diameter of 25 mm and a length of 942 mm connected the second stage and the condenser placed near from the target cell. The deuterium gas was pre-cooled at the first stage, liquefied at the consenser, and then stored in the cell.
The target cell was cylindrical and placed with its axis parallel to the beam line. The length of the cylinder was 30 mm and the diameter was 50 mm. The cylindrical shell was made of aluminum of 1 mm thick and its entrance and exit window were covered with polyimide (Ube UPILEX-S) films of 75 m thick. The vacuum chamber of the cryostat surrounding the target cell was made of carbon fiber reinforced plastic (CFRP) of 1.5 mm thick. It also had a entrance window of 40 mm for the gamma beam covered with a polyimide film of 75 m thick. The target cell was placed at the 15 mm upstream from the center of NKS. The thickness and the position of the target was optimized by a simple simulation for the K0 yield.
The typical temperature of the liquid deuterium was 19 1 K; the pressure, 50 2 kPa; and the density, 0.17 g/cm3 in the data taking period. The target system was remotely controlled and monitored with a LabView program running on a Linux-PC for the easy and secure access via network.
II.4 Data acquisition system
The data for the hodoscope and tagger counters were fed into the TDC and ADC modules of the TKO Ohska et al. (1986) , then stored in a VME memory module (SMP) and read event by event by Linux-PC through a VME-PCI interface module (Bit3-617). The signals of the drift chambers were pre-amplified and sent to the amplifier–discriminator cards about 7 m away from the chambers. The digitized data were transferred by 70 m twisted pair cables to the counting room and were recorded by the Lecroy 4290 TDC system. These data were also read by Linux-PC through a CAMAC interface (TOYO CC7700).
A trigger signal was generated when more than two charged particles were detected in coincidence with the IH and OH in both the left and right arms, and at least one hit in the tagger counters. As mentioned before, no EV hits were required.
The data-acquisition efficiency was typically 90% with a trigger rate of 100 Hz.
III Analysis and results
was identified and measured by decay in the invariant mass of . () was identified from the momentum, charge and velocity. The horizontal momenta of the charged particles were calculated from the curvature of the trajectories, and the vertical momentum information was extracted assuming that a vertical projection was a straight line between the spectrometer center and the OH. The particle velocities were obtained from the flight length and the time-of-flight between the IH and OH.
III.1 Event selections
pair production was the largest source of background even using EV in the trigger level. In the analysis, pairs generated upstream of the target were removed by rejecting upstream vertex points. Figure 4(a) shows a distribution of vertex points along the beam line axis. Since the acceptance for events generated near the target was much smaller than for those generated in the upstream region, most of the events were removed. Furthermore, a cut for the opening angle (), , was applied to remove pairs because the opening angle of was much smaller than that of from decay.
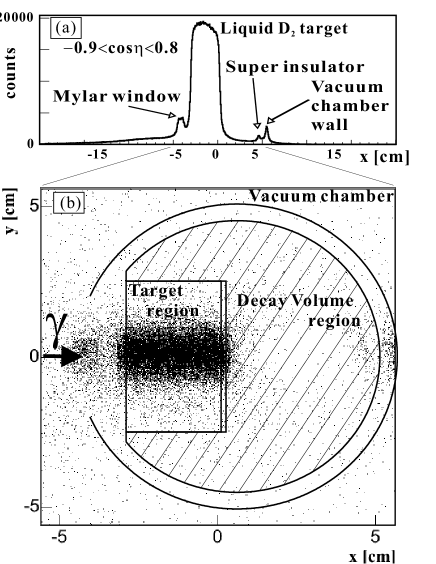
Figure 5 shows a contour plot of inversed velocities vs. momenta of particles after applying the cut of the opening angle and selecting decay points near the target. The sign of the momentum represents the charge of the particle. The particles were identified by selecting the region-defined-lines in Fig. 5.
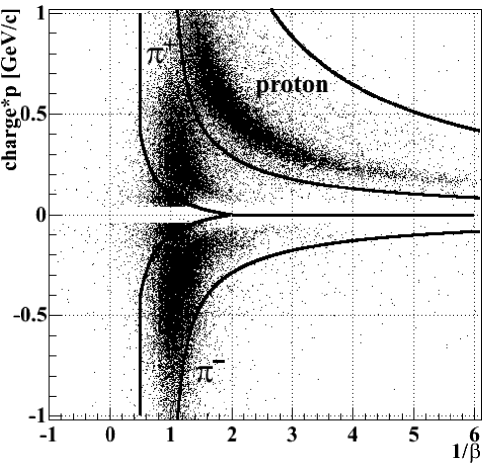
Figure 4(b) shows the vertex point distribution around the target for events. The materials around the target are also indicated in the figure. The resolution of the x-position of the vertex was about 1.3 mm.
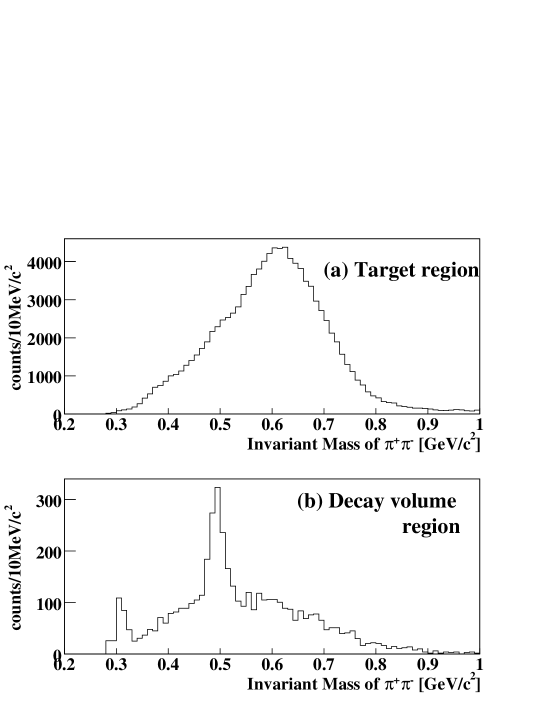
Figure 6 shows the spectra of the invariant mass for events with vertex points in the target (a) and out of the target (b). For events in the target region, events were hidden in the invariant mass spectrum since the spectrum is dominated by processes not involving strangeness, such as production of , nucleon resonances and others. These particles immediately decay by the strong interaction. In contrast, for events whose vertex points were reconstructed outside of the target, a peak of is clearly seen because a considerable fraction of decays outside of the target due to the relatively long life time of 2.68 cm. Thus, we defined the decay volume as the hatched area shown in Fig. 4(b) to select .
III.2 Background estimation
Even after the background was suppressed as described in the previous section, a background contribution still exists in the invariant mass spectrum as shown in Fig. 6. The possible origins of the background were considered to come from
- (1)
-
imperfect rejection of non-strangeness events such as production due to the finite resolution of the vertex points, and
- (2)
-
combinatorial background of , such as from and from .
The shape of background (1) was assumed to be the same as that of events whose vertex points were reconstructed in the target region because those events were considered to have almost the same kinematics. On the other hand, the shape of background (2) was evaluated by Geant4 simulation.
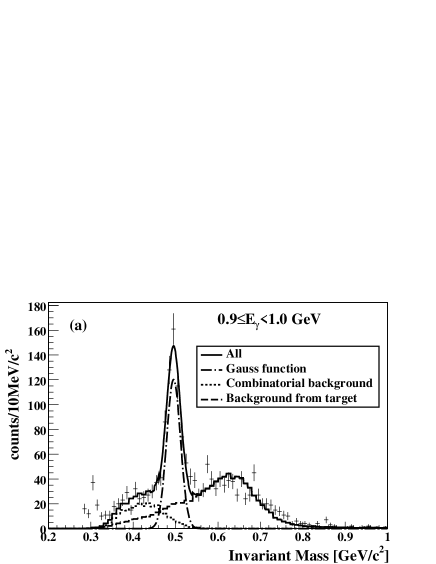
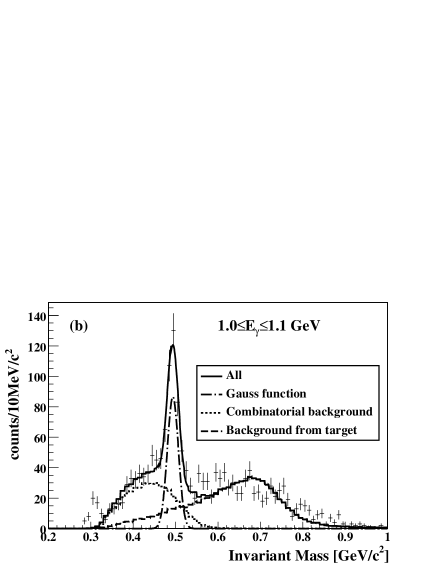
Figure 7 shows invariant mass spectra fitted assuming a Gaussian shape for the peak and the pre-determined shapes for the two backgrounds. The fitting errors of the background spectra were typically 4% for (1) and 8% for (2). The widths of the peak around 0.5 GeV/c2 were 16.2 0.8 MeV/c2 for the lower beam energy region ( GeV) and 13.0 1.4 MeV/c2 for the higher beam energy region ( GeV). In further analysis, the mass gate between 0.46 and 0.54 GeV/c2 was applied to select events.
III.3 momentum spectra
The differential cross section of neutral kaons is given by
where , and are the number of selected events, the number of photons bombarding the target and the number of target neutrons, respectively. and are the momentum and the emitted angle to the photon beam line in the laboratory frame, is the acceptance of NKS for detection, is the data taking efficiency, is the tracking analysis efficiency, and is the efficiency due to the gating mass spectrum.
The acceptance ()shown in Fig. 8(left) was evaluated by analyzing the simulated data generated by the Geant4 program taking into account the geometry of NKS, the trigger condition and detector resolutions.As demonstrated in Fig. 8, the acceptance reached a broad maximum in the forward region and momentum region of about 0.3 GeV/c.
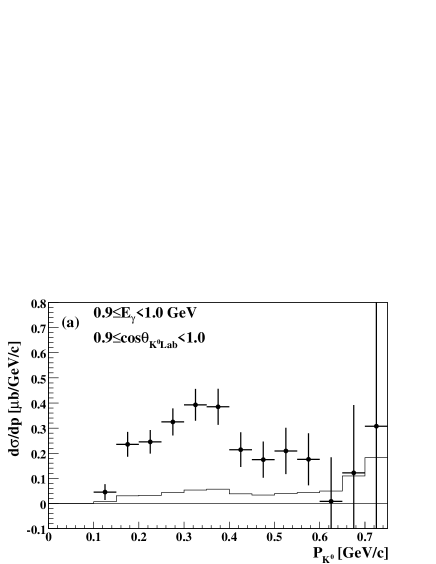
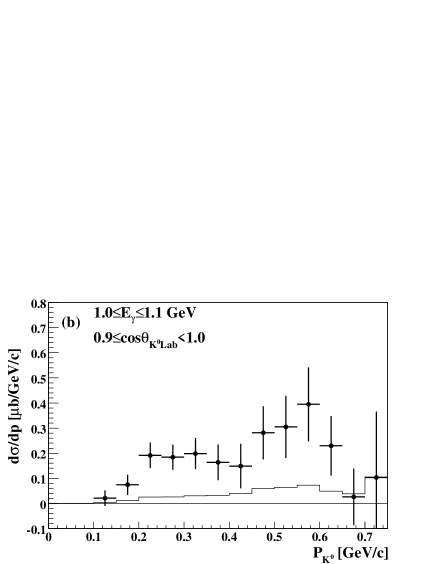
In the following, the data in the selected region, GeV and as indicated in Fig. 8(right), are analyzed.
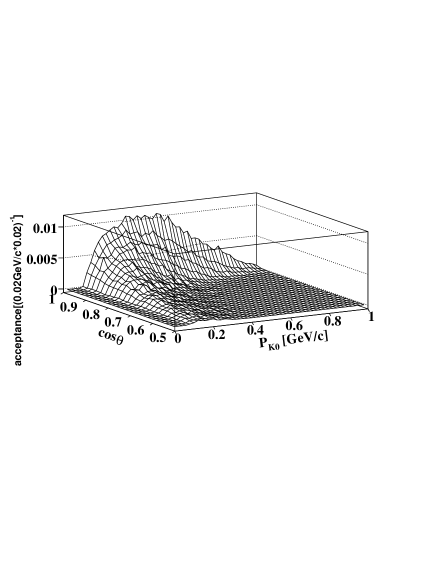
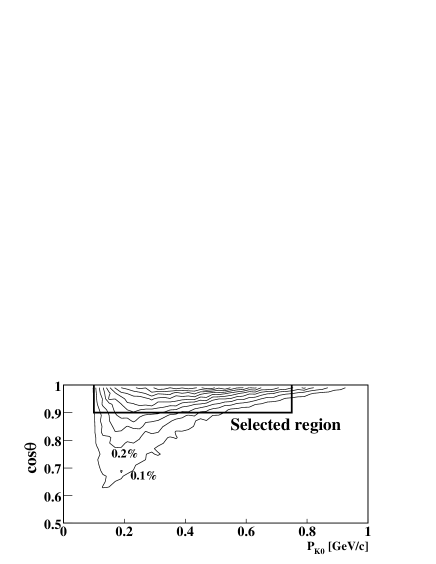
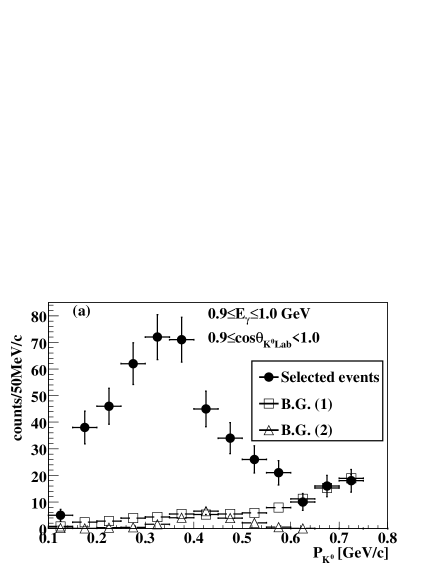
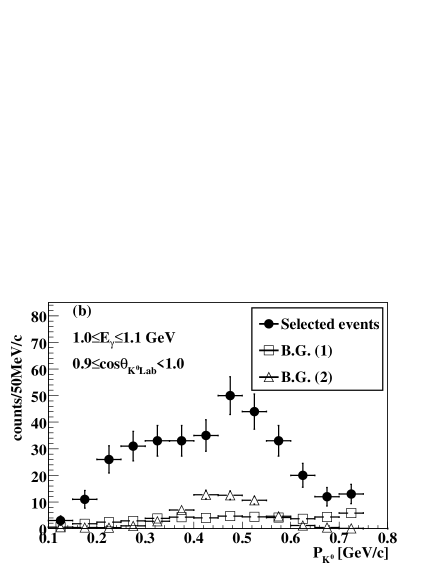
Figure 9 shows the momentum distribution in the selected regions for the two beam energies. The contributions of the backgrounds described in Sect. III.2 are also overdrawn.
The number of tagged photons irradiating the target () was obtained to be 1.031010 for GeV, 1.161010 for GeV and 1.031010 for GeV from the scaler counts of tagging counters after correcting for the tagging efficiency and the analysis efficiency of the tagging counter array. The tagging efficiency was estimated using the data by a lead glass Čerenkov counter (LG) positioned 260 cm downstream from the experimental target position on the beam line. The efficiency of tagger counter was totally derived to be 71%.
The density of the deuterium target () was evaluated to be 0.173 g/cm3 from its temperature and vapor pressure. The expansion of the target cell due to the pressure of liquid deuterium was estimated by a finite element method and was found to be 1.58 mm for both sides. Therefore, the typical area density was obtained to be 0.1721024 [cm-2].
The tracking efficiency () was estimated to be typically 81.4% using single-track events. It has a small dependence on the emission angle of the track due to a high counting rate at the forward angles. The efficiency decreases by 5% at most in the very forward angle and this dependence was taken into account in the analysis.
Table 1 summarizes the efficiencies and their statistic and systematic errors.
| value | statistical error | systematic error | |
|---|---|---|---|
| 95.4% | 0.1% | 4% | |
| 3.221010 | 1.0% | 4.7% | |
| 0.172 [barn-1] | 0.1% | 0.6% | |
| 89.1% | 0.1% | 1.0% | |
| 81.4% | 0.1% | 8.1% |
The total systematic error was estimated to be about % by the square-root of the sum of the squares of the listed efficiencies.
Taking into account all these efficiencies, momentum spectra were derived in the two photon-energy regions as shown in Fig. 10. The contributions of the background were subtracted in the cross sections.
IV Discussions
IV.1 Theoretical calculations
The inclusive cross sections for the process, where , and , and is the corresponding nucleon, were compared with a simple spectator model calculation in the plane wave impulse approximation with a spectator nucleon () Bydzovsky et al. (2004). The energy of the target nucleon () is given by for the off-shell approximation, to satisfy energy conservation in the elementary process, and by for the on-shell approximation. The effective mass of the target nucleon is determined as and . The momentum distribution of the target nucleon is described by the non-relativistic Bonn deuteron wave function OBEPQ (one boson exchange potential in q-space) Machleidt et al. (1987).
Differences in results caused by employing the on- and off-shell approximations and other deuteron wave functions were found to be small or negligible in the kinematical region studied in the present experiment Bydzovsky et al. (2004). In the following analysis, we use the off-shell approximation. Moreover, we assume that the contribution of the final-state interaction to the inclusive kaon momentum distribution Salam et al. (2006) is small in our kinematics and therefore that our model is sufficient for a description of the process (at least in the quasi-free region).
The largest uncertainty in the calculated momentum distribution came from the choice of the elementary amplitude Bydzovsky et al. (2004). We used three different models for the elementary amplitude, two isobar models, Kaon-MAID Lee et al. (2001) and Saclay-Lyon A (SLA) Mizutani et al. (1998), and a simple phenomenological prescription, to analyze the angular dependence of the elementary cross section in the center-of-mass frame (c.m.).
In the isobar models, the cross sections for channels that include in the final state were calculated assuming isospin symmetry for the strong coupling constants and appropriately adopting electromagnetic coupling constants for the neutral mode by replacing those for the charged mode Lee et al. (2001). For the t-channel meson resonances, the ratio of the coupling constants for neutral and charged modes is related to the ratio of the decay widths, which is well known for *(892) but unknown for the resonance Yao et al. (2006). The ratio for the latter, , is therefore treated as a free parameter and has to be determined from data. In the case of the Kaon-MAID model, the cross section of the reaction can be predicted since the parameter was determined by simultaneous fitting of the channel.
On the other hand, in the SLA model, the parameters were adjusted only from production data and the model cannot predict the channel contributions. If the value determined in Kaon-MAID is used in SLA, it gives a cross section several times larger than that of Kaon-MAID. Therefore, when production is calculated with SLA, is assumed as a free parameter.
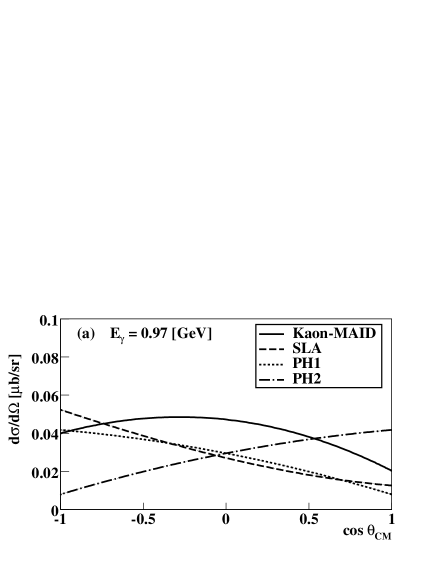
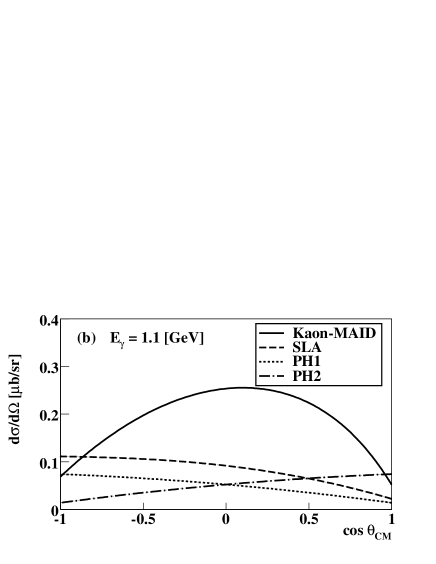
In order to show the angular dependence of the elementary cross section preferred by the data, a simple phenomenological parameterization in c.m., named PH, was also used:
| (1) |
Here are Legendre polynomials, , is the square of the photon–nucleon c.m. energy, and GeV2, the threshold. Since the invariant cross-section is inversely proportional to the final c.m. momentum, which behaves as near the threshold, the energy dependent factor of this form is included in (1) to regularize the invariant cross section.
IV.2 Comparison of data with calculations
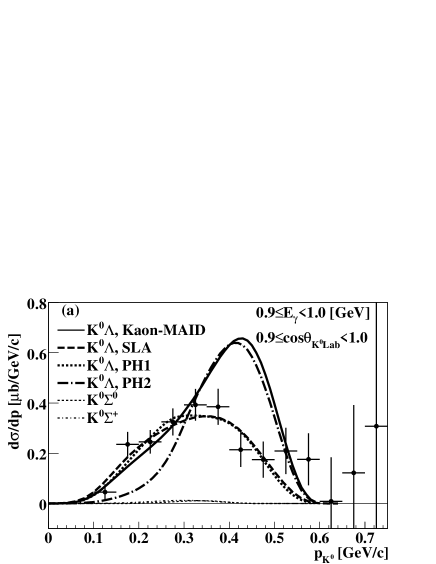
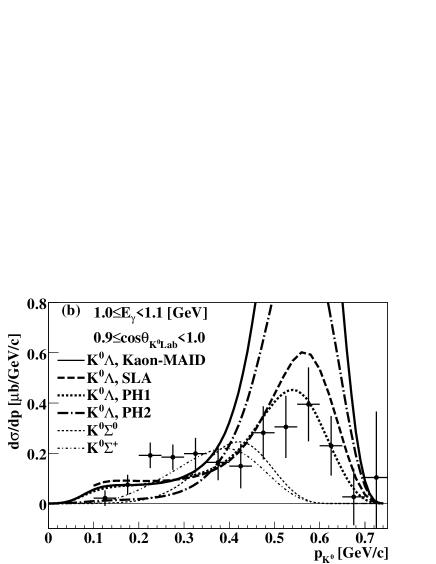
The measured inclusive spectra of the channels are shown in Fig. 11 together with theoretical curves. Contributions of the photoproduction processes calculated with Kaon-MAID are also shown. These contributions are estimated to be at the very most 5% in the lower photon-energy region but up to 60% at the momentum of 0.3 GeV/c in the higher photon-energy region. Therefore, the parameter of SLA was deduced from the data only in the lower photon-energy region where the contribution of the channels is sufficiently small. The enhancement of the data points around 0.3 GeV/c seen in the higher photon-energy region can be attributed to photoproduction, which however cannot be evaluated with SLA.
In both energy regions, it is found that Kaon-MAID gives cross sections larger than the present measured spectra and the shape of the calculated momentum spectra are considerably different from that of the data.
The theoretical spectrum with SLA was fitted with the parameter in the lower photon-energy region. The magnitude and shape of the momentum spectrum are reproduced well for . Note that this value is related to the ratio of the decay width of the meson, . The magnitude of the cross section in the higher energy region is reproduced better by SLA than Kaon-MAID.
The difference of the shape of the momentum spectra in the laboratory system between Kaon-MAID and SLA in the lower photon-energy region is caused by the different angular distribution of the elementary cross sections in the c.m. system, as shown in Fig. 12. The data, therefore, suggest that an enhancement of the elementary cross section in the backward hemisphere is crucial to explain the momentum spectrum shape. On the other hand, in the higher photon-energy region, the difference of the momentum spectra is due not only to the angular distribution but also to the magnitude of the cross section, as seen in Fig. 12(b).
To confirm these points, the spectrum in the lower photon-energy region were fitted by Eq. 1, in which the angular distribution is given by Legendre polynomials up to second order. The best fit parameters (PH1) were obtained: , , and with . The phenomenological parametrization with the opposite sign of (PH2), giving the inverse angular distribution to that of PH1 is also shown in Fig. 11 and 12. In Fig. 11, it is shown that PH1, having a backward angular distribution in c.m. similar to that of SLA, gives a very good agreement with the present data in both photon-energy regions. On the other hand, PH2, giving a momentum spectrum similar to that of Kaon-MAID and a forward peaked angular distribution in contrast to PH1, clearly contradicts the present result. Thus, a comparison of the data and predictions of models favors an angular distribution of the reaction in the c.m. system that is peaked at backward angles.
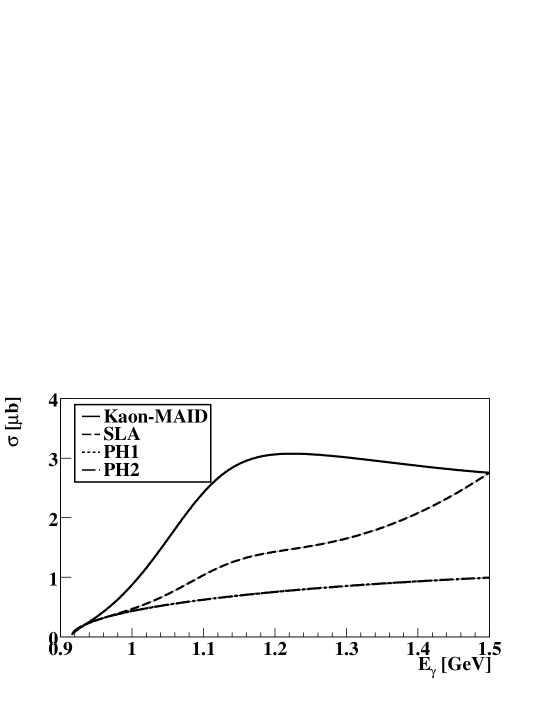
In Fig. 13, the photon energy dependence of the total cross section for photoproduction is given for SLA with , Kaon-MAID and the PH1 and PH2 parameterizations. The total cross sections are not obtained in the present experiment due to the limited kinematical acceptance for . Kaon-MAID predicts a very sharp rise in the photon-energy dependence of the total cross section near the threshold ( GeV), while SLA, as well as PH1 and PH2, gives a flatter energy dependence and much smaller cross section in the threshold region.
V Summary
photoproduction on a deuterium target was studied in the threshold region for the first time. The experiment was conducted at LNS of Tohoku University following the measurement of quasi-free photoproduction of on a carbon target.
Inclusive momentum distributions were obtained and compared with theoretical calculations. The calculations were performed in the plane wave impulse approximation using a realistic Bonn wave function OBEPQ for a deuteron, firstly with the recent isobar models, Kaon-MAID and Saclay-Lyon A, and secondly with simple phenomenological parameterization. Based on the comparison, the angular distributions of the elementary cross sections were examined.
The best agreement with the data was achieved with the SLA model, in which the ratio of the neutral-to-charged electromagnetic coupling constants for the meson was obtained to be = 2.09 by fitting data in the photon energy region, –1.0 GeV, and with phenomenological parametrization fitted in the photon energy region, –1.0 GeV. Both models show enhancement of the c.m. cross section in the backward hemisphere. The present result, therefore, sets constraints on models for the photo- and electroproduction of kaons in the threshold region. This study shows that the reaction with its unique feature is important for the investigation of the strangeness photoproduction.
VI Acknowledgment
This work is supported by Grants-In-Aid for Scientific Research from The Ministry of Education of Japan, Nos. 09304028, 12002001, and 14740150 and by the Grant Agency of the Czech Republic under grant No. 202/05/2142.
References
- Anderson et al. (1968) R. L. Anderson, E. Gabathuler, D. Jones, B. D. McDaniel and A. J. Sadoff, Phys. Rev. Lett. 9, 131 (1968).
- Peck (1964) C. W. Peck, Phys. Rev. 135, B830 (1964).
- Groom (1967) D. E. Groom, Phys. Rev. 159, 1213 (1967).
- Bleckmann et al. (1970) A. Bleckmann et al., Z. Phys. 239, 1 (1970).
- Fujii et al. (1970) T. Fujii et al., Phys. Rev. D 2, 439 (1970).
- Feller et al. (1972) P. Feller, D. Menze, U. Opara, W. Schulz, and W. J. Schwille, Nucl. Phys. B39, 413 (1972).
- Erbe et al. (1969) R. Erbe et al. Phys. Rev. 188, 2060 (1969).
- Althoff et al. (1978) K. H. Althoff et al., Nucl. Phys. B137, 269 (1978).
- Thom (1966) H. Thom, Phys. Rev. 151, 1322 (1966).
- Glander et al. (2004) K. H. Glander et al. (SAPHIR), Eur. Phys. J. A19, 251 (2004).
- Bradford et al. (2006) R. Bradford et al. (CLAS), Phys. Rev. C 73, 035202 (2006).
- Sumihama et al. (2006) M. Sumihama et al. (LEPS), Phys. Rev. C 73, 035214 (2006).
- Bradford et al. (2007) R. Bradford et al. (CLAS), Phys. Rev. C 75, 035205 (2007).
- Adelseck and Saghai (1990) R. A. Adelseck and B. Saghai, Phys. Rev. C 42, 108 (1990).
- Williams et al. (1992) R. A. Williams, C. R. Ji, and S. R. Cotanch, Phys. Rev. 46, 1617 (1992).
- David et al. (1996) J. C. David, C. Fayard, G. H. Lamot, and B. Saghai, Phys. Rev. C 53, 2613 (1996).
- Bennhold and Wright (1989) C. Bennhold and L. E. Wright, Phys. Rev. C 39, 927 (1989).
- Janssen et al. (2001) S. Janssen, J. Ryckebusch, D. Debruyne, and T. Van Cauteren, Phys. Rev. C 65, 015201 (2001).
- Mizutani et al. (1998) T. Mizutani, C. Fayard, G. H. Lamot, and B. Saghai, Phys. Rev. C 58, 75 (1998).
- Lee et al. (2001) F. X. Lee, T. Mart, C. Bennhold, and L. E. Wright, Nucl. Phys. A695, 237 (2001).
- Li et al. (1992) X. D. Li, L. E. Wright, and C. Bennhold, Phys. Rev. C 45, 2011 (1992).
- Watanabe et al. (2007) T. Watanabe et al., Phys. Lett. B651, 269 (2007).
- Yamazaki et al. (1995) H. Yamazaki et al., Phys. Rev. C 52, 1157 (1995).
- Yamazaki (2005) H. Yamazaki, NIM A536, 70 (2005).
- Maruyama et al. (1996) K. Maruyama et al. (TAGX), Nucl. Instrum. Meth. A376, 335 (1996).
- Ohska et al. (1986) T. K. Ohska et al., IEEE Trans. Nucl. Sci. 33, 98 (1986).
- Bydzovsky et al. (2004) P. Bydzovsky, M. Sotona, O. Hashimoto, and T. Takahashi (2004), eprint nucl-th/0412035.
- Machleidt et al. (1987) R. Machleidt, K. Holinde, and C. Elster, Phys. Rept. 149, 1 (1987).
- Salam et al. (2006) A. Salam, K. Miyagawa, T. Mart, C. Bennhold, and W. Glockle, Phys. Rev. C 74, 044004 (2006), eprint nucl-th/0608053.
- Yao et al. (2006) W. M. Yao et al. (Particle Data Group), J. Phys. G33, 1 (2006).