An infrared view of (candidate accretion) disks around massive young stars.
Abstract
Near-infrared surveys of high-mass star-forming regions start to shed light onto their stellar content. A particular class of objects found in these regions, the so-called massive Young Stellar Objects (YSOs) are surrounded by dense circumstellar material. Several near- and mid-infrared diagnostic tools are used to infer the physical characteristics and geometry of this circumstellar matter. Near-infrared hydrogen emission lines provide evidence for a disk-wind. The profiles of the first overtone of the CO band-heads, originating in the inner 10 AU from the central star, are well fitted assuming a keplerian rotating disk. The mid-infrared spectral energy distribution requires the presence of a more extended envelope containing dust at a temperature of about 200 K. CRIRES observations of CO fundamental absorption lines confirm the presence of a cold envelope. We discuss the evolutionary status of these objects.
1 European Southern Observatory, Karl-Schwarzschild
Strasse 2, Garching-bei-München, D85748, Germany,
2 Instituto de Astrofísica de Canarias, 38200 La Laguna, Tenerife, Spain
3 Institute for Astronomy, The University of Edinburgh, Royal Observatory, Blackford Hill, Edinburgh EH9 3HJ, United Kingdom
4 Instituut voor Sterrenkunde, Celestijnenlaan 200D, B-3001 Leuven, Belgium
5 Astronomical Institute ”Anton Pannekoek”, University of Amsterdam, Kruislaan 403, 1098 SJ Amsterdam, The Netherlands
1. Introduction
The observational study of high-mass star-forming regions is hampered by the fact that they are so unique, and thus, on average distant. Additionally, the actual formation happens deeply obscured inside molecular clouds behind hundreds of magnitudes of visual extinction. The actual formation sites are only observable at radio and (sub)mm wavelengths. These observations, however, only provide indirect information about the forming stars. The Lyman continuum photon rate derived from the radio flux or the integrated infrared luminosity provides an estimate on the properties of the massive star(s). Only after the stars are formed and start to clear out their environment, they become observable at shorter wavelengths. The near-infrared window is ideally suited to study the massive stars in this evolutionary phase. The photosphere and close circumstellar environment of the young massive stars can be detected as the extinction is modest and the thermal emission of the surrounding molecular cloud is not dominant.
Recent imaging and spectroscopic surveys have revealed the stellar content of high-mass star-forming regions (Hanson et al. 2002; Kendall et al. 2003; Alvarez et al. 2004; Bik, 2004; Blum et al. 2004; Bik et al. 2005, 2006; Kaper et al. 2007). Several types of objects were classified in these complex regions. A large number of OB stars have been identified by their photospheric lines (Watson & Hanson 1997; Hanson et al. 2002; Bik et al. 2005) and their properties do not seem to differ from OB main sequence field stars observed in the optical. Another class of high-mass objects identified are the massive Young Stellar Objects. Their near-infrared colors indicate an infrared excess, and their near-infrared spectra are dominated by emission lines from ionized (hydrogen, helium) as well as neutral species, e.g. CO (Kendall et al. 2003; Blum et al. 2004; Bik et al. 2006).
These spectroscopic features as well as the infrared excess can be used to derive the physical parameters of the cirumstellar material and try to understand the evolutionary status of these objects. The detection and study of disks around young massive stars that are remnants of the formation process is key to our understanding of the formation of massive stars (Zinnecker & Yorke 2007).
2. Near- and Mid-Infrared diagnostic tools
In this section the different diagnostic tools available in the near and mid-infrared window will be discussed. Line ratios of ionized hydrogen lines are used to trace the physical conditions and geometry of the ionized circumstellar material. The line profiles of the CO first overtone emission provide kinematic information about the dense, neutral gas in the inner 5 - 10 AU. Extended envelopes, located further away from the central star can be detected at longer wavelengths.
2.1. Ionized gas
One of the spectral characteristics of the massive YSOs is that they show lines emitted by the recombination of hydrogen and helium. In the K-band, not only Br, but also weaker lines of the hydrogen Pfund series (Pf23 - Pf 33) are observed, as well as HeI lines in some cases (Bik et al. 2006). The HeI lines indicate the presence of a hot ionizing source with a spectral type of at least late - mid O (Hanson et al. 2002).
The hydrogen lines can be used to obtain an estimate on the density of the emitting gas. The Pfund lines are high-density tracers which are only emitted in very dense gas (Ne up to 109 cm-3). These lines likely originate in a circumstellar disk. This is, moreover, supported by the very broad line profiles (300 - 500 km s-1) or by double peaked profiles in a few objects. Br, on the other hand, can be emitted in a large range of environments with different densities. It can be associated to diffuse HII regions, stellar winds, disk-winds, or very dense gaseous disks around Be stars. Also here, the observed spectral profile can help to discriminate between possible scenarios. The observed velocities of Br are in the range of 100 - 200 km s-1. This excludes the possibility that the lines are of nebular origin. The recombination lines in an HII regions have a broadening similar to the local sound speed which is on the order of 20 km s-1 for ionized gas. Also, the origin in a stellar wind can be excluded as the velocity profiles of stellar winds show very broad lines (500 - 2000 km s-1). Double peaked Br emission in some massive YSOs clearly favors the disk-scenario (Blum et al. 2004). However, not all the Br lines show this profile and a contribution of the disk-wind cannot be excluded for these. The observed velocity of the Br line is consistent with the disk-wind scenario.
A disk-wind is caused by the interaction between the UV photons and the ionized upper layer of the disk. This results in a radiation driven, outflowing disk-wind with velocities up to 200 km s-1(Drew et al. 1998). In a disk-wind, the average density of the emitting ionized gas is lower than in a geometrically thin circumstellar disk. This will affect the relative strength of the hydrogen lines. While in low density regions (e.g. in an HII region), the relative strength of hydrogen lines follows the optically thin (case B) approximation (Storey & Hummer 1995); in high density regions, where the gas is optically thick, the relative strength of the lines is determined by the emitting surface of the gas.
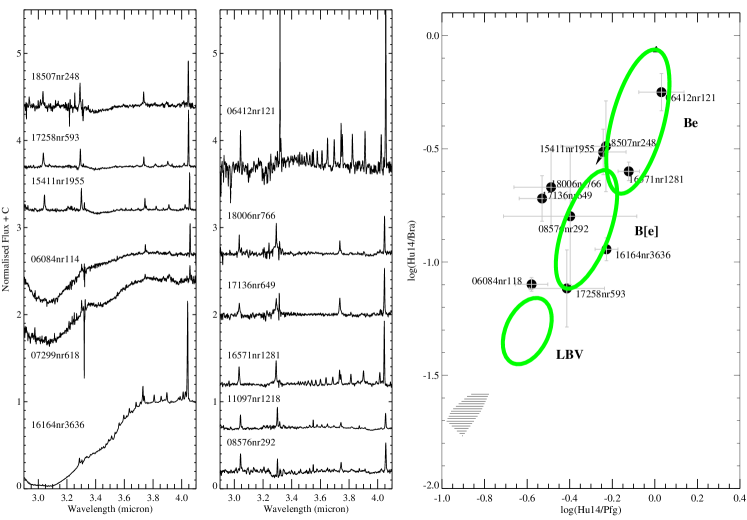
Lenorzer et al. (2002) constructed a diagnostic diagram using 3 specific hydrogen lines in the L-band (Br, Hu14 and Pf) to demonstrate this method. The ratio of Hu14 over Br spans a range of 2 orders of magnitude (from 0.02 in case of an optically thin HII region to unity in the case of an optically thick emitting medium). In order to calibrate the diagram and to relate it to different circumstellar environments, Lenorzer et al. (2002) used the observed line ratios of massive stars with a known circumstellar geometry (Fig 1b). Three different types of objects were chosen; Luminous Blue Variables (LBVs), evolved massive stars with a very strong stellar wind, B[e] stars with an equatorially flattened dense stellar wind or disk and the Be stars with an optically thick, geometrically thin ionized disk. The location of these respective objects is plotted in Fig 1b as circles. The Be stars fall as expected close to the optically thick location while the LBV stars are located more in the direction of the optically thin material.
We observed a sample of 12 massive YSOs in the L-band with ISAAC at the VLT (Fig. 1a) and measure the line ratios to compare them with the location of the well studied massive stars in the diagram. In Fig 1b the massive YSOs which have all the 3 hydrogen lines in their spectrum are overplotted on the diagram.
The location of the massive YSOs overlaps that of the B[e] and Be stars. First this confirms that the ionized emitting region of the massive YSOs is, at least partially, confined into a disk. The span in location implies large differences from object to object for the averaged densities of the ionized circumstellar gas.
A possible explanation for this, is that some objects are surrounded by a geometrically thin and confined disk (similar to Be disk) while others have disks that are more puffed up as expected when the disk is under the process of being photo-evaporated.
2.2. CO first overtone emission
Additional to the ionized lines, lines emitted by neutral species are observed in the spectra of massive YSOs. Among the most prominent features in the near-infrared are the CO first-overtone emission lines. These bands are observed in about 25% of all the massive YSOs (e.g Chandler et al. 1993, 1995; Bik & Thi 2004; Blum et al. 2004). The CO bandheads are emitted in neutral material with temperatures between 2000 and 5000 K and densities of about 1010 cm-3. This hot neutral gas is located in the inner, dust-free regions of the circumstellar environment, relatively close to the star.
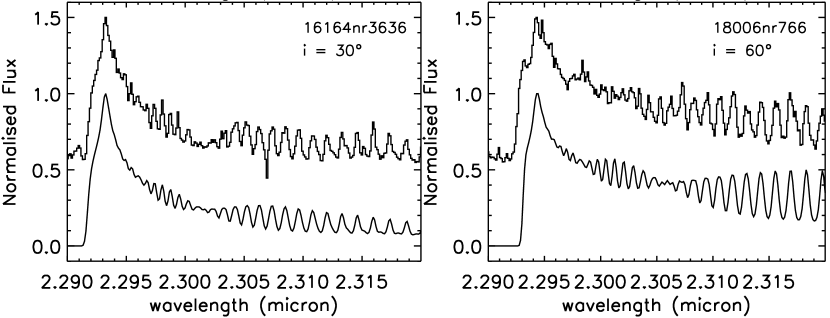
The kinematic information provided by high resolution spectra of the bandheads can be used to constrain the location of the emitting material in the circumstellar matter. Moreover, intrinsically, the blue side of the bandhead is very steep and different velocity profiles give rise to a different shape of the bandhead. Keplerian disks create a blue wing on top of the profile (Fig 2). This blue wing cannot be explained by a gaussian velocity distribution. Bik & Thi (2004) and Blum et al. (2004) succesfully fit the high-resolution CO spectra with a emission profile from a rotating disk, assuming optically thin emission.
This model also shows that the CO is emitted very close to the central star, in the inner 5-10 AU of the circumstellar environment. At these distances from the central star, the CO molecules need to be shielded from the UV photons in order not to be photo-dissociated. Therefore, this gas cannot be located at the surface of the disk, that would be ionized by the stellar radiation. The optical thickness rises steeply in the radial direction, shielding the midplane of the disk from the UV radiation, allowing the material to become neutral and the CO molecules to survive.
2.3. Spectral energy distributions
One of the main characteristics of massive YSOs is that they have an infrared excess. Their Spectral Energy Distribution (SED) is not dominated by photospheric emission, but by the emission of circumstellar matter, mainly dust emission. The near-infrared emission lines, as discussed in the previous subsections trace the ionized or hot neutral gas in the circumstellar environment. The infrared SED traces the warm material (down to a few 100 K) in the cirmstellar environment located further away from the central star.
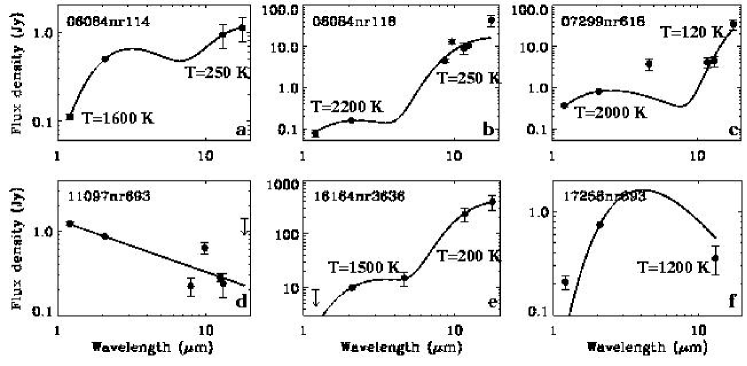
We have performed photometry of a sample of massive YSO covering the wavelength range from 1 to 20 m using the ESO instruments SOFI, TIMM2 and VISIR (see Fig. 3 for some examples). The observed SEDs are dereddened using extinction values determined by Bik et al. (2006). The SEDs show a large range in spectral slopes, suggesting large differences in the properties of the circumstellar environment. They vary from blue slopes (Fig 3, panel d) to very red slopes (panels b,c and e).
The SED of the bluest object in our sample (11097nr693) cannot be explained by dust emission. The blue slope can only be produced by optically thick free-free emission from e.g. a gaseous disk like in Be stars. The SED can be fitted with a powerlaw, with a slope typical for Be stars (Waters et al. 1991). Surprisingly, the SED around 10 m suggests the presence of silicate emission, not expected in a gaseous disk. This could be caused by a contribution of the high background from the surrounding HII region.
The other objects have a much redder SED, and their SED can be explained by dust emission. Overplotted to the observed data in Fig. 3 is the best fit using a one or two temperature blackbody. The objects fitted with a 2 temperature blackbody show that a colder component (T 200 K) tracing dust further away is needed to explain the shape of the SED. These objects also are spatially resolved at mid-infrared wavelengths and their observed size becomes larger with wavelength. For one of the reddest objects, 16164nr3636, the size of the 10 and 20 m emission extends up to 7500 AU away from the central star. Far-infrared observations of this source reveal a strong point source with a derived mass of about 200M (Karnik et al. 2001).
2.4. Absorption spectroscopy with CRIRES

Another way to study the outer regions of the circumstellar material is the analysis of absorption lines of e.g. CO towards a bright background. As part of the Science Verification observations (Siebenmorgen et al. 2007) for CRIRES, one of the latest VLT instruments, we observed one massive YSO (IRAS 16164-5046) at 4.5 m to detect the 12CO lines of the fundamental transitions. The spectral resolution of these observations is R = 50,000 (6 km s-1). The 12CO lines we observe are in absorption and show multiple components. In Fig. 4, the R(7), R(4) and R(0) lines of 12CO lines are plotted. In all the spectra, a saturated absorption profile is present at -5.5 km s-1. In the spectrum of the R(4) line a second absorption is present at +5.5 km s-1. This line is not present in the R(7) spectrum but it appears even stronger in the R(0) line. This suggests that this line is absorbed in very cold material of a few 10 K. The cold envelope detected in the far-infrared observations of Karnik et al. (2001) is likely the material that causes the saturated absorption profile of the 12CO lines. The other component could be related to the source, but also to a cold molecular cloud in the line of sight.
3. Summary and Evolutionary status
Several different diagnostic tools are discussed to obtain information about the physical and kinematical properties of the circumstellar material. The different diagnostics trace different physical conditions and therefore different locations in the circumstellar environment of the massive YSOs. Based on the collection of observations a sketch can be drawn on how the circumstellar environment of the massive YSOs could look like. In Fig. 5 the different environments and their distance to the central star are sketched. Note that not all the objects have all the characteristics discussed here, some only show a subset of them.
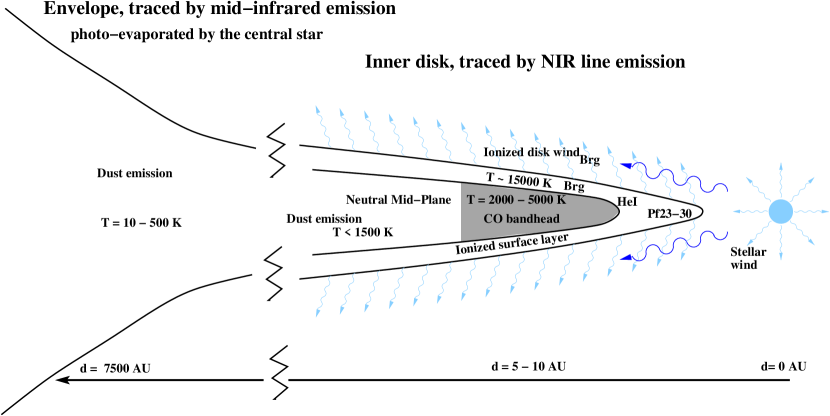
Stellar photons ionise the surface layer of the inner disk, which recombination is observed in the hydrogen and HeI lines; the radiation pressure exerced onto the surface layer also drives matter away in the form of a disk wind. In some objects the inner parts of the disk are so dense that the mid-plane can become neutral as it is shielded for the UV photons. In these regions (the inner 5 - 10 AU) originate the CO bandhead emission showing evidence for keplerian rotation. Further out, the midplane of the disk cools even more and dust is able to survive giving rise to a red SED observed in the mid-infrared. A few objects show evidence for a cold dust component suggesting the presence of a more extended envelope. Most objects, however, are not detected in the mm regime, suggesting that they lack a large reservoir of very cold dust or gas.
This illustrates the difference with the objects discussed by Zhang (2007) where large disks are detected in the (sub) mm regime. Still in the process of formation, these objects are too embedded to be detected in the near-infrared. Likely these large and cold outer regions of the circumstellar material are (being) photo-evaporated away. Photo-evaporation first leads to the disruption of the outer disk, while the inner disk can survive much longer (Hollenbach et al. 1994). The inner disk is what is detected at near- and mid-infrared wavelengths. Objects for which the observations indicate the presence of an envelope might be the younger objects of our sample. Another important factor in the photo-evaporation process is the amount of UV photons emitted by the central star. This can drastically influence the dispersion time scales. A larger sample would be needed to disentangle these effects.
References
- Alvarez et al. (2004) Alvarez C., Feldt, M., Henning, T., Puga, E., Brandner, W., Stecklum, B., 2004, ApJS, 155, 123
- Bik, (2004) Bik, A. 2004, PhD thesis, ”The stellar content of high-mass star-forming regions”, University of Amsterdam, The Netherlands
- Bik & Thi (2004) Bik, A. & Thi, W-.F., 2004, A&A, 427, L13
- Bik et al. (2005) Bik, A., Kaper, L., Hanson, M.M., Smits, M., 2005, A&A, 440, 121
- Bik et al. (2006) Bik, A., Kaper, L. Waters, L.B.F.M., 2006, A&A455, 561
- Blum et al. (2004) Blum, R.D., Barbosa, C.L., Damineli, A., Conti, P.S., Ridgway, S., 2004, 617, 1167
- Chandler et al. (1993) Chandler, C.J. Carlstrom, J.E., Scoville, N.Z., Dent, W.R.F, Geballe, T.R., 1993, ApJL, 412, L71
- Chandler et al. (1995) Chandler, C.J. Carlstrom, J.E., Scoville, N.Z., 1995, ApJ, 446, 793
- Drew et al. (1998) Drew, J. E., Proga, D., Stone, J. M., 1998, MNRAS, 296,L6
- Hanson et al. (2002) Hanson, M. M., Luhman, K. L., Rieke, G. H., 2002, ApJS, 138, 35
- Hollenbach et al. (1994) Hollenbach, D., Johnstone, D., Lizano, S., Shu, F., 1994,ApJ,428,654
- Karnik et al. (2001) Karnik, A. D., Ghosh, S.K., Rengaranjan T.N., Verma, R., P., 2001, MNRAS, 326,293
- Kaper et al. (2007) Kaper, L. Bik, A. Hanson, M.M., Comerón, F., 2007, A&A, in press
- Kendall et al. (2003) Kendall, T. R., de Wit, W. J., Yun, J. L., 2003, A&A408, 313
- Lenorzer et al. (2002) Lenorzer, A., de Koter, A., Waters, L. B. F. M., 2002, A&A, 386, L5
- Siebenmorgen et al. (2007) Siebenmorgen. Ralf., Smette, Alain; Käufl, Hans Ulrich, Seifahrt, Andreas, Uttenthaler, Stefan, Bik, Arjan, Casali, Mark, Hubrig, Swetlana, Jung, Yves, Kerber, Florian et al., 2007, The Messenger, 128, 17
- Storey & Hummer (1995) Storey, P.J., Hummer, D.G., 1995, MNRAS272, 41
- Waters et al. (1991) Waters, L.B.F.M, Marlborough, J.M., van der Veen, W.E.C., Taylor, A.R., Dougherty, S.M., 1991, A&A, 244, 120
- Watson & Hanson (1997) Watson, A.M., Hanson, M.M., 1997, ApJL, 490, L165
- Zhang (2007) Zhang, Q, 2007, These proceedings
- Zinnecker & Yorke (2007) Zinnecker, H, Yorke, H.W., 2007, ARA&A, 45, 481