A multifrequency study of giant radio sources
II. Spectral ageing analysis of the lobes
of selected sources
Abstract
Multifrequency observations with the Giant Metrewave Radio Telescope (GMRT) and the Very Large Array (VLA) are used to determine the spectral breaks in consecutive strips along the lobes of a sample of selected giant radio sources (GRSs) in order to estimate their spectral ages. The maximum spectral ages estimated for the detected radio emission in the lobes of our sources range from 6 to 36 Myr with a median value of 20 Myr using the classical equipartition fields. Using the magnetic field estimates from the Beck & Krause formalism the spectral ages range from 5 to 38 Myr with a median value of 22 Myr. These ages are significantly older than smaller sources. In all but one source (J1313+6937) the spectral age gradually increases with distance from the hotspot regions, confirming that acceleration of the particles mainly occurs in the hotspots. Most of the GRSs do not exhibit zero spectral ages in the hotspots, as is the case in earlier studies of smaller sources. This is likely to be largely due to contamination by more extended emission due to relatively modest resolutions. The injection spectral indices range from 0.55 to 0.88 with a median value of 0.6. We discuss these values in the light of theoretical expectations, and show that the injection spectral index appears to be correlated with luminosity and/or redshift as well as with linear size.
keywords:
galaxies: active – galaxies: jets – galaxies: nuclei – quasars: general – radio continuum: galaxies1 Introduction
The radio continuum spectra in different parts of an extended radio source contain important information about the various energy losses and gains of the radiating particles during the lifetime of the source. According to dynamical models for FRII-type (Fanaroff & Riley 1974) radio sources, the energy emitted by the nucleus squirts out in the form of narrow, collimated jets channeling their way through the external environment. These jets dissipate their energy at their leading edges giving rise to intense regions of emission called ‘hotspots’. As the jets advance outwards, the relativistic particles flow out from the hotspots to form the extended lobes of radio emission. Assuming that there is no significant reacceleration within these lobes and no significant mixing of particles, there should be a spectral gradient across the radio source, in the sense that the spectrum should steepen with increasing distance from the hotspot. This prediction has been seen in many sources and used to estimate the radiative ages and expansion velocities in several samples of powerful 3CR sources (e.g. Myers & Spangler 1985; Alexander & Leahy 1987; Leahy, Muxlow & Stephens 1989; Carilli et al. 1991; Liu, Pooley & Riley 1992), in samples of low-luminosity and medium-luminosity radio galaxies (e.g. Klein et al. 1995; Parma et al. 1999), as well as a sample of compact steep-spectrum sources (Murgia et al. 1999). However, the observed spectral break and steepening of the spectrum beyond this break need not be entirely due to radiative energy losses. A possible role of the local magnetic fields, details of the backflow of the lobe material, or the difficulties in disentangling various energy losses of the radiating particles have been pointed out in a number of papers (e.g. Wiita & Gopal-Krishna 1990; Rudnick, Katz-Stone & Anderson 1994; Eilek & Arendt 1996; Jones, Ryu & Engel 1999; Blundell & Rawlings 2000).

Nevertheless, giant-sized radio sources (hereinafter referred to as GRSs) are suitable for the classical spectral-ageing analysis due to their large angular extent which can be covered by a significant number of resolution elements. In Paper I (Konar et al. 2007) extensive low-frequency observations made with the GMRT of a sample of ten selected GRSs have been described and some of their properties analysed and discussed. In this paper we analyse the spectral ages of these radio galaxies except for J0720+2837 for which we have data at only two frequencies and J1343+3758 whose spectral ageing analysis has been presented by Jamrozy et al. (2005). Our analysis is similar to the spectral ageing analysis for the GRS J1343+3758 (Jamrozy et al. 2005) and the double-double radio galaxy J1453+3308 (Konar et al. 2006). In Section 2 we discuss briefly the method of analysis, while in Section 3 we present our results. Discussion of the results and an examination of the correlations of the injection spectral index, , with luminosity, redshift and linear size are presented in Section 4. The conclusions are summarized in Section 5.
2 Spectral ageing analysis
2.1 Spectral steepening and spectral age
The spectral age, i.e. the time which has elapsed since the particles were last accelerated in the hotspot region, can be derived from the steepening in the radio spectrum due to energy losses caused by synchrotron and inverse-Compton processes. The observed spectra have been fitted using the Jaffe & Perola (1973, JP) and the Kardashev-Pacholczyk (Kardashev 1962; Pacholczyk 1970; KP) models using the SYNAGE package (Murgia 1996). We found no significant difference between these two models over the frequency range of our observations and present only the results obtained from the JP model in this paper. Also, while fitting the theoretical spectra to the observed ones, we find the spectra of the different strips in the lobes are better fitted with the JP model than with the continuous injection (Kardashev 1962; CI) model, though sometimes the CI model fits better in the area of a prominent hotspot.
Thus, under assumptions that (i) the magnetic field strength in a given lobe is constant throughout the energy-loss process, (ii) the particles injected into the lobe have a constant power-law energy spectrum with an index , and (iii) the time-scale of isotropization of the pitch angles of the particles is short compared with their radiative lifetime, the spectral age, , is given by
| (1) |
where =0.318(1+)2 is the magnetic field strength equivalent to the cosmic microwave background radiation. Here , the magnetic field strength of the lobes, and are expressed in units of nT, is the spectral break frequency in GHz above which the radio spectrum steepens from the initial power-law spectrum given by =. It may be noted that Alexander & Leahy (1987) and Alexander (1987) have shown that the effects of expansion losses may be neglected.
2.2 Determination of and values
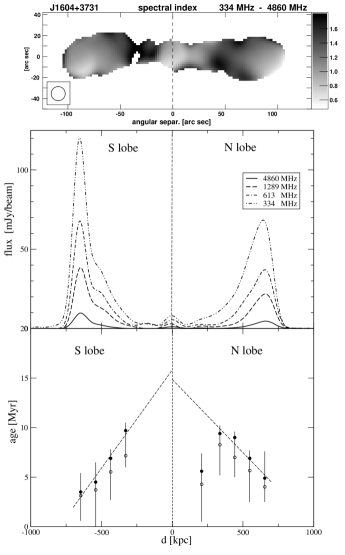
In order to determine a value of , we fit the JP model to the flux densities of the entire lobes (given in Paper I) treating as a free parameter. We find that the uncertainties of the values are sometimes large due to the low flux densities of the lobes. We have used the values of which give the best fits to the spectra of the lobes, and note that there is usually no evidence for significantly different values of this parameter for the oppositely directed lobes. For sources with reliable flux densities at lower frequencies than our observations but with no information on the flux densities of the individual lobes at these frequencies, we have determined from the integrated spectra of the sources. For these cases we have used the same value of for both the lobes. Having estimated the values, the total-intensity maps of the GRSs published in Paper I are convolved to a common angular resolution, which corresponds to the lowest resolution of our images. Each lobe is then split into a number of strips, separated approximately by the resolution element along the axis of the source in such a way that the extreme strips are centred at the peaks of brightness on the convolved maps. In each source a region around the radio core is excluded. As an example, the division of the source J1604+3731 into different strips is shown in Fig. 1. Using the SYNAGE software we determine the best fit to the spectrum in each strip over the entire observed frequency range using the JP model, and derive the relevant value of . The fitted spectra in the strips covering the SE-lobe and the NW-lobe of J1604+3731 are plotted in the lower panels of Fig. 1.
| Strip | Dist. | (rev) | |||
|---|---|---|---|---|---|
| (kpc) | (GHz) | (nT) | (Myr) | ||
| N-lobe | |||||
| P1 | 543 | 0.07 | 0.39.032 | ||
| P2 | 466 | 0.02 | 0.31.028 | ||
| P3 | 389 | 0.35 | 0.31.027 | ||
| P4 | 313 | 0.08 | 0.29.027 | ||
| P5 | 236 | 0.07 | 0.26.025 | ||
| P6 | 161 | 0.38 | 0.22.022 | ||
| S-lobe | |||||
| P7 | 498 | 9.93 | 0.28.031 | ||
| P8 | 575 | 0.00 | 0.31.034 | ||
| P9 | 652 | 2.05 | 0.34.037 | ||
| P10 | 729 | 1.06 | 0.40.042 | ||
| P11 | 806 | 2.52 | 0.41.042 | ||
| P12 | 883 | 6.92 | 0.45.046 |
2.3 Magnetic-field strength determination
In order to estimate the spectral ages in different parts of the lobes, we have to estimate the magnetic-field strength in the consecutive strips. Following Konar et al. (2006, 2007), the values of the equipartition energy density and the corresponding magnetic field, , are calculated using the revised formalism proposed by Beck & Krause (2005, hereinafter referred to as BK). This has been described in some detail in Paper I, and the values are denoted by (rev) in this paper. The revised field strength within each of the consecutive strips is calculated assuming a filling factor of unity. Since the BK formalism yields magnetic field strengths which are larger by a factor of 3 compared with the classical formalism (e.g. Miley 1980; hereinafter refererred to as classical-1, as in Paper I), we also estimate the spectral ages using the classical-1 magnetic field strengths. This shows the range of ages possible for different estimates of the magnetic field strength. Parameters derived using the latter field strenghts are denoted by ‘class’ in this paper. It is relevant to note that in most of the previously published papers on spectral ageing analysis of smaller FRII-type radio sources the spectral ages were determined using the classical minimum-energy formalism.
| Strip | Dist. | (rev) | |||
|---|---|---|---|---|---|
| (kpc) | (GHz) | (nT) | (Myr) | ||
| SE-lobe | |||||
| P1 | 1125 | 0.36 | 0.47.140 | ||
| P2 | 934 | 0.02 | 0.28.099 | ||
| P3 | 742 | 0.05 | 0.24.077 | ||
| P4 | 550 | 0.01 | 0.20.066 | ||
| P5 | 217 | 0.96 | 0.21.069 | ||
| NW-lobe | |||||
| P6 | 262 | 0.14 | 0.25.116 | ||
| P7 | 665 | 2.89 | 0.34.151 | ||
| P8 | 857 | 9.73 | 0.37.166 | ||
| P9 | 1049 | 4.19 | 0.40.175 |
| Strip | Dist. | Beq(rev) | |||
|---|---|---|---|---|---|
| (kpc) | (GHz) | (nT) | (Myr) | ||
| SW-lobe | |||||
| P1 | 925 | 0.17 | |||
| P2 | 812 | 0.25 | |||
| NE-lobe | |||||
| P3 | 226 | 0.06 | |||
| P4 | 346 | 1.17 | |||
| P5 | 459 | 1.26 |
3 The observational results
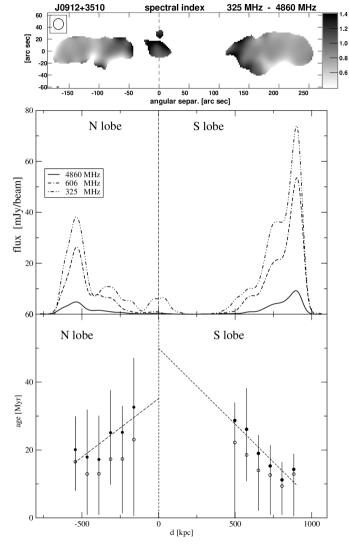
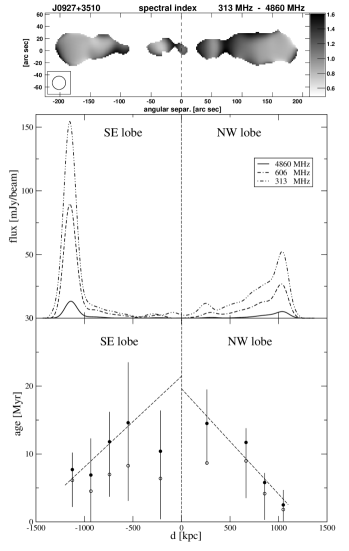
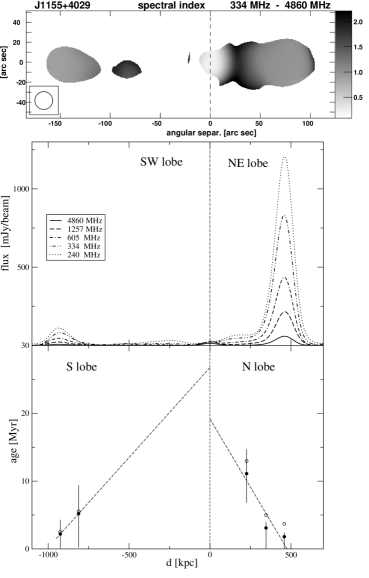
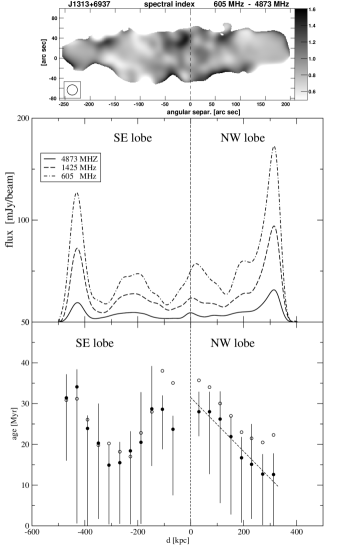
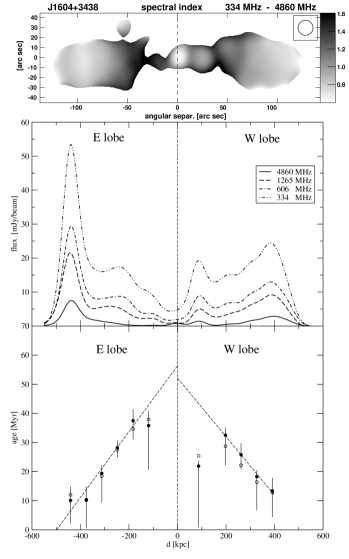
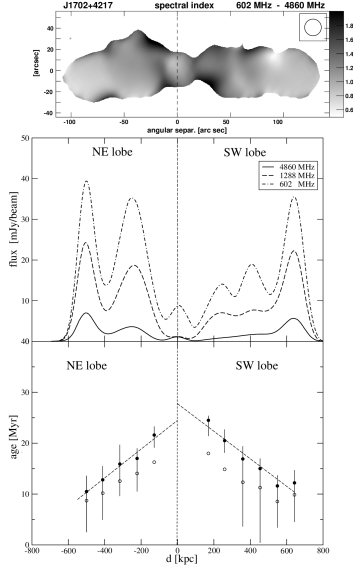
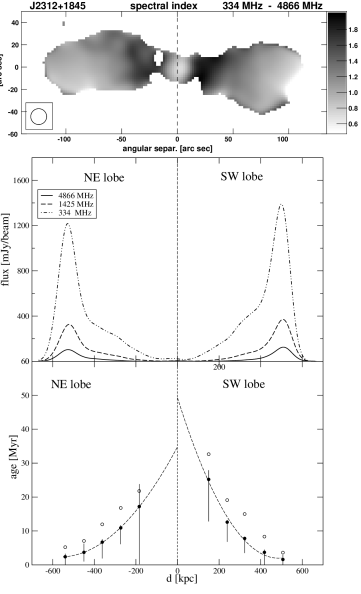
The results of our spectral ageing analysis for the eight GRSs selected from Paper I are presented in Figures 2 to 9 while some of the parameters are tabulated in Tables 1 to 8. In Figs. 2 to 9, (i) the spectral index map using the lowest frequency GMRT data and the VLA 4.86 GHz data, (ii) the intensity profiles of the lobes measured along the source axis at the different frequencies, and (iii) the resulting spectral age as a function of the distance from the radio core, are shown in the top, central and bottom panels respectively. Some of the numerical values are given in Tables 1 to 8 which are arranged as follows. Column 1: identification of the strip, column 2: projected distance of the centre of the strip from the radio core in units of kpc, column 3: break frequency of the spectrum of the strip according to the JP model in units of GHz, column 4: reduced value of the fit, column 5: revised magnetic-field strength in units of nT, and column 6: spectral age of particles in the strip. We have estimated the physical parameters using the cosmological model where Ho=71 km s-1 Mpc-1, =0.27, =0.73 (Spergel et al. 2003).
3.1 Notes on individual GRSs
J0912+3510: there is some uncertainty as to which galaxy is associated with the radio source (cf. Machalski et al. 2006, hereinafter referred to as MJZK).
| Strip | Dist. | Beq(rev) | |||
|---|---|---|---|---|---|
| (kpc) | (GHz) | (nT) | (Myr) | ||
| SE-lobe | |||||
| P1 | 470 | 0.73 | .015 | ||
| P2 | 430 | 1.82 | .014 | ||
| P3 | 390 | 11.1 | .015 | ||
| P4 | 349 | 0.07 | .015 | ||
| P5 | 309 | 4.38 | .015 | ||
| P6 | 268 | 3.29 | .016 | ||
| P7 | 228 | 3.87 | .015 | ||
| P8 | 188 | 0.42 | .014 | ||
| P9 | 147 | 0.16 | .013 | ||
| P10 | 107 | 6.34 | .015 | ||
| P11 | 67 | 4.25 | .017 | ||
| NW-lobe | |||||
| P14 | 31 | 0.38 | .017 | ||
| P15 | 71 | 1.22 | .016 | ||
| P16 | 111 | 0.27 | .015 | ||
| P17 | 152 | 1.03 | .016 | ||
| P18 | 192 | 0.99 | .017 | ||
| P19 | 230 | 0.001 | .018 | ||
| P20 | 272 | 1.55 | .019 | ||
| P21 | 313 | 0.96 | .020 |
J0927+3510: as mentioned in Paper I, the strips P5 and P6 in Table 2 overlap the region of emission which was suspected to be an inner double (cf. MJZK). However, the very steep spectra of about 1.17 and 1.35 in the strips P5 and P6 respectively suggest that this is likely to be old lobe emission. The resulting spectral ages are not significantly different from the expected trend of age with distance from the hotspot, with the age of P5 which is weaker and on the south-eastern side being only marginally lower. The somewhat higher separation speed of 0.7 and 0.4c for the eastern and western lobe material respectively (Fig. 3) suggests that the photometric-redshift estimate of 0.55 for this GRS (MJZK) may be overestimated.
| Strip | Dist. | Beq(rev) | |||
|---|---|---|---|---|---|
| (kpc) | (GHz) | (nT) | (Myr) | ||
| E-lobe | |||||
| P1 | 441 | 0.82 | .021 | ||
| P2 | 376 | 0.67 | .015 | ||
| P3 | 312 | 0.98 | .014 | ||
| P4 | 248 | 0.16 | .016 | ||
| P5 | 183 | 0.26 | .014 | ||
| P6 | 119 | 1.87 | .017 | ||
| W-lobe | |||||
| P7 | 87 | 1.39 | .020 | ||
| P8 | 198 | 0.93 | .013 | ||
| P9 | 262 | 0.71 | .012 | ||
| P10 | 327 | 1.14 | .013 | ||
| P11 | 391 | 0.39 | .014 |
| Strip | Dist. | Beq(rev) | |||
|---|---|---|---|---|---|
| (kpc) | (GHz) | (nT) | (Myr) | ||
| S-lobe | |||||
| P1 | 647 | 0.43 | .252 | ||
| P2 | 541 | 3.67 | .230 | ||
| P3 | 435 | 3.98 | .213 | ||
| P4 | 329 | 2.14 | .179 | ||
| N-lobe | |||||
| P5 | 208 | 2.79 | .141 | ||
| P6 | 337 | 5.37 | .167 | ||
| P7 | 442 | 2.70 | .197 | ||
| P8 | 548 | 1.34 | .230 | ||
| P9 | 654 | 0.90 | .234 |
J1155+4029: although we have tentatively identified it as a galaxy (MJZK; Paper I), an optical spectrum of the faint host would help resolve the nature of the optical galaxy.
| Strip | Dist. | Beq(rev) | |||
|---|---|---|---|---|---|
| (kpc) | (GHz) | (nT) | (Myr) | ||
| NE-lobe | |||||
| P1 | 500 | 1.77 | .028 | ||
| P2 | 411 | 0.02 | .025 | ||
| P3 | 317 | 0.29 | .026 | ||
| P4 | 222 | 1.97 | .028 | ||
| P5 | 128 | 2.09 | .024 | ||
| SW-lobe | |||||
| P6 | 170 | 1.65 | .022 | ||
| P7 | 259 | 0.89 | .024 | ||
| P8 | 359 | 0.61 | .024 | ||
| P9 | 454 | 1.71 | .024 | ||
| P10 | 549 | 4.34 | .024 | ||
| P11 | 643 | 2.13 | .027 |
| Strip | Dist. | Beq(rev) | |||
|---|---|---|---|---|---|
| (kpc) | (GHz) | (nT) | (Myr) | ||
| NE-lobe | |||||
| P1 | 540 | 1.56 | .089 | ||
| P2 | 450 | 0.01 | .078 | ||
| P3 | 362 | 1.26 | .074 | ||
| P4 | 273 | 1.45 | .067 | ||
| P5 | 184 | 12.0 | .055 | ||
| SW-lobe | |||||
| P6 | 150 | 16.6 | .055 | ||
| P7 | 239 | 11.0 | .065 | ||
| P8 | 323 | 3.03 | .080 | ||
| P9 | 418 | 1.41 | .091 | ||
| P10 | 507 | 0.10 | .092 |
J1313+6937, DA 340: the spectral-index map and the intensity profiles along the source axis suggest that the synchrotron radiation observed in separate strips of this GRS may be related to a mixture of emitting particles which were injected or accelerated at different time epochs. The SE lobe of this GRS is the only one, among the other lobes studied in this Paper, in which the synchrotron ages determined do not more or less gradually increase with distance from the hotspot area to the core. The spectral ageing analysis of the entire lobes of this galaxy was published by Schoenmakers et al. (2000) where the radio spectrum of each of the lobes were determined within the frequency range of 325 MHz–10.5 GHz. Though their values found fitting the JP model, i.e. 0.710.02 and 0.750.02 for the SE and NW lobes, respectively, differ from our values, their average synchrotron ages of these lobes of 281 Myr and 271 Myr are consistent with our results (cf. Table 4).
J1604+3438: the inner part of the structure comprising the flat-spectrum radio core and the two nearby peaks of emission seen most clearly in the image published by MJZK led them to classify the source as a possible double-double radio galaxy (DDRG). However as noted in Paper I spectral indices of these features are steep and one needs to image them with higher resolution in both total intensity and linear polarisation to investigate the DDRG nature of the source. It is relevent to note that the spectral age of the western feature lies significantly below the agedistance relationship for the western lobe.
J1604+3731: this is the highest-redshift radio galaxy in the sample. The relatively younger age seen in the strip closest to the core in the northern lobe is coincident with a knot or peak of emission (Konar et al. 2004; Paper I).
J1702+4217: although there are peaks of emission visible in the lobe emission, especially at the lower frequency, the spectral age increases smoothly with distance from the hotspots.
J2312+1845, 3C457: the only source in the sample showing undoubtedly a curvature in the agedistance plot. This could be due to deceleration of the radial expansion velocity of the lobe material. The data in Table 8 give an expansion velocity of about 0.110.05 in the vicinity of the leading heads which slows to about 0.030.015 in the regions where the oldest particles are detected. Such curvatures may also be produced by re-acceleration of particles in different regions of the lobes.
3.2 Separation speeds and spectral ages
The plots in the bottom panels of Figs. 2–9 show that, in general, the spectral age of the emitting particles increases systematically with distance from the leading heads of the lobes, i.e the hotspot regions. These plots have been shown using the magnetic field strengths estimated using the BK formalism (full circles) as well as the classical-1 (Miley 1980; see Paper I) minimum-energy one (open circles). These two field strengths differ by a factor of 3 (cf. Paper I). The numerical values we list here have been estimated using the BK formalism. For most of these lobes we calculate the linear regression of the ages () on the corresponding distances (), which is shown as a dashed line in Figs. 2–9. The slopes of these lines give a characteristic speed, , which is an indication of the average speed of the lobe material relative to the hotspots. A clear exception is J2312+1845 (3C457) for which the speed, , evidently decelerates with distance from hotspot regions. This source is much stronger than the remaining GRSs, therefore the errors of the spectral break frequency, , and the corresponding spectral age in each of the strips are much smaller than those in our remaining sources. In other cases the linear regression fit is the most conservative, though there is no physically justified reason for the material separation speed to be constant.
Our estimates of the average speed and a ‘characteristic’ spectral age for the lobes in the regions of the observed emission from the lobes as well as the values when extrapolated to the positions of the cores are presented in Table 9. These values have been presented for all the sources except for the SE-lobe of J1313+6937 which has a complex agedistance plot. In Table 9 the values have been presented for the estimates using the magnetic field values from both the BK and the classical-1 formalisms. The Table is arranged as follows. Column 1: source name; column 2: the optical identification; column 3: redshift; column 4: largest linear size in kpc; column 5: log of the luminosity in units of W Hz-1; column 6: lobe identification; column 7: spectral age using the BK formalism, denoted by ‘rev’, till the most distant strip from the hotspot; column 8: spectral age when the age-distance relationship is extrapolated to the region of core; columns 9 and 10: same as columns 7 and 8 but using the classical-1 estimates of the magnetic field, denoted by ‘class’; columns 11 and 12: estimates of the separation velocity for the BK and classical-1 approaches.
| Source | Opt. | red- | P1.4 | Lobe | age | ext-age | age | ext-age | |||
|---|---|---|---|---|---|---|---|---|---|---|---|
| Id. | shift | rev | rev | class | class | rev | class | ||||
| (kpc) | (W Hz-1) | (Myr) | (Myr) | (Myr) | (Myr) | ||||||
| (1) | (2) | (3) | (4) | (5) | (6) | (7) | (8) | (9) | (10) | (11) | (12) |
| J0912+3510 | G | 0.2489 | 1449 | 25.44 | N | 28.7 | 49.9 | 23.0 | 34.2 | 0.09 | 0.18 |
| S | 32.6 | 35.1 | 22.2 | 23.2 | 0.07 | 0.12 | |||||
| J0927+3510 | G | 0.55∗ | 2206 | 26.02 | SE | 14.6 | 21.4 | 8.3 | 10.4 | 0.24 | 0.70 |
| NW | 14.5 | 19.6 | 8.7 | 12.2 | 0.21 | 0.37 | |||||
| J1155+4029 | G | 0.53∗ | 1437 | 26.55 | SW | 5.2 | 26.8 | 5.6 | 27.5 | 0.12 | 0.12 |
| NE | 11.1 | 19.1 | 13.0 | 21.0 | 0.08 | 0.08 | |||||
| J1313+6937 | G | 0.106 | 745 | 25.60 | SE | 23.7 | – | 35.1 | – | – | – |
| NW | 28.0 | 31.5 | 35.7 | 36.4 | 0.05 | 0.06 | |||||
| J1343+37581 | G | 0.2267 | 2463 | 25.32 | NE | 33.5 | 60.8 | 26.5 | 53.4 | 0.13 | 0.10 |
| SW | 36.2 | 52.5 | 33.6 | 50.0 | 0.12 | 0.09 | |||||
| J1453+33082 | G | 0.249 | 1297 | 25.93 | S | 58.4 | 65.0 | 47.9 | 61.8 | 0.04 | 0.05 |
| N | 46.6 | 54.9 | 38.8 | 53.1 | 0.04 | 0.05 | |||||
| J1604+3438 | G | 0.2817 | 846 | 25.53 | E | 56.3 | 56.3 | 34.7 | 50.8 | 0.03 | 0.03 |
| W | 52.1 | 52.1 | 28.7 | 44.5 | 0.03 | 0.04 | |||||
| J1604+3731 | G | 0.814 | 1346 | 26.60 | S | 15.8 | 15.8 | 7.2 | 11.3 | 0.16 | 0.25 |
| N | 14.9 | 14.9 | 8.3 | 12.8 | 0.22 | 0.24 | |||||
| J1702+4217 | G | 0.476 | 1160 | 26.19 | NE | 24.5 | 24.5 | 16.3 | 18.8 | 0.12 | 0.16 |
| SW | 27.8 | 27.8 | 18.0 | 19.9 | 0.12 | 0.18 | |||||
| J2312+1845 | G | 0.427 | 1056 | 27.11 | NE | 34.8 | 34.8 | 21.9 | 36.5 | 0.083 | 0.073 |
| SW | 49.2 | 49.2 | 32.6 | 54.1 | 0.053 | 0.043 |
Notes: ∗ denotes an estimated redshift; (1) calculated from the data in Jamrozy et al. (2005); (2) calculated from the data in Konar et al. (2006); (3) speed estimated using the two extreme strips for each lobe.


4 Discussion
4.1 Spectral ages
The maximum spectral ages estimated for the detected radio emission in the lobes of our sources range from 6 to 36 Myr with a median value of 20 Myr using the classical equipartition fields. Using the magnetic field estimates from the BK formalism the spectral ages range from 5 to 38 Myr with a median value of 22 Myr. These ages are significantly older than smaller sources. The median linear size of these large sources is 1300 kpc. For comparison, we first consider the sample of smaller sources studied by Leahy et al. (1989) which has been observed over a large frequency range. They estimated the spectral ages of a sample of 16 3CR radio sources from low-frequency observations with the Multi-Element Radio Linked Interferometer Network (MERLIN) at 151 MHz and high-frequency observations at 1500 MHz with the VLA. We have re-estimated their values using the cosmological parameters used in this paper. The ages of the lobes of these sources range from 2.5 to 26 Myr with a median value of 8 Myr, significantly smaller than the value for the GRSs. The median value of the linear size for this sample of sources is 342 kpc.
Considering the sample of 14 high-luminosity double radio sources studied by Liu et al. (1992), we have again re-estimated the spectral ages using the cosmological parameters used in this paper, and find that the values range from 0.3 to 5.3 Myr with a median value of 1.7 Myr. These sources have even smaller spectral ages and their median linear size is 103 kpc. Considering these different samples, there is a trend for the spectral ages to increase with linear size (Fig. 10) as has been noted earlier in the literature (e.g. Parma et al. 1999; Murgia et al. 1999; Murgia 2003). It is also interesting to note that the relative speeds of the lobe material has been estimated to be in the range of 0.03 to 0.2c with a median value of 0.1c for the Liu et al. sample. In comparison, the corresponding speeds for our sample of GRSs is about 0.03 to 0.25 (excluding J0927+3510 for which the photometric redshift value may be overestimated, cf. Sect. 3.1), with a median value of 0.09c, similar to that of the the Liu et al. sample.
The above trend for spectral age to increase with size is broadly consistent with the expectations of dynamical models of the propagation of jets in an external medium (e.g. Falle 1991; Kaiser & Alexander 1997; Jeyakumar et al. 2005 and references therein) in which the linear size of the source is a function of its (dynamical) age. Nevertheless, while interpreting these numbers caveats related to the evolution of the local magnetic field in the lobes need to be borne in mind (e.g. Rudnick, Katz-Stone & Anderson 1994; Jones, Ryu & Engel 1999; Blundell & Rawlings 2000). Also, while Kaiser (2000) have suggested that spectral and dynamical ages are comparable if bulk backflow and both radiative and adiabatic losses are taken into account in a self-consistent manner, Blundell & Rawlings (2000) suggest that this may be so only in the young sources with ages much less than 10 Myr. In the study of the FRII type giant radio galaxy, J1343+3758, Jamrozy et al. (2005) find the dynamical age to be approximately 4 times the maximum synchrotron age of the emitting particles.
In the plots of spectral age against distance from the hotspots, we note that none of the sources show zero age at the hotspots. In fact the ages in the hotspots usually range from a few to 20 Myr, except in the case of the south-eastern lobe of J1313+6937 where the age in the outer extremity is 30 Myr. This tendency for the hotspots to exhibit a non-zero age has been noted earlier by a number of authors (e.g. Liu et al. 1992). In the Liu et al. sample, ages in the hotspots are typically less than 1 Myr while in the case of Cygnus A, Carilli et al. (1991) find the ages of the hotspots to be 0.1 and 0.2 Myr for the north-western and south-eastern lobes respectively. The typical linear resolution of the sources observed by Liu et al. is 10 kpc for most sources while that of Cygnus A is 5 kpc. In comparison, the linear resolution of our GRSs ranges from 30 to 110 kpc with a median value of 80 kpc. For comparison, the sizes of hotspots range from about a few parsec to 10 kpc increasing with source size till the largest linear size is 100 kpc and then flattens for larger source sizes (e.g. Jeyakumar & Saikia 2000). Possible explanations for the non-zero ages include (i) the possibility that the hotspots have been inactive for 105 to 106 yr, (ii) contamination by more extended emission and (iii) higher magnetic fields in the hotspots (cf. Liu et al.). The coarse resolution of our observations suggest that contamination by extended emission is the likely cause for the non-zero ages in the hotspots of our GRSs.
Another effect, visible in the bottom panels of Figs. 2–9 and related to the magnetic fields, is the age difference, , which is either positive or negative. This is a simple consequence of Eq. (1). Given and imply the maximum for =. Substitution of the ratio into Eq. 1 gives
The function has a maximum at =, thus the maximum of can be written as
The function as a function of is plotted in Fig. 11.
In our calculations the values of the magnetic field calculated with the revised formula, (rev), are always greater than the values of (class) calculated with the classical formula of Miley (1980) where, for a comparison with several previously published papers on spectral ages of other radio sources, we have assumed the proton to electron energy ratio to be unity. Therefore, if both values of (class) and (rev) are less than (or ; see Fig. 11), then the ages derived with the classical formula (open circles in Figs. 2–9) are lower than those derived with the revised formula (full circles in Figs. 2–9). On the contrary, if both values of the magnetic field are either close to, or greater than , the ‘classical’ ages are greater than the ‘revised’ ages.
4.2 Injection spectral indices
The injection spectral indices which have been estimated from fits to the spectra of the lobes or the entire source using our measurements as well as low-frequency flux density values at 151 MHz from the Cambridge surveys (Green 2002 and references therein) and the VLA Low-frequency Sky Survey (VLSS; Cohen et al. 2007; http://lwa.nrl.navy.mil/VLSS) estimates for the stronger sources. varies from 0.55 to 0.88 with a median value of 0.6 for our sources. For strong, non-relativistic shock in a Newtonian fluid = 0.5 (Bell 1978a,b; Blandford & Ostriker 1978). However, for relativistic shocks or shocks in which fields and relativistic particles alter the shock dynamics, values of are in the range of 0.35 to 0.65 (Heavens 1989; Kirk & Schneider 1987; Drury & Volk 1981; Axford, Leer & McKenzie 1982). Carilli et al. (1991) estimate to be 0.5 for Cygnus A while Meisenheimer et al. (1989) obtain similar values for a few powerful radio galaxies. For the sample of sources studied by Liu et al. (1992), the values of have been estimated from the low-frequency spectral indices using data between 38 MHz and 1 GHz. Their values of range from 0.65 to 1 with a median value of 0.77. The values of the spectral indices of the hotspots estimated from low-frequency measurements by Leahy et al. (1989), which is similar to , ranges from 0.64 to 1.16 with a median value of 0.8. Katz-Stone & Rudnick (1997) also estimate a steep injection spectral index of 0.8 for the compact steep spectrum source 3C190. It is important to determine the spectra of the lobes over a wide low-frequency range using the GMRT and upcoming instruments such as the Long Wavelength Array (LWA) and the Low Frequency Array (LOFAR) to get better estimates of the injection spectral indices, and also compare these with estimates from the inverse-Compton scattered x-ray spectrum (e.g. Harris 2005).


We have investigated any possible dependence of on source size using our estimates and those of Liu et al. (1992) and Leahy et al. (1989). We find to be strongly correlated with luminosity (Fig. 12, upper panel), consistent with the well-known spectral-index luminosity correlation for extragalactic radio sources (e.g. Laing & Peacock 1980, and references therein). However, lower frequency measurements than those we have used using instruments such as the GMRT, LOFAR and LWA would be extremely useful to better determine the values of . also appears to be strongly correlated with redshift (Fig. 12, lower panel), but since most of our sources come from a reasonably narrow range of flux density it is difficult to distinguish whether the fundamental correlation is with luminosity or redshift. It is worth noting that while exploring correlations of with either luminosity or redshift, K-correction factors due to cosmological redshifts should not play a significant role. A plausible scenario for such a correlation could be multiple shocks in the heads of the jets as suggested by Gopal-Krishna & Wiita (1990). We have also explored possible correlation of with source size and find that our estimates for the GRSs are smaller than the corresponding values for the smaller sources from the Liu et al. and Leahy et al. samples, which tend to have more prominent hotspots (Fig. 13, upper panel). The inverse correlation of luminosity and size for these samples (Fig. 13, lower panel) which define the approximate upper envelop of the luminosity-size diagram (e.g. Kaiser, Dennett-Thorpe & Alexander 1997; Blundell, Rawlings & Willott 1999; Ishwara-Chandra & Saikia 1999) are consistent with the above trends.
5 Concluding remarks
We summarise briefly the main results of our analysis.
(i) The maximum spectral ages estimated for the detected radio emission in the lobes of our sources range from 6 to 36 Myr with a median value of 20 Myr using the classical equipartition fields. Using the magnetic field estimates from the BK formalism the spectral ages range from 5 to 38 Myr with a median value of 22 Myr. These ages are significantly older than those of smaller sources (e.g. Leahy et al. 1989; Liu et al. 1992). The GRSs are older sources possibly evolving in underdense regions of the intergalactic medium (cf. Cotter 1998; Mack et al. 1998; Machalski, Chyży & Jamrozy 2004), although the external medium is often asymmetric on scales of 1 Mpc (e.g. Ishwara-Chandra & Saikia 1999; Konar et al. 2004, 2007).
The spectral ages depend on the estimated magnetic fields. Strengths of the equipartition field calculated with the revised formalism proposed by BK are greater than the corresponding values provided by the classical formula of Miley (1980) by a factor of 3 (Paper I). However, the inferred synchrotron age is a function of the ratio . If is greater than , the ‘revised’ age is lower than the ‘classical’ age.
(ii) The injection spectral indices range from 0.55 to 0.88 with a median value of 0.6. Our estimates for the GRSs are marginally smaller than those estimated for smaller sources by Leahy et al. (1989) and Liu et al. (1992). Reliable low-frequency measurements of the lobes using instruments such as GMRT, LWA and LOFAR are required to get more reliable estimates of the injection spectral indices. We have explored possible correlations of with other physical parameters and find that it appears to increase with luminosity and redshift, but shows an inverse correlation with linear size.
Acknowledgments
We thank our reviewer Ruth Daly, and Gopal-Krishna, Vasant Kulkarni and Paul Wiita for their comments on the manuscript. The Giant Metrewave Radio Telescope (GMRT) is a national facility operated by the National Centre for Radio Astrophysics (NCRA) of the Tata Institute of Fundamental Research. We acknowledge access to the SYNAGE software kindly provided by Dr K.-H. Mack and Dr M. Murgia (Istituto di Radioastronomia, Bologna, Italy). MJ is indebted to Professor D.J. Saikia and the staff members for hospitality during his stay at the NCRA. JM and MJ acknowledge the MNiSW funds for scientific research in years 2005–2008 under contract No. 0425/PO3/2005/29.
References
- [1987] Alexander P., 1987, MNRAS, 225, 27
- [1987] Alexander P., Leahy J.P., 1987, MNRAS, 225, 1
- [1982] Axford, W.I., Leer E., McKenzie J.F., 1982, A&A, 111, 317
- [1987] Beck R., Krause M., 2005, Astron. Nachr., 6, 414 (BK)
- [] Bell A.R., 1978a, MNRAS, 182, 147
- [] Bell A.R., 1978b, MNRAS, 182, 443
- [] Blandford R.D., Ostriker J.P., 1978, ApJ, 221, L29
- [1999] Blundell K.M., Rawlings S., 2000, AJ, 119, 1111
- [1999] Blundell K.M., Rawlings S., Willott C.J., 1999, AJ, 117, 677
- [1991] Carilli C.L., Perley R.A., Dreher J.W., Leahy J.P., 1991, ApJ, 383, 554
- [2007] Cohen A.S., Lane W.M., Cotton W.D., Kassim N.E., Lazio T.J.W., Perley R.A., Condon J.J., Erickson W.C., 2007, AJ, 134, 1245
- [1998] Cotter G., 1998, in Observational cosmology with the new radio surveys”, eds. M.N. Bremer, N. Jackson, I. Pérez-Fournon, Kluwer, p. 233
- [] Drury L. O’C., Völk J.H., 1981, ApJ, 248, 344
- [1996] Eilek J.A., Arendt, P.N., 1996, ApJ, 457, 150
- [1991] Falle S.A.E.G., 1991, MNRAS, 250, 581
- [1974] Fanaroff B.L., Riley J.M., 1974, MNRAS, 167, 31P
- [] Gopal-Krishna, Wiita P.J., 1990, A&A, 236, 305
- [2002] Green D.A., 2002, in The Universe at Low Radio Frequencies, IAU Symp 199, Eds A. Pramesh Rao, G. Swarup, Gopal-Krishna, Astronomical Society of the Pacific, California, p. 21
- [2005] Harris D.E., 2005, in From Clark Lake to Long Wavelength Array: Bill Erickson’s Radio Science, edss. N.E. Kassim, M.R. Pŕez, W. Junor, P.A. Henning, ASP Conf. Ser, 345, p. 254
- [] Heavens A., 1989, in Radio Hotspots in Extragalactic Radio Sources, eds. K. Meisenheimer, H.-J. Röser, Sringer-Verlag, Heidelberg, p. 247
- [] Ishwara-Chandra C.H., Saikia D.J., 1999, MNRAS, 309, 100
- [1973] Jaffe W.J., Perola G.C., 1973, A&A, 26, 423
- [2005] Jamrozy M., Machalski J., Mack K-.H., Klein U., 2005, A&A, 433, 467
- [] Jeyakumar S., Saikia D.J., 2000, MNRAS, 311, 397
- [] Jeyakumar S., Wiita P.J., Saikia D.J., Hooda J.S., 2005, A&A, 432, 823
- [1999] Jones T.W., Ryu D., Engel A., 1999, ApJ, 512, 105
- [2000] Kaiser C.R., 2000, A&A, 362, 447
- [1997] Kaiser C.R., Alexander P., 1997, MNRAS, 286, 215
- [] Kaiser C.R., Dennett-Thorpe J., Alexander P., 1997, MNRAS, 292, 723
- [] Kardashev N.S., 1962, SvA, 6, 317
- [] Katz-Stone D.M., Rudnick L., 1997, ApJ, 479, 258
- [] Kirk J.G., Schneider P., 1987, ApJ, 315, 425
- [1995] Klein U., Mack K.-H., Gregorini L., Parma P., 1995, A&A, 303, 427
- [] Konar C., Saikia D.J., Ishwara-Chandra C.H., Kulkarni V.K., 2004, MNRAS, 355, 845
- [2005] Konar C., Saikia D.J., Jamrozy M., Machalski J., 2006, MNRAS, 372, 693
- [2005] Konar C., Jamrozy M., Saikia D.J., Machalski J., 2007, MNRAS, in press (Paper I)
- [1980] Laing R.A., Peacock J.A., 1980, MNRAS, 190, 903
- [1989] Leahy J.P., Muxlow T.W.B., Stephens P.W., 1989, MNRAS, 239, 401
- [1992] Liu R., Pooley G., Riley J.M., 1992, MNRAS, 257, 545
- [2004] Machalski J., Chyży K.T., Jamrozy M., 2004, AcA, 54, 249
- [2006] Machalski J., Jamrozy M., Zola S., Koziel D., 2006, A&A, 454, 85 (MJZK)
- [1998] Mack K.-H., Klein U., O’Dea C.P., Willis A.G., Saripalli L., 1998, A&A, 329, 431
- [] Meisenheimer K., Röser H.-J., Hiltner P., Yates M., Longair M., Chini R., Perley R., 1989, A&A, 219, 63
- [1080] Miley G.K., 1980, ARA&A, 18, 185
- [1996] Murgia M., 1996, Laurea Thesis, University of Bologna
- [1996] Murgia M., 2003, PASA, 20, 19
- [1996] Murgia M., Fanti C., Fanti R., Gregorini L., Klein U., Mack K.-H., Vigotti M., 1999, A&A, 345, 769
- [1985] Myers S.T., Spangler S.R., 1985, ApJ, 291, 52
- [1970] Pacholczyk A.G., 1970, Radio Astrophysics, W.H. Freeman & Co., San Francisco
- [1999] Parma P., Murgia M., Morganti R., Capetti A., de Ruiter H.R., Fanti R., 1999, A&A, 344, 7
- [1994] Rudnick L., Katz-Stone D., Anderson M., 1994, ApJS, 90, 955
- [2000] Schoenmakers A.P., Mack K.-H., de Bruyn A.G., Röttgering H.J.A., Klein U., van der Laan H., 2000, A&AS, 146, 293
- [] Spergel D.N. et al., 2003, ApJS, 148, 175
- [] Wiita P.J., Gopal-Krishna 1990, ApJ, 353, 476