Massive Star Formation
1 Introduction
The formation and evolution of massive (M⊙) stars plays a key role in the final fate of their parental molecular clouds, and in the appearance and evolution of their host galaxies. They inject large amounts of mechanical and radiative energy creating, either by a single star or a stellar cluster, the most spectacular gaseous nebulae in the Cosmos. Also, they generate fast shocks which heat up the surrounding plasma to temperatures above 106 K, and carve large interstellar ”holes” that continuously stir the general interstellar medium.
From the moment they are born their powerful outflows begin to plough into the surrounding molecular material. Similarly, the output of Lyman continuum radiation, that sets them apart from lower mass stars, ionize the cloud and form a dense and hot H II region. The expansion of this photoionized nebula drives a shock wave that both compress and may trigger further star formation on the one hand, and disperse a large portion of the molecular cloud on the other. As the new OB star enters the field population its winds and ultra-violet radiation continue to influence the general interstellar medium. These effects strengthen after their short main sequence lifetime, through the supergiant and Wolf-Rayet phases, and culminates in the most energetic of stellar events, the supernova explosion. Thus, the energy input from massive stars, via the combined effects of expanding H II regions and supernova remnants, can shape the interstellar medium of gaseous galaxies, creating large, expanding structures that may even vent mass and energy into the halo. It is this litany of energetic phenomena that gives massive stars such a pivotal role in astrophysics. Hence, it is not surprising to find that the dynamics of these phenomena have figured strongly in John’s work over the years.
2 Accretion
Larson & Starrfield (1971) and John’s mentor, Kahn (1974), first investigated one of the intriguing questions in massive star formation - how can accretion continue in the face of extreme radiation pressure. This results from another key difference between low and high mass star formation. The timescale for contraction in to a main sequence configuration is shorter than the formation timescale for massive stars. Hence, they are probably still accreting at the surface when hydrogen burning begins in the core. As the mass increases the luminosity from fusion and accretion exerts a high radiation pressure on the dust grains in the infalling cloud. In a spherically symmetric treatment Kahn (1974) deduced that this effect would limit the mass of a star that could be formed by accretion to about 40 M. The adoption of more appropriate dust parameters removes this strict limitation, but does require very high infall rates for the ram pressure to overcome the radiation pressure. Wolfire & Cassinelli (1987) updated this with a full radiative transfer solution and concluded that normal interstellar dust opacities would not allow inflow to occur. Even with depleted dust models they found that high accretion rates (10-3M⊙ yr-1) would be necessary to form the most massive stars.
Such accretion rates were thought to be unreasonably high compared to the 10-5M⊙ yr-1 expected from the collapse of a cloud initially close to equilibrium and held up by thermal pressure alone (); as is thought to be the case for low-mass star formation. However, several reasons have been put forward to argue for higher and time variable accretion rates, which can also overcome the radiation pressure problem. In any case, one might intuitively expect more massive objects to accrete faster.
One approach taken by Norberg & Maeder (2000) and Behrend & Maeder (2001) was to increase the accretion rate as the mass of the star grows. There is a region of the mass-luminosity plane where spherical accretion rates can grow and keep above that needed to overcome radiation pressure on dust in the cocoon, but below the Eddington limit due to radiation pressure on electrons in the stellar atmosphere. They attempted to put this on a physical basis by using the observed relation between outflow rates and bolometric luminosity (e.g. Churchwell 1998) and then making the accretion rate a fraction of the outflow rate. This invokes the often found result from outflow models that the outflow rate is a fixed fraction of the accretion rate. Their prescription gave very high accretion rates (10-2M⊙ yr-1) at the upper end of the mass range. However, the observed outflow rate versus luminosity relation is likely to be severely affected by selection effects for massive objects. Firstly, the objects observed are likely to be at a wide range of evolutionary stages. More importantly, Ridge & Moore (2001) showed that when a constant distance sample is studied there is much less of a correlation between outflow rate and luminosity and that previous studies were affected by Malmquist bias.
Another approach has been to use the fact that the cores that form massive stars are not supported by thermal pressure, but by a combination of turbulence and MHD waves (see the book edited by Franco & Carramiñana 1999). Bernasconi & Maeder (1996) used the empirically derived Larson (1981) relations, which show the non-thermal linewidth increasing with increasing size of cloud. This is thought to be a natural consequence of turbulent or magnetic support. In the simple picture in which , this gives a physical basis for the accretion rate increasing with time as the inside-out collapse proceeds. In this way Bernasconi & Maeder (1996) found accretion rates up to 10-4 M⊙ yr-1 for the most massive stars.
McKee & Tan (2003) have developed a turbulent core model, which results in accretion rates about an order of magnitude higher than this ( M⊙ yr-1 for the most massive stars). This they justify from the observed high pressures of massive star forming cores that require higher linewidths than given by the usual Larson relations. They still appeal to the form of the Larson relations to get accretion rates increasing with time, although there is little direct evidence that they apply to massive star forming clumps at present. Indeed, the Plume et al. (1997) study upon which McKee & Tan draw, states that they found no correlation between linewidth and size. Most of these cores also already have plenty of star formation activity in them, which will inevitably affect the observed linewidths.
The spherical accretion rates in the turbulent core model are sufficient to overcome radiation pressure. The time variable rates also make the star formation timescale rather independent of the mass which helps to produce apparently coeval clusters containing a range of masses. Their fiducial model also has a radial density distribution on large scales that is close to r-1.5, similar to that seen in several studies of massive star forming regions (e.g. Hatchell & van der Tak 2003). This type of gradient has usually been interpreted as being consistent with infall in a rapid star formation scenario in which the whole region is collapsing. In the McKee & Tan model it is seen as a longer lived quasi-equilibrium structure supported by turbulence.
It has been fairly clear ever since the first examples of massive young stars were found that they form from accretion via a disc rather than spherical infall. That is because the main manifestation of luminous embedded sources are their ubiquitous bipolar outflows (Lada 1985). Since these most naturally arise from discs in most viable models this has always been good indirect evidence. Accretion through a disc is also the key to overcoming the radiation pressure in a number of ways. Firstly, the stellar radiation is isotropic and so a disc only intercepts a small fraction of the total luminosity. Secondly, if the infall is concentrated through a thin disc then the effective accretion rate is amplified. Finally, there is likely to be a large self-shielding effect, whereby material can accrete through the mid-plane, whilst the upper layers of the disc take the brunt of the radiative effects.
This was investigated by Nakano (1989) and Jijina & Adams (1996) who showed analytically that non-spherical accretion caused by magnetised collapse or rotation can overcome the radiation pressure for a range of reasonable starting conditions and accretion rates. Yorke & Sonnhalter (2002) performed 2D axisymmetric radiation hydrodynamical simulations on a collapsing cloud in rotation and came to similar conclusions concerning the upper mass limit. They find accretion rates of about 10-3 M⊙ yr-1 starting from a very overdense, non-turbulent core. Their treatment of radiative transfer also showed that a substantial amount of radiation escapes along the polar axis of the structure where it does drive away some material, but it is along the equatorial axis that the accretion occurs. Numerical simulations have now moved on to three dimensions with the work of Krumholz et al. (2005a). The application of adaptive mesh refinement (AMR) hydrodynamical codes (see chapter by Falle) to this problem is finally demonstrating conclusively that radiation pressure is not a barrier to massive star formation. As material rains down on the accretion disc, radiation bubbles repeatedly blow out perpendicular to the disc plane and then collapse down again, but overall the accretion continues. They also find accretion rates of order 10-3 M⊙ yr-1 and it would appear that a consensus may be emerging over these kind of rates.
The effects of magnetic fields are the next major ingredient that need to be added to these simulations as computer power increases. It is possible that magnetic flows set in very early on in the accretion process as in the simulations of Tomisaka (2002) for the collapse of magnetised, rotating cores. It is unlikely that the MHD outflow mechanisms developed mostly for low-mass protostars can be simply scaled up to high mass accretors. Again the high output of UV radiation will increase the ionization fraction and hence, the coupling of magnetic field with the material. The onset of a radiative envelope (e.g. Palla & Stahler 1992) in the star as it adopts a more main sequence structure removes the usual method for the generation of strong stellar surface magnetic fields. This may take away the driving force in the widely used X-wind model for protostellar outflows. Outflow mechanisms driven by magnetic fields generated or dragged in by the disc could still operate if a strong stellar field is absent (Banerjee & Pudritz 2006). Krumholz et al. (2005b) have made an initial investigation of how outflows affect accretion onto massive stars As expected, the punching of holes along the axis by these flows allows the radiation pressure to be relieved in the centre, and accretion to continue to higher masses still.
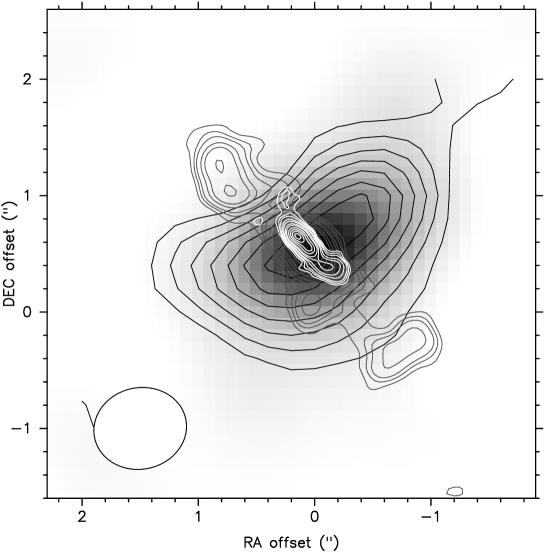
The direct observational evidence of accretion discs around massive young stars is now beginning to arrive. Millimetre interferometry had delivered convincing observations of compact flattened structures around the more luminous intermediate mass young stellar objects such as GL490 (Mundy & Adelman 1988) and G192.16-3.82 (Shepherd & Kurtz 1999). Now sub-millimetre interferometry has heralded the best example of a disc around a genuinely luminous object. Patel et al. (2005) have used the SMA to resolve an elongated dust and molecular structure 1000 AU in size that is perpendicular to the radio jet in Cep A2 (Fig 1). The molecular line has a rotational kinematic signature which helps to confirm the disc interpretation. This is a taster of what ALMA will do for massive star formation studies.
We consider the alternative coalescence model by Bonnell et al. (1998) to be unnecessary, unrealistic and unsupported. Unnecessary since there was never really a fundamental problem with the accretion picture as described above. The stellar densities required for it to work are many orders of magnitude below those seen or inferred; and it seems inconceivable that energetic events such as stellar collisions are common without any observational sign of them.
3 Outflows
As mentioned above, bipolar molecular outflows have long indicated that accretion discs are present at the heart of massive star formation. It has been thought that outflows from massive YSOs are not as well collimated as those from their low-mass counterparts. Much of this impression may have arisen from low spatial resolution single-dish molecular line observations of high-mass systems that are on average at least ten times further away (Beuther et al. 2002a). The strong clustering in massive star forming regions can also cause multiple outflows to merge at low resolution. Again, the application of interferometric observations has revealed that some regions are made up of multiple, well-collimated outflows (Beuther et al. 2002b), although these are not particularly high luminosity systems.
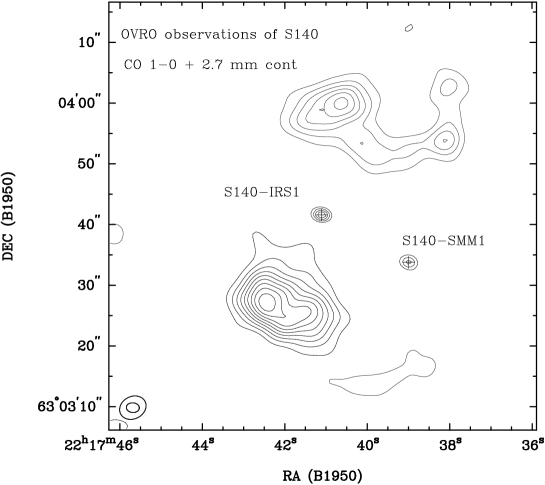
However, other systems still appear to show little evidence for high degrees of collimation when observed at high resolution. Fig 2 shows OVRO observations of the outflow from S140 IRS 1. The blueshifted lobe does display an approximate bow shape, but is not that highly collimated, whilst the redshifted lobe is severely affected by self absorption. If these type of outflows are driven by jets then we should see the shock-excited emission lines characteristic of low-mass objects. However, ground-based searches for molecular hydrogen emission at 2m have often turned up very little to support this picture (Davis et al. 1998), although see Davis et al. (2004). Optical searches for shocked emission in the outer reaches of molecular clouds where the flows terminate and extinction is expected to be less have also not detected anything significant (Alvarez & Hoare 2005). Images from the SPITZER satellite in the 4.5m filter are turning up numerous examples of outflow lobe emission, most likely from rotational lines of molecular hydrogen (Noriega-Crespo et al. 2004). This band occurs close to where there is a minimum in the extinction curve (Indebetouw et al. 2005) and should be a useful probe of massive outflows.
As well as molecular outflows, the massive YSOs also have compact, ionized winds. These manifest themselves through thermal radio spectrum with a spectral index close to +0.6 expected for a constant velocity wind (Wright & Barlow 1975). They also give rise to broad, single-peaked H I emission lines in the IR (Bunn et al. 1995). These typically have FWHM of about 100 km s-1 and FWZI up to several hundred km s-1 which is a lower limit on the wind’s terminal velocity. NLTE modelling shows that there is a common origin for the radio continuum and IR line emission (e.g. Höflich & Wehrse 1987). The typical mass-loss rates estimated for these ionized winds are of order 10-6M⊙ yr-1.
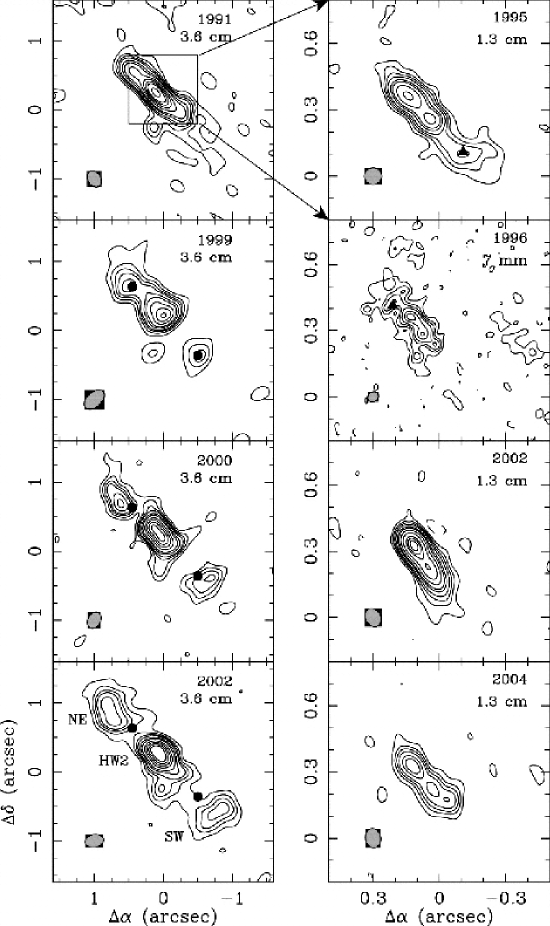
Clues to what is driving the ionized winds comes from resolving their spatial structure. Here the picture is also mixed as it is for the molecular outflows (see review by Hoare 2002). In some cases radio jets are seen as in their low-mass counterparts. By far the most spectacular example is the 2.6 pc long wiggling jet seen in the GGD27 system (Martí et al. 1993). This powers radio and optical Herbig-Haro objects at its termination and looks just like a scaled up low-mass system. Proper motion studies reveal velocities of 500 km s-1 (Martí et al. 1998). Other examples are G35.2N (Gibb et al. 2003) and IRAS (Rodríguez et al. 2005) and possibly W3 IRS 5d2 (Wilson et al 2003), which are mostly much more knotty and have a more exaggerated point symmetry. In other cases we just resolve the base of the jet; the best example being Cep A2 as in Fig 1, and GL 2591 also falls in this category (Trinidad et al. 2003). The fast motion in the Cep A2 jet has recently been confirmed by proper motion studies (Curiel et al. 2006) (Figure 3). One expects that such highly collimated flows are driven by MHD mechanisms in the star-disc system as for low-mass outflows.
However, jets are not the only radio morphology seen in massive YSOs. The exciting source of the peculiar bipolar H II region S106, which otherwise shows all the characteristics of a massive YSO (Drew et al. 1993), has radio emission elongated perpendicular to the outflow axis (Hoare et al. 1994; Hoare & Muxlow 1996; Hoare 2002). S140 IRS 1 also has such an equatorial wind of about 500 AU in size (Hoare & Muxlow 1996; Hoare 2002). Originally interpreted as a jet (Schwartz 1989; Tofani et al. 1995) it is clearly perpendicular to the large scale bipolar molecular outflow and to the monopolar IR reflection nebula at the base of the blueshifted outflow cavity revealed in speckle observations (Schertl et al. 2000; Alvarez et al. 2004). Proper motions confirm that this structure is not moving outwards as would be expected for a jet (Hoare 2002). Another possible example of an equatorial wind is in GL490 (Campbell et al. 1986), although the extension in the radio emission along the disc plane (Mundy & Adelman 1988) is somewhat noisy.
To drive such equatorial winds it has been proposed by Drew et al. (1998) that the radiation pressure due to central star and inner disc act on the ionized gas at the surface of the disc. The gas is pushed sideways, across the surface of the disc forming an equatorial wind. This is the same mechanism that drives the stellar winds in field main sequence stars where the terminal velocity is a few thousand km s-1, i.e. of order the escape speed at the stellar surface (Prinja et al. 1990). In the massive YSO case, the surface gravity in the disc atmosphere a few stellar radii out from the star is lower and so the typical speed of the equatorial wind is a few hundred km s-1. Hence, this mechanism has the potential to explain both the morphology, speed and mass-loss rate of the observed equatorial wind systems. Initial attempts to simulate the line profiles arising from such winds have too high a rotational component and result in double-peaked line profiles whereas only single-peaks are usually seen (Sim et al. 2005).
Note that this radiatively pressure driven flow is very different from the photo-evaporation mechanism discussed by Franco et al. (1989) and Hollenbach et al. (1994). That drives a much slower, thermal flow from the outer regions of the disc and they did not consider the effect of radiation pressure on the inner disc. Both mechanisms could operate simultaneously, but if the accretion disc does extend down close to the star there is little doubt that the radiation pressure acting on the gas will drive such a wind and is likely to dominate the dynamics.
4 The Transition to UCHII Region
It has long been a puzzle as to why the massive YSOs do not ionize their surrounding molecular gas as soon as they become luminous enough. All objects above about 104L⊙ should emit copious amounts of Lyman continuum radiation if they are fully on the zero age main sequence (ZAMS). It is commonly accepted that massive stars begin core hydrogen burning whilst still accreting and so the ZAMS assumption appears justified.
One possibility is that the infall of molecular material ’quenches’ the H II region (Walmsley 1995). The critical accretion rate for this to occur is obtained from inserting an infalling spherically symmetric density distribution into the Strömgren radius equation. The rates are high, but not as high as the 10-3M⊙ yr-1 needed to overcome radiation pressure on the dust in the same spherical treatment. In this scenario, the H II region is not absent, but just very dense ( cm-3 with a Strömgren radius close to the star. One problem with this approach is that the infall would have to be approximately spherically symmetric in order to stop the H II region breaking out in low density directions. In any accretion scenario, most of the infalling material will arrive on the disc rather than the star and a bipolar H II region would ensue with ionized lobes above and below the disc (Franco et al. 1989). It also neglects the effect of winds and outflows which are likely to push the inner radius of the infalling envelope some distance away from the star, again mostly likely in the polar directions.
Another picture was developed by Tan and McKee (2003) in which strong outflow rather than infall confines the H II region. They used an approximate X-wind outflow density distribution where the H II region propagates along the cavity along the axis. These models are basically X-wind jets with extra photo-ionisation. They predict ionized zones that are very narrow (few AU), whereas most high-mass radio jets are resolved across the minor axis ( 50 AU) (Martí et al. 1999; Curiel et al. 2006). Jets from high-mass objects are also likely to be significantly ionized as they are launched. Low-mass jets are partially ionized, and is difficult to predict at this moment how the ionization fraction of MHD driven jets would change for higher mass stars. If they are significantly ionized then their ability to confine the H II regions would be dramatically reduced.
Again a difficulty is that as soon as the central star becomes at all luminous it will start to drive strong stellar winds due to radiation pressure. These will open up cavities further exposing more material to the ionizing radiation. The equatorial winds discussed above would also not be able to confine the H II region since they do not cover the polar regions. Indeed, in the models by Drew et al. (1998) the polar regions are occupied by a normal O star stellar wind flowing at a few thousand km s-1.
One possible solution is to tackle the problem at source by examining whether the star really is emitting large amounts of Lyman continuum radiation during the massive YSO phase. Although the core is very likely to be already on the main sequence it is unclear that the outer layers of the star have contracted fully into a main sequence configuration. It is well known that accreting stars swell up well beyond their ZAMS radius, mainly due to shell deuterium burning (Palla & Stahler 1992). What is more, the higher the accretion rate the more the radius increases and extends to higher masses before the rapid contraction onto the main sequence occurs. The calculations by Palla & Stahler only consider accretion rates up to 10-4 M⊙ yr-1 and masses up to 15 M⊙ (see Figure 4), but the current thinking points towards accretion rates as high as 10-3 M⊙ yr-1. Inspection of Figure 4 shows that we would then expect a much greater swelling, up to around 30 R⊙, before the contraction to the main sequence at around 30 M ⊙ (L L⊙) for these rates of accretion (Palla, private communication).
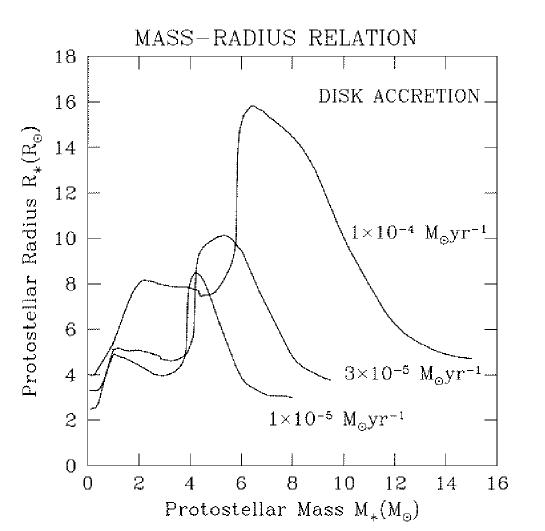
The key point here is that a larger radius means lower effective temperatures. If ongoing accretion keeps the effective temperature below about 30 000 K then there is no need to invoke any mechanism to quench the H II region since there will not be a significant Lyman continuum output from the star in any case. Future accretion models need to be calculated with a fully self-consistent treatment of the stellar mass-radius relation to investigate this aspect. The McKee & Tan (2003) models, in which the stars accrete at rates significantly above 10-4 M⊙ yr-1, implement an approximate treatment of the the Palla & Stahler (1992) results and their stars join the main sequence at masses of around 20 M⊙ as expected. However, their radii never get above the 15 R⊙ for Palla & Stahler’s 10-4 M⊙ yr-1 case suggesting that these have been under-estimated for the highest accretion rates. The Behrend & Maeder (2001) mass-radius relation shows a similar pattern of swelling towards larger radii, but again not as much as one would expect based on Figure 4, since their accretion rates exceed 10-3 M⊙ yr-1 through the relevant mass range.
Nakano et al. (2000) used a polytropic model to estimate that a young star accreting at 10-2 M⊙ yr-1 would have a maximum radius of about 30 R⊙. In a different context Kippenhahn & Meyer-Hofmeister (1977) calculated the affect on the radii of stars already fully on the main sequence of accretion at rates exactly in the 10-4 M⊙ yr-1 to 10-2 M⊙ yr-1 range of interest here. They found that the stars can expand greatly, e.g. about 100 R⊙, occupying the supergiant part of the Hertzsprung-Russell diagram before returning to the main sequence at higher mass. This was not because of deuterium burning, but simply because the accretion timescale () is shorter than the thermal adjustment or Kelvin-Helmholz timescale. The expanded phase lasts for the accretion timescale if the accretion rate is constant, which is 104 years for a 10 M⊙ star accreting at 10-3 M⊙ yr-1. If the accretion rate is increasing with time this phase would be longer still.
Overall, if the accretion rates during the hot core/massive YSO phases are as high as 10-3 M⊙ yr-1, then it is plausible that the reason for the lack of an H II region is simply that ongoing accretion keeps the effective temperature of the star too low. This scenario would also explain several other features of massive YSOs. If the ongoing accretion keeps the stellar radius high then it also lowers the surface gravity. It has been noted several times in the literature how the spectroscopic characteristics of massive YSOs resemble those of evolved OB stars (Simon & Cassar 1984). Most of the massive YSOs amenable to near-IR spectroscopy have luminosities around a few 104 L⊙ and thus are about 12 M⊙, just where accretion could easily result in a low surface gravity. The emission line spectrum with broad profiles of a few hundred km s-1 are reminiscent of B supergiants. The low surface gravity leads directly to low escape speeds and increased mass-loss.
Another feature of large central stars would be to help explain the near- IR line profiles in equatorial wind sources like S106IR. The current attempts to model the H I lines result in double-peaked rather than single-peaked lines (Sim et al. 2005). If the central star is larger than the ZAMS one assumed, then the rotation of the inner disc is much slower, reducing the rotational splitting of the disc wind. The slower, denser stellar wind from the poles may also help fill in the profile to improve agreement with observations. Such a wind could also help trap the Lyman continuum radiation before it can ionize the surroundings.
Whichever of the above mechanisms prevents the formation of an H II region during the massive YSO phase; quenching by infall, outflows or accretion swelling the star, all are associated with ongoing accretion. This would tend to indicate that the onset of the H II region phase is not to do with the star evolving to a stage where it is hot enough to ionize hydrogen, but more to do with the cessation of accretion. If accretion swelling the star is the cause, then the end of the high accretion rate phase will then allow the star to contract down onto the ZAMS. In so doing, the Lyman continuum output will increase and the H II region phase begin.
When ionization of the surrounding material does begin the ionization front will move faster in the low density directions. These are most likely to be the polar lobes due to the flattening effect of the centrifugal barrier during the infall phase and bipolar outflows during the YSO phase. In this scenario, one would expect the youngest, most compact H II regions to be bipolar. Within the class of so-called hyper-compact H II regions (HCHII, see Kurtz 2005) there are examples of bipolar objects. These also tend to display broad recombination lines (40 km s-1), which has been used as another criterion to set some of the hyper-compact objects apart as a new class (Jaffe & Martin-Pintado 1999; Sewilo et al 2004).
Figure 5 shows a plot of radio luminosity versus linewidth for UCHII regions, HCHII regions, young stellar wind sources, and jets (see Hoare et al. 2006 source of these data). Unlike in Hoare et al. (2006), here we have plotted the half-width-zero-intensity (HWZI) for the recombination lines rather than FWHM. For the UCHII and hyper-compact H II regions this does not make a great deal of difference, but some stellar wind sources appear to have a narrow optically thin component which dominates the FWHM whilst a broader optically thick component dominates the HWZI. In these cases the HWZI gives a better indication of the kind of speeds the wind is attaining. However, it is a more difficult parameter to work with since where the line returns to the continuum is dependent on the signal-to- noise of the spectrum. We have also added the two massive YSO jet sources that have measured proper motions to this plot: GGD 27 and Cep A2. These have been corrected for the inclination where known and thus measures the full speed of the gas. It is unfortunate at present that the jet sources are not amenable to IR spectroscopy to probe their line profiles as they are deeply embedded and not directly visible.
In Figure 5, NGC 7538 IRS 1 appears to stand out relative to the UCHII regions and stellar wind/jet sources. There is even a question mark over this source since the Sewilo et al. (2004) measurement plotted is for a low frequency line that may be affected by pressure broadening and NLTE effects, whilst the mm-wave recombination lines show HWZIs nearer 80 km s-1 (Jaffe & Martin-Pintado 1999). Other designated hyper-compacts appear to form more of a continuum with the UCHII regions in this plot and in the size-linewidth relation (Hoare et al. 2006). There is no real break around 40-60 km s-1. NGC 7538 IRS 1 is distinctive in that the bipolar lobes have velocity widths in excess of 100 km s-1, rather like the massive YSO stellar wind sources, but it is much more luminous in the radio continuum. The brightness of the radio lobes has recently been shown to be getting significantly fainter on a timescale of 10 years (Franco-Hernández et al. 2004). The short lifetime for this phase would be consistent with the rarity of objects like NGC 7538 IRS 1.


Another object commonly placed in this category is MWC 349A. However, its linewidths are somewhat narrower and the mm-wave recombination lines are masing which is not seen in other hyper-compacts (Martín-Pintado et al. 1989). There are still question marks over the evolutionary stage of MWC 349A and even whether it is a young or post-main sequence object (e.g. Meyer et al. 2002).
It is tempting to associate these bipolar hyper-compacts with the turn-on phase of the H II region as it expands down the previously excavated bipolar outflow cavities. For simple H II region expansion it is possible for the gas to get up to a few times the ionized gas sound speed (10 km s-1) when travelling down the steep density gradients expected away from the disk plane. Franco et al. (1989, 1990) found speeds up to around 30 km s-1 for steep power-law density gradients and for some disk-like density gradients.
In particular, the bipolar H II regions resulting from disk-like density distributions have some interesting features that may be relevant to features appearing at the density distributions expected at the turn-on phase, and need further exploration. For instance, as pointed out by Franco et al (1989), the dynamics of the H II regions depends on the details of the density distribution, and its appearance will be affected by recombination fronts that can result in bipolar molecular outflows, originally generated by the photoionized plasma. This type of phenomenon and the fragmentation created by instabilities in the ionization-shock fronts (Garcia-Segura and Franco 1996), along with complex structure of combined ionization-photo-dissociation fronts (Diaz-Miller et al 1998), may provide some hints to the origin of the multiple flows with knotty structures discussed above.
Another model which is commonly invoked to explain bipolar hyper-compacts, is the photo-evaporating disk model by Hollenbach et al. (1994) mentioned above. This is a variation of the Franco et al (1989) model, in which the disk is now supposed to be formed from the gas accreted into the massive protostar. Lugo et al. (2005) show that such a picture can match the radio continuum spectrum for MWC 349A and NGC 7538 IRS 1. Such a thermal expansion model is capable of explaining the relatively low velocities in MWC 349A, but in no way can it account for the much faster flows in NGC 7538 IRS 1. MWC 349A does not appear to be deeply embedded in a molecular cloud and so a circumstellar disc origin is more likely. However, NGC 7538 IRS 1 is deeply embedded with evidence of large and small scale outflow activity (Davies et al. 1998; Kraus et al. 2006).
To explain the velocities of order hundred km s-1 in NGC 7538 IRS 1 and its intermediate nature between wind/jet sources and UCHII regions it is natural to think of some kind of transition object. One scenario is that a fast stellar wind, perhaps more like a main sequence radiatively driven wind travelling at around a thousand km s-1 is beginning to blow down the bipolar cavity and entrain material. As the star contracts onto the main sequence, as it must do in order to produce the Lyman continuum in the first place, such a wind will inevitably come with the increase in extreme UV radiation. It is certainly within the realms of possibility that such a wind will get mass-loaded with material from the walls of the bipolar cavity.
In this picture one would also expect to find much larger bipolar objects as the wind and ionization break out the axes. One such object is the bipolar H II region S106. The ionized lobes of this object have broad lines with HWZI=95 km s-1 (Solf & Carsenty 1982; Jaffe & Martin-Pintado 1999) and the full extent is about 0.7 pc. It has a limb-brightened appearance (Felli et al. 1984), which together with the presence of actual line-splitting indicates a swept-up bipolar shell structure. With his usual insight Dyson (1983) developed a model for S106 whereby a star turns on in a plane-stratified medium where the H II region quickly breaks out in the polar direction and is followed by the stellar wind sweeping the nebula into a thin bi-cylindrical structure. At the ends of the nebula the shell is predicted to be Rayleigh-Taylor unstable and break up. Such a picture is consistent with the latest dramatic near-IR pictures of the nebula by 8 m telescopes (Oasa et al. 2006). To get the right expansion velocity of the shell Dyson’s model used main sequence parameters for the stellar wind, which are consistent with its overall luminosity and spectral type. However, the spectral characteristics of the exciting source are more like those of a massive YSO (Drew et al. 1993). It is also one of the equatorial wind sources (Hoare et al. 1994), although this does not preclude a main sequence wind blowing from the poles of the star.
Objects like S106 are rare, in fact as an optically visible example it is currently unique. Dyson (1983) rightly pointed out that these objects would be rare with only a few in the whole galaxy. K3-50A (Turner & Welch 1984; De Pree et al. 1994) and W49N A2 (De Pree et al. 2004) appear to be similar objects, although they have strong ionized emission in the disc plane, whereas S106 has a lack of emission in the disc plane. NGC 6334 A also shows bipolar lobes with a significant velocity gradient, but this time breaking out from a more shell-like central source (De Pree et al. 1995). G5.89-0.39 may be another example of this structure (Acord et al. 1998). The dynamical ages of these objects also appear very short, again attesting to their rarity, but it also seems that the vast majority of ultra-compact H II regions do not have a bipolar morphology.
5 Ultra-compact H II Regions
A global review of the most important features for the evolution of HII regions, from the ultra compact stages to the extended phases, is given by Dyson and Franco (2001). The usual definition of UCHII regions is that they have sizes smaller than 0.1 pc and electron densities above to 104 cm-3, and are located in the inner, high-pressure, parts of the parental molecular clouds (see Kurtz and Franco 2002, Kurtz et al. 2000 and Hoare et al. 2006 for reviews). As stated above, there is also an even more compact stage referred to as the hyper-compact phase.
There are about a thousand candidates identified, and they are classified into a variety of morphologies, ranging from spherical to irregular. Their internal density structure can be derived with the method of spectral index analysis, and power-law decreasing distributions with steep slopes (exponents below -2) have been obtained for some objects (Franco et al 2000). The large number of objects at this UC stage may be due to two independent factors; one is that some of them have extended emission that was missed due to selection effects in the early studies (Kurtz et al. 1999; Kim and Koo 1996, 2001), and the other one is that they do not seem to be the short-lived phase predicted by simple models of expanding H II regions. The first factor simply implies that the actual number of UCHII regions has to be revised, and is probably smaller than initially stated. In addition, the possibility of having UCHII regions with a compact core and a large, more diffuse, envelope seems to be a logical consequence of the steep density gradients found by Franco et al. (2000). The second factor implies that the simple model is not directly applicable at this UC stage, and there may be several mechanisms that would confine them and delay their expansion. Indeed, there are a number of models proposed to explain the apparently slower growth rates, including the possibility of reaching pressure equilibrium inside cloud cores.
The cores of massive molecular clouds are clumpy, turbulent, and highly pressurised regions. Their total central pressures are above 106 dyn cm-2 (see Garcia-Segura and Franco 1996), and some H II regions can reach pressure equilibrium within the central uniform-density core. If this occurs, the resulting pressure-confined regions will have sizes of pc, and densities around cm-3, where the UV photon flux is photons s-1, dyn cm-2, and the photoionized plasma temperature is K (the sizes are similar for the case of massive star wind-driven bubbles; see Garcia-Segura and Franco 1996, and Kurtz et al 2001). As indicated above, these sizes and densities are already typical of UCHII regions. If one includes dust absorption, the sizes are shortened even more (see Diaz- Miller et al 1998 and Arthur et al. 2004), making this mechanism even more attractive to confine the growth of UCHIIs. These, however, are only a few parts of a much more complicated story; the simplified pressure equilibrium scheme does not include the presence of clumps in highly dynamical cloud cores, nor the motion of stars inside the cloud. In addition, it does not explain the variety of morphologies that are already known for these objects.
Again, John’s physical intuition was used to explore the effect of these cloud core clumps in the expansion of the ionization front. The net result is that, as the clumps are photo-evaporated inside the H II region, the growth of the ionized region stalls because the recombination rate increases as the mass and density of the photoionized gas is increased (Dyson et al. 1995; Williams et al 1996; Redman et al. 1996; Redman et al. 1998). Thus, the destruction of clumps is an effective mass-loading mechanism that reduces the expansion rate of the H II region, leading to a substantially longer lifetime of the ultra compact stage.
Another issue that has been considered in some detail is the origin of cometary UCHIIs. Their structure, with a bright head and a more diffuse extension on one side, resembles the morphological features of comets. Also, cometary UCHII regions are among the most common objects (they represent at least 20 % of them and maybe many more (Hoare et al. 2006)), and their shapes have been ascribed to either bow-shocks generated by the motion of the exciting star (see Van Buren and McCray 1988 and Van Buren and Mac Low 1992) or by the presence of a density gradient on one side of the parental cloud, that creates a ”champagne flow” (e.g., Tenorio-Tagle 1979). A recent study by Arthur and Hoare (2006), which modelled the structuring and emission of the objects created by both types of models, indicates that the most likely origin is due to density gradients with a champagne flow. In these numerical models the affect of stellar winds was included which swept the H II region into a thin shell and results in the limb-brightened appearance of many cometaries. Once again John had considered such a problem many years before whereby a stellar wind bubble expanded in an H II region with a density gradient (Dyson 1977).
The motion of stars have a role in the structuring of both H II regions and clouds. The fact that the star moves back and forth from high to low densities, as it moves within the gravitational field of the cloud, a wide variety of transient and complex structures are created (see Franco et al 2006).
6 The impact of massive stars
The birth of a massive star is a strong source of energy that excites, stirs and ionizes the parental molecular cloud. The UV photon flux results in expanding H II regions, while the strong winds create expanding bubbles that are internal to the main body of the H II region. In addition, the non-ionizing UV radiation is able to dissociate the molecular gas creating a layer of atomic hydrogen that envelops the H II region. Thus, several distinct regions form around the young massive star, creating a nested structure with a wind-driven bubble, a photoionized H II region, and a photo-dissociated (PDR) region. The details, extent, and structure of these regions depend on the mass of the young star, the ambient density structure, and the age of the star. Regardless of these details, however, the combined action of radiation and winds evaporates the gas surrounding the new stars and finally destroys the molecular cloud, effectively shutting-off the star formation process. The evaporation of the cloud occurs via peripheral blisters, or champagne flows.
As discussed by Franco et al (1994) and Diaz-Miller et al (1998), then, the star-forming capacity of molecular clouds is limited by cloud destruction from massive stars. The limit on the number of massive stars is set by the overlap of internal H II and PDR regions. Thus, one of the main roles played by the energy injection from massive stars is to set a star formation control that regulates the number of stars formed within any star-forming cloud. This, in turn, implies that such a process also regulates the actual star-forming cycle of galactic systems.
After the parental cloud is destroyed, the expanding shells continue their evolution in the general interstellar medium, creating supershells. Most of the supernovae resulting from the newly formed stellar group actually explode inside these cavities. Thus, at the late stages of massive star lives, the impact is shaping and stirring the general ISM.
References
- (1) J. M. Acord, E. Churchwell, D. O. S. Wood: ApJ, 495, L107 (1998)
- (2) C. Alvarez, M. G. Hoare, A. Glindemann, A. Richichi: A&A 427, 505 (2004)
- (3) C. Alvarez, M. G. Hoare: A&A 440, 569 (2005)
- (4) S. J. Arthur, S. Kurtz, J. Franco, M. Albarran: ApJ 608, 282 (2004)
- (5) S. J. Arthur, M. G. Hoare: ApJ in press (2006)
- (6) R. Banerjee, R. E. Pudritz: ApJ 641 949 (2006)
- (7) A. Behrend, A. Maeder: A&A 373, 190 (2001)
- (8) P. A. Bernasconi, A. Maeder: A&A 307, 829 (1996)
- (9) H. Beuther, P. Schilke, T. K. Sridharan, K. M. Menten, C. M. Walmsley, F. Wyrowski: ApJ 383, 892 (2002a)
- (10) H. Beuther, P. Schilke, P., F. Gueth, M. McCaughrean, M. Andersen, T. K. Sridharan, K. M. Menten: ApJ 387, 931 (2002b)
- (11) J. H. Bieging, D. C. Abbott, E. B. Churchwell: ApJ 340, 518 (1989)
- (12) I. A. Bonnell , M. R. Bate, H. Zinnecker: MNRAS 298, 93 (1998)
- (13) J. C. Bunn, M. G. Hoare, J. E. Drew: MNRAS 272, 346 (1995)
- (14) B. Campbell, S. E. Persson, P. J. McGregor: ApJ 305, 336 (1986)
- (15) E. Churchwell: The Origin of Stars and Planetary Systems, in NATO Science Series vol 540, ed. by C. Lada & N Kylafis, (Kluwer, Dordrecht, The Netherlands 1999), pp 515–552
- (16) S. Curiel et al: ApJ, 638, 878 (2006)
- (17) C. J. Davis, G. Moriarty-Schieven, J. Eislöffel, M. G. Hoare, T. P. Ray: AJ 115, 1118 (1998)
- (18) C. J. Davis, W. P. Varricatt, S. P. Todd, S. P., S. K. Ramsay Howat: A&A 425, 981 (2004)
- (19) C. De Pree, W. Goss, P. Palmer, R. Rubin: ApJ 428, 670 (1994)
- (20) C. De Pree, L. F. Rodríguez, H. R. Dickel, W. Goss,: ApJ 447, 220 (1995)
- (21) C. G. De Pree et al: ApJ 600, 286 (2004)
- (22) R. Diaz-Miller, J. Franco, S. N. Shore: ApJ 501, 192 (1998)
- (23) J. E. Drew, J. C. Bunn, M. G. Hoare: MNRAS 265, 12 (1993)
- (24) J. E. Drew, D. Proga, J. M. Stone: MNRAS 296, L6 (1998)
- (25) J. E. Dyson: A&A 59, 161 (1977)
- (26) J. E. Dyson: A&A 124, 77 (1983)
- (27) J. E. Dyson, R. J. R. Williams, M. P. Redman: MNRAS 277, 700 (1995)
- (28) J. E. Dyson, J. Franco: Encyclopedia of Astronomy and Astrophysics. (MacMillan, London 2001))
- (29) M. Felli, M. Massi, E. Churchwell: A&A 136, 53 (1984)
- (30) J. Franco, A. Carramiñana: Interstellar Turbulence, (Cambridge Univ. Press, Cambridge 1999)
- (31) J. Franco, G. Tenorio-Tagle, P. Bodenheimer: RMexAA 18, 65 (1989)
- (32) J. Franco, G. Tenorio-Tagle, P. Bodenheimer: ApJ 349, 126 (1990)
- (33) J. Franco, S. Kurtz, P. Hofner, L. Testi, G. García-Segura, G., M. Martos: ApJ 542, L143 (2000)
- (34) R. Franco-Hernández, L. F. Rodríguez: ApJ 604, L105 (2004)
- (35) G. Garcia-Segura, J. Franco: ApJ 496, 171 (1996)
- (36) A. G. Gibb, M. G. Hoare, L. T. Little, M. C. H. Wright: MNRAS 339, 1011 (2003)
- (37) J. Hatchell, F. F. S. van der Tak: A&A 409, 589 (2003)
- (38) M. G. Hoare, J. E. Drew, T. B. Muxlow, R. J. Davis: ApJ 421, L51 (1994)
- (39) M. G. Hoare, T. B. Muxlow: Radio Emission from the Stars and the Sun. In ASP Conf. Ser., Vol. 93, ed by A. R. Taylor, J. M. Paredes (ASP, San Francisco 1996) pp 47–49
- (40) M. G. Hoare: Hot Star Workshop III: The Earliest Stages of Massive Star Birth. In ASP Conf. Ser. Vol. 267, ed by in P. A. Crowther (ASP, San Francisco 2002) pp 137-144
- (41) M. G. Hoare, S. E. Kurtz, S. Lizano, E. Keto, P. Hofner: Protostars and Planets V, ed. by B. Reipurth, D. Jewitt, & K. Keil, (Tuscon: University of Arizona Press) in press
- (42) P. Höflich, R. Wehrse, R.: A&A 185, 107 (1987)
- (43) D. Hollenbach, D. Johnstone, S. Lizano, F. Shu: ApJ 428, 654 (1994)
- (44) R. Indebetouw, et al: ApJ 619, 931 (2005)
- (45) D. Jaffe, J. Martin-Pintado: ApJ 520, 162 (1999)
- (46) J. Jijina, F. C. Adams: ApJ 462, 874 (1996)
- (47) F. D. Kahn: A&A 37, 149 (1974)
- (48) R. Kippenhahn, E. Meyer-Hofmeister A&A 54, 539 (1977)
- (49) M. R. Krumholz, R. I. Klein, C. F. McKee: Massive Star Birth: A Crossroads of Astrophysics. In IAU Symp. 227, ed by R. Cesaroni, M. Felli, E. Churchwell, M. Walmsley (Cambridge University Press, Cambridge 2005a), pp 231–236
- (50) M. R. Krumholz, C. F. McKee, R. I. Klein: ApJ 618, L33 (2005b)
- (51) K.-T. Kim, B.-C. Koo: JKAS 29, 177 (1996)
- (52) K.-T. Kim, B.-C. Koo: ApJ 549, 979 (2001)
- (53) S. Kraus et al: astro-ph/0604328 (2006)
- (54) S. E. Kurtz, J. Franco: RMexAA 12, 16 (2002)
- (55) S. E. Kurtz, R. Cesaroni, E. Churchwell, P. Hofner, M. Walmsley: Protostars and Planets IV, ed by V. Mannings et al. (Univ of Arizona Press, Tucson 2000), pp 299–326
- (56) S. E. Kurtz, A. M. Watson, P. Hofner, B. Otte: ApJ 514, 232 (1999)
- (57) S. E. Kurtz: Massive Star Birth: A Crossroads of Astrophysics. In IAU Symp. 227, ed by R. Cesaroni, M. Felli, E. Churchwell, M. Walmsley (Cambridge University Press, Cambridge 2005), pp 111–119
- (58) S. Kurtz, E. Churchwell, D. O. S. Wood: ApJS 91, 659 (1994)
- (59) C. J. Lada: ARA&A 23, 267 (1985)
- (60) R. B. Larson & S. Starrfield: A&A 13, 190 (1971)
- (61) R. B. Larson: MNRAS 194, 809 (1981)
- (62) C. F. McKee, J. C. Tan: ApJ 585, 850 (2003)
- (63) J. Martí, L. F. Rodríguez, B. Reipurth: ApJ 374, 169 (1993)
- (64) J. Martí, L. F. Rodríguez, B. Reipurth: ApJ 502, 337 (1998)
- (65) J. Martí, L. F. Rodríguez, J. M. Torrelles: A&A 345, L5 (1999)
- (66) J. Martín-Pintado, R. Bachiller, C. Thum, M. Walmsley: A&A 215, L13 (1989)
- (67) J. M. Meyer, K. H. Nordsieck, J. L. Hoffman AJ 123, 1639 (2002)
- (68) L. G. Mundy, G. A. Adelman: ApJ 329, 907 (1988)
- (69) T. Nakano: ApJ 345, 464 (1989)
- (70) P. Norberg, A. Maeder: A&A 359, 1025 (2000)
- (71) F. Palla, S. W. Stahler: ApJ 392, 667 (1992)
- (72) R. K. Prinja, M. J. Barlow, I. D. Howarth: ApJ 361, 607 (1990)
- (73) A. Noriega-Crespo et al: ApJS 154, 352 (2004)
- (74) Y. Oasa et al: AJ 131, 1608 (2006)
- (75) N. A. Patel et al: Nature 437, 109 (2005)
- (76) R. Plume, D. T. Jaffe, N. J. Evans, J. Martin-Pintado, J. Gomez-Gonzalez: ApJ 476, 730 (1997)
- (77) M. P. Redman, R. J. R. Williams, J. E. Dyson: MNRAS 280, 661 (1996)
- (78) M. P. Redman, R. J. R. Williams, J. E. Dyson: MNRAS 298, 33 (1998)
- (79) N. Ridge, T.J. T. Moore: A&A 378, 495 (2001)
- (80) L. F. Rodríguez, G. Garay, K. J. Brooks, D. Mardones: ApJ 626, 953 (2005)
- (81) D. Schertl, Y. Balega, T. Hannemann, K.-H. Hofmann, Th. Preibisch, G. Weigelt: A&A 361, L29 (2000)
- (82) P. R. Schwartz: ApJ, 338, L25 (1989)
- (83) D. S. Shepherd, S. E. Kurtz: ApJ 523, 690 (1999)
- (84) S. A. Sim, J. E. Drew, K. S. Long: MNRAS 363, 615 (2005)
- (85) M. Simon, L. Cassar: ApJ, 283, 179 (1984)
- (86) J. Solf, U. Carsenty: A&A 113 142 (1982)
- (87) J. C. Tan, C. F. McKee: Star Formation at High Angular Resolution. In IAU Symp. 221, ed by M. G. Burton, R. Jayawardhana, T. Bourke (http://www.phys.unsw.edu.au/iau221 2003)
- (88) G. Tenorio-Tagle: A&A 71, 59 (1979)
- (89) S. Terebey, F. Shu, P. Cassen: ApJ 286, 529 (1984)
- (90) G. Tofani, M. Felli, G. B. Taylor, T. R. Hunter: A&AS 112, 299 (1995)
- (91) K. Tomisaka: ApJ 575, 306 (2002)
- (92) M. A. Trinidad et al: ApJ 589, 386 (2003)
- (93) J. L. Turner, W. J. Welch: ApJ 287, L81 (1984)
- (94) D. Van Buren, R. McCray: ApJ 329, L93 (1988)
- (95) D. Van Buren, M.-M. MacLow: ApJ 394, 534 (1992)
- (96) C. M. Walmsley: Rev. Mex. Ast. Ap. Conf. Ser. 1, 137 (1995)
- (97) R. J. R. Williams, J. E. Dyson, M. P. Redman: MNRAS 280, 667 (1996)
- (98) D. O. S. Wood, E. Churchwell: ApJS 69, 831 (1989)
- (99) M. G. Wolfire & J. P. Cassinelli: ApJ, 319, 850 (1987)
- (100) A. E. Wright, M. J. Barlow: MNRAS 170, 41 (1975)
- (101) H. W. Yorke, C. Sonnhalter: ApJ 569, 846 (2002)