Elastic constants and volume changes associated with two high-pressure rhombohedral phase transformations in vanadium
Abstract
We present results from ab initio calculations of the mechanical properties of the rhombohedral phase () of vanadium metal reported in recent experiments, and other predicted high-pressure phases ( and bcc), focusing on properties relevant to dynamic experiments. We find that the volume change associated with these transitions is small: no more than 0.15% (for – ). Calculations of the single crystal and polycrystal elastic moduli (stress-strain coefficients) reveal a remarkably small discontinuity in the shear modulus and other elastic properties across the phase transitions even at zero temperature where the transitions are first order.
pacs:
62.50.+p, 61.50.Ks, 31.15.Ar, 62.20.DcI Introduction
The existence of a high-pressure rhombohedral phase of pure crystalline vanadium has been the focus of an intense research effort recently. The first indication of a phase transition came from the theoretical observation that the C44 shear modulus of bcc vanadium decreases and becomes negative at pressures greater than 1.3 Mbar,Suzuki ; Landa pressures that are experimentally accessible. A negative shear modulus means the material is mechanically unstable under trigonal (prismatic) shear, suggesting a phase transition. At that time the experimental evidence showed no phase transition up to 1.54 Mbar.Kenichi Then recently, Mao and coworkers Mao conducted x-ray diffraction experiments in the diamond anvil cell (DAC) up to 1.5 Mbar and found features in the diffraction peaks that were consistent with a second-order phase transformation to a rhombohedral structure with an Rm point group symmetry at pressures above 0.69 Mbar. It was soon confirmed that density functional theory (DFT) finds the rhombohedral phase to be the ground state at zero temperature and pressures above 0.8 Mbar, in reasonably good agreement with experiment.Lee In fact, it was shown that DFT predicts additional phase transformations that had not been found in experiment, i.e. a first-order transformation to a different rhombohedral structure at 1.2 Mbar and a third transformation back to the bcc structure at 2.8 Mbar.Lee The prediction of the existence of the two high pressure phase transformations has been subsequently confirmed with DFT phonon calculations.Luo
Alternative techniques may provide the pressures needed to observe the second rhombohedral phase and the reentrant bcc phase. Dynamic experiments do not rely on the mechanical integrity of anvils and are able to reach multi-megabar pressures. They have been used to study similar transformations such as the diffusionless - transition in iron.DuvallGraham There are several challenges specific to vanadium, however. The softening of the shear modulus and the rhombohedral phase transition are related to subtle electronic effects,Landa which are likely to be weakened by increased temperature. Recent ramp wave techniques based on Z,Asay laserRemington ; Smith and graded-density impactorNguyen drives are able to generate high pressure without the entropy generation of shockwave techniques, and are therefore preferable in the present context. Another challenge is that the subtle rhombohedral distortion () detected by x-ray diffraction in the DAC is probably too small for in-situ x-ray diffraction in dynamic experiments.Kalantar Indirect techniques are an alternative to detect the transition. For example, VISAR free-surface velocity measurements can detect changes in the density due to a volume change, and they can be used to infer the longitudinal stress, and hence the change in strength if the equation of state is known.Gupta ; Smith Rayleigh-Taylor growth rate is another way to probe strength.Remington
In this article we use DFT to make predictions about the properties of high-pressure vanadium relevant to dynamic experiments. We compute the magnitude of the volume change associated with the three phase transitions related to the rhombohedral structure in Section III. We also compute the elastic properties and calculate bounds on, and an explicit estimate of, the polycrystalline shear modulus in Section IV and Section V respectively. Since the strength is typically assumed to vary with the shear modulus,SteinbergGuinan any anomalies in the shear modulus are likely to provide a signature in the VISAR trace. Indeed, an important motivation for the present work is to assess whether the bcc shear modulus going to zero is likely to produce a strong signature. The shear modulus also affects defect energetics, and may have a measurable effect on transition kinetics. We consider the implications of our results for dynamic experiments to detect the high-pressure phases.
II Theoretical Background
The rhombohedral crystal structure of vanadium at high pressure results from a slight distortion of the bcc structure. Specifically the distortion is a uniaxial strain along , which remains a three-fold symmetry axis of the crystal. This structure is known as the -Po structure (Strukturbericht Ai, Pearson hR1). It still has a single atom per unit cell, so the rhombohedral transition may be expected to be diffusionless (martensitic) and likely rapid despite the small energy difference. There are four independent three-fold axes, so there are four variants of the rhombohedral crystal that are degenerate in energy.
The ground state of the single-crystal rhombohedral phase has been determined from first principles using a volume-conserving rhombohedral shear path,Lee
| (1) |
in the usual bcc crystal frame where is determined from the real positive solution of to insure constant volume. The approach is to use DFT in combination with a gradient-corrected exchange and correlation energy functional GGA as implemented in the Vienna Ab-initio Simulation Package (VASP) code along with the projector augmented-wave (PAW) method.PAW Specifically, the PAW potentials with 13 valence electrons (3, 3, 3, and 4 states) are used. The planewave cutoff energy is 66.15 Ry and an unshifted 606060 uniform mesh is used for the -point sampling: this results in 5216 and 18941 points in the irreducible Brillouin zone of the unstrained bcc and rhombohedral lattices, and up to 18941 and 54932 points for the strained bcc and rhombohedral lattices respectively. For all of the calculations we use a primitive cell.
III Volume change due to transformation
In Ref. Lee, , we calculated the enthalpy and pressure as functions of strain along the rhombohedral deformation path, and used the enthalpy to find any stable or metastable crystal structures. We noted that the equations of state (EOS) for the bcc and rhombohedral structures are nearly identical, so their bulk moduli are essentially equal (differing by no more than 3%), and reported the EOS of the ground state up to 2 Mbar. We now use those data together with additional data on the EOS of the metastable structures to calculate the volume change associated with the phase transformations in a readily accessible form.
Using the EOS for the stable and metastable structures (), we have calculated the associated volume change according to
| (2) |
for pairs of structures and . In practice, we have calculated the pressure at a set of volumes and used piece-wise quadratic interpolatation to solve the equal pressure condition (2) between those points, equivalent to the common tangent construction at the phase boundaries. The EOS data are tabulated in Table 1. The relative volume change with respect to the bcc phase, , is plotted in Fig. 1.
| Volume | Pressure | ||
|---|---|---|---|
| bcc | |||
| 1.000 | 0.000 | - | - |
| 0.831 | 0.479 | - | - |
| 0.804 | 0.596 | - | - |
| 0.779 | 0.726 | 0.724 | - |
| 0.759 | 0.840 | 0.838 | - |
| 0.754 | 0.870 | 0.869 | - |
| 0.729 | 1.031 | 1.030 | - |
| 0.717 | 1.118 | 1.117 | 1.110 |
| 0.707 | 1.191 | 1.190 | 1.183 |
| 0.705 | 1.210 | 1.209 | 1.202 |
| 0.681 | 1.408 | 1.407 | 1.399 |
| 0.659 | 1.627 | 1.627 | 1.620 |
| 0.636 | 1.869 | 1.870 | 1.866 |
| 0.614 | 2.136 | 2.138 | 2.140 |
| 0.593 | 2.430 | 2.433 | 2.445 |
| 0.588 | 2.494 | - | 2.510 |
| 0.572 | 2.769 | - | 2.782 |
| 0.568 | 2.841 | - | 2.852 |
| 0.551 | 3.149 | - | - |
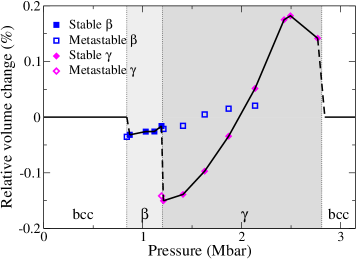
In principle, there is a volume change during the transformation from bcc () to the first rhombohedral phase (), and a second volume change associated with the transformation to the second rhombohedral phase (), and a third volume change associated with the transformation back to bcc () at high pressure. There is no path connecting and that preserves the point group, so they must be distinct phases; the two bcc regions appear to be connected at finite temperature.Landa In practice, the kinetics of the transformation may cause the transformation to be overdriven so that the initial phase is retained in a metastable state past the phase boundary until the new phase has a chance to nucleate and grow. For this reason it is interesting to examine the entire curve in Fig. 1, and not just the values in between the equilibrium phase boundaries.
In each case the initial is a volume change, so the volume is reduced following the transition. The volume change associated with the bcc to transformation is small, 0.03% or less in magnitude. It would not be easy to detect such a small change in a dynamic experiment. The magnitude of the volume change associated with the second transformation is larger: about 0.15% for the to transformation at 1.2 Mbar. The volume change would be about the same if bcc were retained to a pressure of 1.2 Mbar and then transformed directly to . This However, if the bcc or phase persists to higher pressures, the volume change becomes progressively smaller and eventually changes sign, becoming a volume expansion near 2 Mbar. The final transition back to bcc again has a change of over 0.1% in magnitude. So the to transformation has the strongest signature in terms of volume change, but it may not be large enough to detect.
IV Single crystal elastic moduli
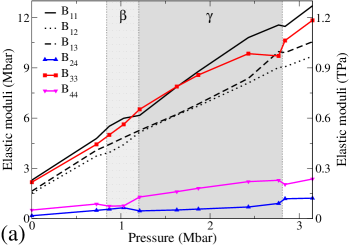
We next consider how the single crystal elastic moduli change with pressure. Specifically, we calculate , the elastic moduli with respect to a shear-stress-free reference state at pressure (either the bcc or rhombohedral structure, as specified). The are often called the stress-strain coefficients, as we do below.Wallace They are directly related to sound velocities at high pressure. can be obtained from the deformation paths used for orthorhombic latticeRavindran or for trigonal lattice,Zhao and the details are given in the appendix.
The six independent stress-strain coefficients, , , , , , and (here given in Voigt notation in the rhombohedral frame with directions , and as 1, 2 and 3, respectively), are plotted in Fig. 2(a). They are discontinuous at the first-order phase transitions; however, within the domain of each stable phase, most of the stress-strain coefficients increase monotonically with pressure. The exception is near the to reentrant bcc phase boundary (roughly 2.8 Mbar). Since is associated with uniaxial strain along the three-fold axis, its anomalous behavior is suggestive, but a better presentation is needed to separate the effects of shear and compression. We turn to it now.
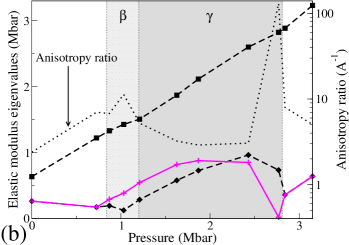
Indeed, there is a remarkable approximate continuity of the elastic properties across the phase transitions that is not readily apparent from the elements of . The bulk modulus of the rhombohedral phases is within 3% of that of the bcc structure, as we already discussed. The eigenvalues of the matrix provide a description of the elasticity that is less coordinate dependent, but there is a technical issue. In the rhombohedral phase, shear and compression are mixed in the sense that a non-equiaxed strain is required to produce purely hydrostatic pressure, and the tetragonal strains to produce hydrostatic pressure and pure shear are not orthogonal. To eliminate any ambiguity, we restrict to the space of constant volume strains using a projection matrix . Then the matrix has 5 nontrivial eigenvalues, corresponding to different shear moduli. This matrix is closely related to von Mises stresses.
The eigenvalues are plotted in Fig. 2(b). The top curve represents two degenerate eigenvalues that are equal to in the bcc phase, the usual shear modulus for tetragonal shear in the cubic crystal. It is quite smooth. The remaining three eigenvalues are degenerate in the bcc phase and equal to , the shear modulus for trigonal shear in the cubic crystal (not to be confused with the in the rhombohedral frame). In the rhombohedral phases two of these eigenvalues remain degenerate but one splits off. That single eigenvalue represents a pure shear corresponding to the rhombohedral deformation. Its value is which decreases toward zero as the pressure in the rhombohedral phases approaches the bcc phase boundary. This decrease is most pronounced approaching the high-pressure reentrant bcc phase (2.8 Mbar), but it is present at both. In the energy curves, it is clear that the width of the rhombohedral well is broadening with the change in pressure as it rises above the bcc well and quickly becomes unstable. By the same token, the single eigenvalue reaches its maximum at 1.87 Mbar, the pressure that the rhombohedral well is deepest and most stable against the bcc phase. The eigenvalues can also be used to study the elastic anisotropy of the crystal. The anisotropy ratio ( in bcc) has been calculated for all four phases from the ratio of the smallest and largest eigenvalues. For an isotropic material ; for vanadium is never less than its ambient value, fluctuates throughout the entire pressure range studied, and becomes extremely high near the –bcc boundary (). For comparison, the most anisotropic cubic transition metal at ambient conditions is copperHirthLothe with , and among all cubic elements recent calculations found for polonium =1/6 to 1/18 at T=0K.Legut
V Polycrystalline shear moduli
Polycrystalline vanadium without texture has isotropic mechanical behavior, described by just two independent elastic moduli: the bulk modulus and the shear modulus . Regardless of phase, is within 3% of that of the bcc structure as mentioned earlier. Using the single-crystal , may be bounded by the Voigt and Reuss approximations of constant strain and constant stress, respectively. We have calculated these approximations using expressions equivalent to those in the literature.Watt Since dynamic experiments conducted at Z-pinch and laser facilities often use thin-film targets with microstructures that can vary from columnar to equiaxed depending on how they are processed, the Voigt and Reuss bounds are helpful in assessing the range of possible responses. In calculating the Voigt and Reuss bounds shown in Fig. 3 (as well as the explicit polycrystalline calculations below), we assume that the deformations are infinitessimal. With the low energy barriers, switching between variants of the rhombohedral phase may contribute to the strain with no cost in stored elastic energy, leading to a reduction in the shear modulus. At larger strains the response to rhombohedral strains stiffens anharmonically. Both of these effects have been neglected. The homogenized shear modulus in the rhombohedral phase is positive, indicating mechanical stability. The variation in the Voigt-Reuss difference results from the changing crystalline anisotropy.
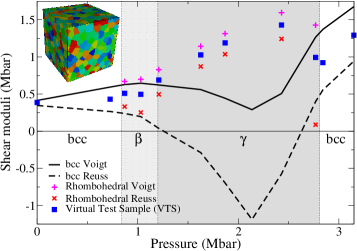
In the case of a microstructure with more equiaxed grains, we calculate the polycrystalline shear modulus by homogenizing the single-crystal of the ground state structure at each pressure using a virtual test sample (VTS).Becker The procedure in Ref. Becker, has been repeated: the VTS is strained in six pure shear modes (, , , , , and ), and the results from six calculations are averaged to reduce the effects of anisotropy. The isotropic average shear modulus() plotted in Fig. 3 has been obtained by equating the calculated elastic energy per volume to an ideal elastic solid at the same strain:
| (3) |
Only one or two of the six strains are nonzero at each run depending on which of the six modes has been applied, and the resulting variance in six independent runs is indicative of the anisotropy. The overall VTS prediction lies between the Voigt and Reuss bounds, and the VTS values are within 5% of the Voigt-Reuss-Hill averageVRH except at the reentrant bcc phase boundary, where the VTS value is 31% greater. The Voigt-Reuss difference at this phase boundary is quite large: 1.34 Mbar. The constant-stress Reuss average is sensitive to the most compliant orientation, whereas the Voigt average is fairly insensitive; the VTS shear modulus is closer to the Voigt value. It significantly decreases at this point of high anisotropy, and may lead to an anomalous dynamic response.
VI Conclusion
We have investigated the properties relevant to dynamic experiments for two high-pressure rhombohedral phases in vanadium metal. It will be challenging for dynamic experiments to detect the rhombohedral phase unambiguously. The distortion is probably too small for in-situ x-ray diffraction, although it might be large enough in .Lee We have predicted that the volume change associated with any phase transformation up to 3.15 Mbar is small, and may not have a clear signature in the VISAR trace. We have also predicted values for the single crystal and polycrystalline stress-strain coefficients in the rhombohedral phases at zero temperature. The and phases smoothly cut off the negative values of the bcc . The first order transitions between the bcc and rhombohedral phases give remarkably small changes in the stress-strain coefficients, as evident from the plots of the shear modulus and the stress-strain matrix eigenvalues, apart from near the –bcc transition where the crystal is highly anisotropic.
The results here were obtained using DFT at zero temperature for pure vanadium. Since the phase transition is driven by rather subtle electronic structure effects, the elastic constants may be substantially affected by changes in temperature or impurities.Landa ; Lee ; ShaCohen It would be interesting to see whether the remarkable continuity of the moduli persists as the phase boundaries and the relative stiffness of the bcc and rhombohedral structures change.
Acknowledgements.
We would like to thank G. Collins, A. Landa, D. Orlikowski, B. Remington, and P. Söderlind for useful discussions. This work was performed under the auspices of the U.S. Dept. of Energy by Lawrence Livermore National Laboratory under Contract DE-AC52-07NA27344.Appendix A Calculation of stress-strain coefficients in the rhombohedral lattice
| Stress-strain coefficient | Deformation gradient | Strain energy |
|---|---|---|
| (and ) | ||
| () |
| Stable | Volume | Pressure | Bulk | Single crystal stress-strain coefficients | Polycrystalline | |||||||
|---|---|---|---|---|---|---|---|---|---|---|---|---|
| phase | () | () | modulus () | VTS | Voigt | Reuss | ||||||
| bcc | 1 | 0.00 | 1.82 | 2.30 | 2.18 | 1.52 | 1.64 | 0.51 | 0.18 | 0.39 | 0.41 | 0.35 |
| bcc | 0.779 | 0.73 | 4.21 | 4.79 | 4.44 | 3.74 | 4.09 | 0.87 | 0.49 | 0.43 | 0.59 | 0.27 |
| 0.754 | 0.87 | 4.63 | 5.52 | 5.00 | 3.96 | 4.43 | 0.75 | 0.57 | 0.51 | 0.67 | 0.33 | |
| 0.729 | 1.03 | 5.09 | 6.00 | 5.63 | 4.42 | 4.84 | 0.77 | 0.65 | 0.50 | 0.70 | 0.25 | |
| 0.705 | 1.20 | 5.59 | 6.17 | 6.53 | 5.16 | 5.27 | 1.29 | 0.46 | 0.69 | 0.83 | 0.50 | |
| 0.659 | 1.62 | 6.77 | 7.87 | 7.89 | 6.19 | 6.23 | 1.61 | 0.52 | 1.03 | 1.14 | 0.87 | |
| 0.636 | 1.87 | 7.45 | 8.79 | 8.58 | 6.73 | 6.85 | 1.81 | 0.57 | 1.19 | 1.31 | 1.04 | |
| 0.593 | 2.45 | 9.02 | 10.81 | 9.85 | 8.11 | 8.38 | 2.21 | 0.70 | 1.43 | 1.60 | 1.24 | |
| 0.572 | 2.78 | 10.09 | 11.56 | 9.72 | 9.03 | 9.97 | 2.29 | 0.91 | 0.99 | 1.43 | 0.09 | |
| bcc | 0.568 | 2.84 | 10.15 | 11.48 | 10.64 | 9.07 | 9.91 | 2.04 | 1.19 | 0.92 | 1.37 | 0.56 |
| bcc | 0.551 | 3.15 | 10.99 | 12.71 | 11.84 | 9.70 | 10.56 | 2.37 | 1.22 | 1.29 | 1.68 | 0.94 |
The high-pressure stress-strain coefficients can be obtained in many different ways, but in Table 2, we summarize the deformation gradients and the corresponding strain energy relations that we used to calculate here. The pressure term is involved in some of the strain energy relations, for which the deformation gradients are not volume-conserving. The stress-strain coefficients are equal to when the pressure vanishes, as explained in detail in Chapter 2 of Ref. Wallace, . For a recent discussion of the stress-strain coefficients , see Ref. Cohen, . For , the relation isWallace
| (4) |
The resulting stress-strain coefficients along with the calculated polycrystalline shear moduli are tabulated in Table 3.
References
- (1) N. Suzuki and M. Otani, J. Phys.: Condens. Matter 14, 10869 (2002).
- (2) A. Landa, J. Klepeis, P. Söderlind, I. Naumov, L. Vitos, and A. Ruban, J. Phys.: Condens. Matter 18, 5079 (2006); A. Landa, J. Klepeis, P. Söderlind, I. Naumov, O. Velikokhatnyi, L. Vitos, and A. Ruban, J. Phys. Chem. Solids 67, 2056 (2006).
- (3) K. Takemura, in Science and Technology of High Pressure, Proceedings of AIRAPT-17, Hawaii, edited by M. H. Manghnani, W. J. Nellis, and M. F. Nicol (University Press, Hyderabad, India, 2000), p. 443.
- (4) Y. Ding, R. Ahuja, J. Shu, P. Chow, W. Luo, and H.-K. Mao, Phys. Rev. Lett. 98, 085502 (2007).
- (5) B. Lee, R. E. Rudd, J. E. Klepeis, P. Söderlind, and A. Landa, Phys. Rev. B75, 180101(R) (2007).
- (6) W. Luo, R. Ahuja, Y. Ding, and H.-K. Mao, Proc. Nat. Acad. Sci. 104, 16428 (2007).
- (7) G. E. Duvall and R. A. Graham, Rev. Mod. Phys. 49, 523 (1977).
- (8) D. B. Reisman, A. Toor, R. C. Cauble, C. A. Hall, J. R. Asay, M. D. Knudson, and M. D. Furnish, J. Appl. Phys. 89, 1625 (2001).
- (9) B. A. Remington et al., Mater. Sci. Tech. 22, 474 (2006).
- (10) R. F. Smith et al., Phys. Rev. Lett. 98, 065701 (2007).
- (11) J. H. Nguyen, D. Orlikowski, F. H. Streitz, J. A. Moriarty, and N. Holmes, J. Appl. Phys. 100, 023508 (2006)
- (12) D. Kalantar et al., Phys. Rev. Lett. 95, 075502 (2005).
- (13) J. B. Aidun and Y. M. Gupta, J. Appl. Phys. 69, 6998 (1991).
- (14) D. J. Steinberg, S. G. Cochran, M. W. Guinan, J. Appl. Phys. 51, 1498 (1980).
- (15) J. P. Perdew, K. Burke, and M. Ernzerhof, Phys. Rev. Lett. 77, 3865 (1996).
- (16) P. E. Blöchl, Phys. Rev. B50, 17953 (1994); G. Kresse and D. Joubert, Phys. Rev. B59, 1758 (1999).
- (17) D. C. Wallace, Thermodynamics of Crystals, (Dover, Mineola, 1972).
- (18) P. Ravindran, L. Fast, P. A. Korzhavyi, B. Johansson, J. Wills, and O. Eriksson, J. Appl. Phys. 84, 4891 (1998).
- (19) J. Zhao, J. M. Winey, and Y. M. Gupta, Phys. Rev. B75, 094105 (2007).
- (20) J. P. Hirth and J. Lothe, Theory of Dislocations, 2nd ed. (Krieger, Malabar, Florida, 1982).
- (21) D. Legut, M. Friák, and M. Šob, Phys. Rev. Lett. 99, 016402 (2007).
- (22) J. P. Watt and L. Peselnick, J. Appl. Phys. 51, 1525 (1980).
- (23) R. Becker, J. Comput.-Aided Mater. Design 9, 145 (2002); R. Becker, LLNL Report, UCRL-TR-234680 (2007).
- (24) R. Hill, Proc. Phys. Soc. London A 65, 349 (1952); D. H. Chung, Philos. Mag. 8, 833 (1963).
- (25) X. Sha and R. E. Cohen, Mater. Res. Soc. Symp. Proc. 987, 0987-PP05-08 (2007).
- (26) E. Gregoryanz, R. J. Hemley, H.-K. Mao, R. E. Cohen, and P. Gillet, Phys. Rev. Lett. 90, 079702 (2003).