11
E. Poretti
11email: ennio.poretti@brera.inaf.it 22institutetext: GEOS (Groupe Européen d’Observations Stellaires), 23 Parc de Levesville, 28300 Bailleau l’Evêque, France 33institutetext: Laboratoire d’Astrophysique, Observatoire Midi-Pyrénées, Toulouse, France 44institutetext: BAV, Munsterdamm 90, D-12169 Berlin, Germany 55institutetext: CESR (CNRS-UPS), Observatoire Midi-Pyrénés, Toulouse, France 66institutetext: Observatoire de Haute-Provence (CNRS/OAMP), France 77institutetext: IAG, Université de Liège, B-4000 Liège, Belgium
Stellar evolution in real time: Period variations in galactic RR Lyr stars
Abstract
The times of maximum brightness collected in the GEOS RR Lyr database allowed us to trace the period variations of a sample of 123 galactic RRab variables. These data span a time baseline exceeding 100 years. Clear evidence of period increases or decreases at constant rates has been found, suggesting evolutionary effects. The observed rates are slightly larger than those predicted by theoretical models; moreover, there is an unexpected large percentage of RRab stars showing a period decrease. The new possibilities offered by the use of robotic telecopes (TAROTs, REM) and of data from satellite (CoRoT) are expected to speed up the project to measure stellar evolution in real time.
keywords:
Astronomical data bases: miscellaneous – Stars: evolution – Stars: horizontal-branch – Stars: variables: RR Lyr1 Introduction
Horizontal branch stars cross the instability strip in different stages of their evolution; in these phases they become RR Lyr stars. The crossing can take place in both directions; as a consequence, the periods will be either increasing if the stars evolve from blue to red or decreasing if they evolve from red to blue. Despite its importance as a test for the stellar evolution theory, the observed rate of the period changes is still an unknown quantity.
The amateur/professional association GEOS (Groupe Européen d’Observations Stellaires) has built a database aiming to put together all possible RR Lyr light maximum times published in the literature. The publications from the end of the XIXth century up to today were scanned for this purpose and recent observations from amateur astronomers of the European groups GEOS and BAV (Bundesdeutsche Arbeitsgemeinschaft für Veränderliche Sterne) fed the database in a continuous way. To date, it contains about 50000 maximum times from more than 3000 RR Lyr stars. The GEOS database is freely accessible on the internet at the address http://dbrr.ast.obs-mip.fr/. Therefore, this database is the adequate tool to search for secular period variations in the galactic RR Lyr stars, since most of them have been studied for tens of years, several of them since the end of the XIXth century. The first result of the project, Stellar evolution in real time, have been presented by Le Borgne et al. (2007a). It is noteworthy that its outlines have been sketched during several GEOS meetings, where the different knowledge of amateur and professional astronomers found a very profitable synthesis.

2 The methodological approach: some insights
To calculate the rates of the period changes, the times of maximum brightness have been fitted by means of the linear elements
| (1) |
where is the period (in days) and is the cycle counter. In several cases the linear fit was not able to reproduce the observed times of maximum brightness and a parabolic trend appeared in the O–C (observed minus calculated values) plots. Therefore, the maxima were fitted with a second–order polynomial
| (2) |
where is the period at epoch . The value of the coefficient is related to the rate of the period change by means of
| (3) |
where is measured in [d/d] and is the average period, i.e., the ratio between the elapsed time and the elapsed cycles. Theoretical models often refer to the rate of period changes using the parameter, expressed in [d Myr-1], since it directly indicates how much the period change in 106 years.
Though the times of maximum brightness have been collected by using very different techniques (visual, photographic, photolectric, CCD), the very long time baseline allowed us to trace the period variation in a clear way. We extracted from the GEOS database the RRab stars for which the times of maximum brightness span more than 50 years. Fifty–four stars show a constant period, while 27 show an increasing period and 21 a decreasing one. The remaining 21 RRab variables show erratic changes. Figure 1 shows the histogram of the ratios between the modulus of the coefficient and its formal error for the 48 stars showing a linearly variable period. The ratios are always greater than 5.0 and are greater than 10 in all cases except four. Therefore, the parabolic trends are very well defined and they bear witness of the reliability of the results.
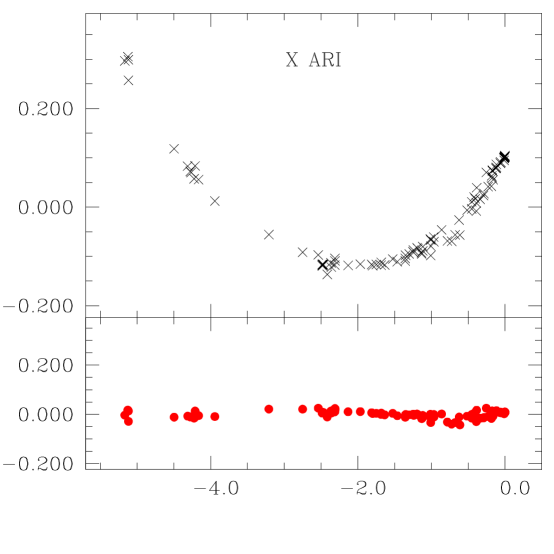
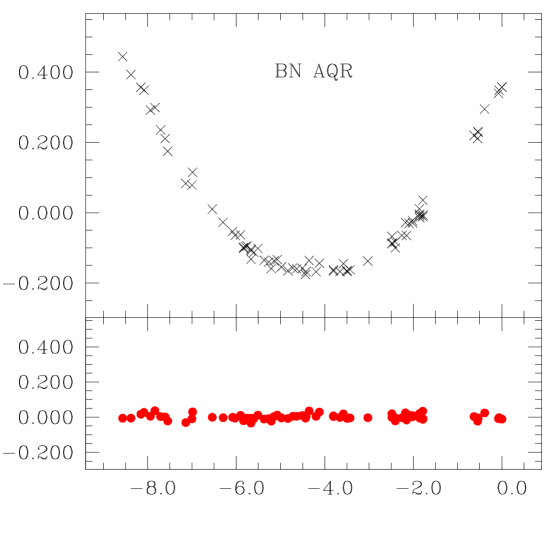
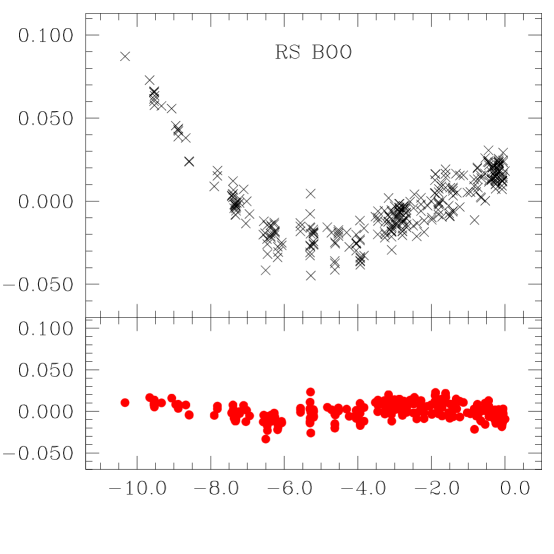
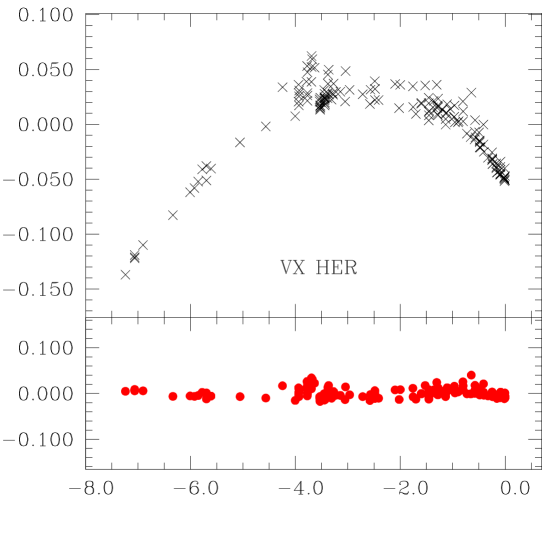
Figure 2 illustrates some examples of the O–C behaviours. Among the stars showing a period increase (top row), BN Aqr is one of the most evident cases: the parabolic trend left by the linear elements is very well defined and the two branches are symmetrical. No improvement has been obtained by introducing a third order term; as a matter of fact, the residual O–C values are very flat around the zero value. The O–C plot from the linear fit of the X Ari maxima is slightly different: the ascending branch seems to be steeper than the descending one. As a consequence, the residual O–C values show an apparent oscillation. We carefully investigated the nature of this oscillation, visible also in other cases. The related periodicities are often about half the time coverage and their amplitudes are quite small. Therefore, we can infer that the parabolic fit is not perfect and that some systematic residuals were left. The maxima of RS Boo shows this effect in a more pronounced way. In some cases we improved the O–C fitting by calculating a third–order least–squares fit, but in three cases only we obtained a significant third–order term. We note that no appreciable change is derived for the value of the coefficient when performing a third–order fit. The case of RS Boo is still more intriguing, since the residual O–C values show a scatter on another timescale, shorter than the two previous ones. As a matter of fact, when performing the frequency analysis of the residual O–C values (i.e., the prewhitened data after the third–order fit) we were able to detect a peak corresponding to at 534 d (Fig. 3), practically coincident with the value given by Oosterhoof (1949) for the Blazhko period, i.e., 533 d. The connection between period changes and the Blazhko effect is still unclear and deserves more attention in the future.
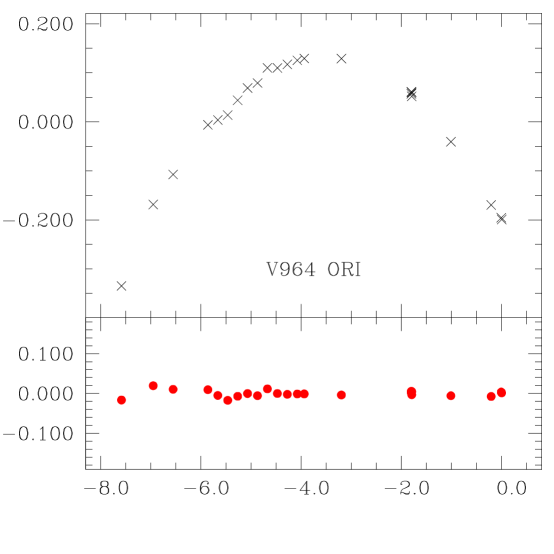
Among the stars showing a period decrease (bottom row), V964 Ori shows the clearest pattern, in spite of the small number of points. Asymmetrical O–C plots are also common, perhaps more common than in the case of period increases, and VX Her constitutes a good example. As in the case of RS Boo, also AH Cam shows a Blazhko effect, but on a very short timescale (only 11.18 d, Smith et al. 1994): it is notewothy that also in this case the times of maximum brightness are able to determine the correct Blazhko period (see Fig. 6 in Le Borgne et al. 2007a).

3 Scientific conclusions
The most remarkable result is the detection of a large number of O–C plots showing a parabolic pattern when linear elements are used. The cause of this pattern is a regular period variation, having the same order of magnitude of the expected evolutionary changes. On the other hand, in 54 cases (i.e., a number of cases similar to that of RR Lyr stars showing period variations) we did not detect a significant period variation and linear elements satisfy the available times of maximum brightness. The upper panel in Fig. 4 shows the distribution of the values in the sample of the galactic RRab stars. The central peak is given by the stars showing a constant period, but the number of stars both in the negative and in the positive planes are relevant.
Indeed, the comparison between RRab stars showing negative and positive rates yields us the most important scientific feedbacks. They can be evaluated in an easier way by removing the central peak (lower panel in Fig. 4). It is quite evident that the blueward evolution (decreasing periods, negative values; 21 cases) is as common as the redward one (increasing periods, positive values; 27 cases).

By analyzing and comparing these two samples, Le Borgne et al. (2007a) could stress some well–established observational facts:
-
1.
RRab stars experiencing blueward evolution are quite common, only slightly less than RRab stars experiencing redward evolution. The period range covered by the two groups are very similar and the average and median periods are nearly coincident;
-
2.
the absolute values of period changes are larger than expected. The theoretical evolutionary rates calculated by Lee (1991) predict values smaller than 0.30 for almost all stars. values greater than 0.30 are reported in exceptional cases. Since in our sample we have 18 stars with and 9 stars with 0.30, the 2:1 ratio seems too small to be caused by the exceptional conditions.
-
3.
Blazhko effect is often superimposed on secular changes, but the monotonic trend due to evolutionary variations still remains visible;
In particular, the rates of the period changes are difficult to associate with canonical horizontal–branch evolution. The large observed values could be ascribed to a sort of “noise” superimposed on the canonical evolutionary tracks, irrespective of where the star is in the course of its horizontal–branch evolution. However, this is still surprising since the main sources of this “noise” had been invoked to act toward the exhaustion of the helium in the core, but not before (Sweigart & Renzini, 1979). At this purpose, we also note that there is a numerous group of RRab stars showing erratic O–C behaviours, with abrupt or continuous period variations, never monotonic. The regular variations caused by light–time effect (and hence duplicity), often invoked to explain large O–C excursions, are not convincingly observed in any case (except maybe for RZ Cet) of our sample.
4 The future
As a general conclusion about the comparison between our observational results and the theoretical predictions, we claim that there is a very powerful feedback between the two approaches. In particular, theoretical investigations should take into account that many RR Lyr stars are showing a blueward evolution. The theoretical models should also match the observed values in a more satisfactory way, as these seem to be higher than expected, both for redward and blueward evolutions.
To rapidly progress in the project Stellar evolution in real time we need to accumulate much more accurate times of maximum brigthness. In such a case the parabolic trend will be evidenced over a time baseline much shorter than the 110 yr interval used for this first approach. The robotic telescopes TAROTs (Télescope à Action Rapide pour les Objets Transitoires or Rapid Action Telescope for Transient Objects; Bringer et al. 1999), operating at La Silla (Chile) and at Calern Observatory (France), are currently used to monitor RRab stars brighter than =13.0. They are providing very homogenous list of CCD maxima (e.g., Le Borgne et al. 2007b) characterized by small errorbars (0.003 d on average).
Another critical item is to investigate the interplay between Blazhko periods and evolutionary changes, which can be evidenced only by means of dense lists of maxima over one or two decades. We also have to note that the driving mechanism of the Blazhko phenomenon needs some clarification, since the two competitive explanations, the magnetic and the resonance models, are both still plausible. To pursue both goals in a specific way, we started a survey of few Blazhko RRab stars by using the robotic REM (Rapid Eye Movement, Covino et al. 2003) telescope located at La Silla, Chile.
Moreover, a substantial improvement in the study of the light curves of RR Lyr variables could be obtained by a continuous monitoring, without the seasonal or the night–day alternances. Such a possibility was a dream until a few years ago. After the successful launch on December 27th, 2006, the satellite CoRoT (COnvection, ROtation and planetary Transits) is now transforming the dream into reality. Staring on the same field for 150 d, CoRoT will monitor 10 bright stars in the asteroseismologic channel and 12000–15000 in the exoplanetary one. In the latter channel, the monitoring of some classical variables can be proposed in the framework of the “Additional Programs” and a specific one on RR Lyr variables has been approved (P.I.: M. Chadid, Nice University; some of the authors are CoIs). In such a context, the monitoring of three RR Lyr variables (V1127 Aql, V1220 Aql, and NSVS 12568727) has been proposed for the two first CoRoT runs with the goal to investigate very subtle cycle–to–cycle variations (and hence large or small Blazhko effects, if any).
Acknowledgements.
The authors wish to thank M. Catelan for the very useful discussions during the meeting and for further comments. EP acknowledges financial support from the Italian ESS project, contract ASI/INAF/I/015/07/0, WP 3170.References
- Bringer et al. (1999) Bringer, M., Boër, M., Peignot, C., Fontan, G., Merce, C. 1999, A&AS, 138, 581
- Covino et al. (2003) Covino, S., et al. 2003, AN, 325, 543
- Le Borgne et al. (2007a) Le Borgne, J.F., et al. 2007a, A&A, 476, 307
- Le Borgne et al. (2007b) Le Borgne, J.F., Klotz, A., Boër, M. 2007b, IBVS 5790 (GEOS Circular RR 31)
- Lee (1991) Lee, Y.W. 1991, ApJ, 367, 524
- Oosterhoof (1949) Oosterhoff, P. Th. 1949, BAN 10, 101
- Smith et al. (1994) Smith, H.A., et al. 1994, AJ, 107, 679
- Sweigart & Renzini (1979) Sweigart, A., Renzini, A. 1979, A&A, 71, 66