Highly deuterated pre–stellar cores in a high-mass star formation region ††thanks: Based on observations carried out with the IRAM Plateau de Bure Interferometer. IRAM is supported by INSU/CNRS (France), MPG (Germany) and IGN (Spain).
Abstract
Aims. We have observed the deuterated gas in the high-mass star formation region IRAS 05345+3157 at high-angular resolution, in order to determine the morphology and the nature of such gas.
Methods. We have mapped the N2H+ (1–0) line with the Plateau de Bure Interferometer, and the N2D+ (3–2) and N2H+ (3–2) lines with the Submillimeter Array.
Results. We have detected two condensations in N2D+, with masses of and M⊙ and diameters of 0.05 and 0.09 pc, respectively. The high deuterium fractionation () and the line parameters of the N2D+ condensations indicate that they are likely low- to intermediate-mass pre–stellar cores, even though other scenarios are possible.
Key Words.:
Stars: formation – Radio lines: ISM – ISM: individual (IRAS 05345+3157) – ISM: molecules1 Introduction
The initial conditions of the star formation process are still matter of debate. Studies have begun to unveil the chemical and physical properties of starless low-mass cores on the verge of forming low-mass stars (Kuiper et al. 1996; Caselli et al. 2002a; 2002b; Tafalla et al. 2002; 2006), demonstrating that in the dense and cold nuclei of these cores C-bearing molecular species such as CO and CS are strongly depleted (e.g. Caselli et al. 2002b; Tafalla et al. 2002), while N-bearing molecular ions such as N2H+ and N2D+ (Caselli et al. 2002a; 2002b; Crapsi et al. 2005) maintain large abundances in the gas phase, and their column density ratio reaches values of or more, much higher than the cosmic [D/H] elemental abundance (, Oliveira et al. 2003).
The characterisation of the earliest stages of the formation process of high-mass stars is more difficult than for low-mass objects, given their shorter evolutionary timescales, larger distances, and strong interaction with their environments. In order to check if the chemical properties peculiar of the earliest stages of low-mass stars are valid also for high-mass stars, Fontani et al. (2006) observed the deuterated gas in 10 sources selected from two samples of high-mass protostar candidates (Molinari et al. 1996; Sridharan et al. 2002), that are believed to be the closest to the earliest stages of the high-mass star formation process. One of these, IRAS 05345+3157 (hereafter I05345), stands out because of its very interesting characteristics: it is a luminous (L⊙ at a distance of 1.8 kpc, Zhang et al. 2005) young stellar object, embedded in a massive ( M⊙) dusty clump (Fontani et al. 2006) in which Molinari et al. (2002) revealed a complex structure in the molecular gas observed in the HCO+(1–0) line. From IRAM-30m spectra of the N2H+ (1–0) and N2D+ (2–1) lines, Fontani et al. (2006) have derived an average deuterium fractionation of , quite close to the values found by Crapsi et al. (2005) in low-mass starless cores. These results indicate the presence in the source of molecular gas with physical conditions similar to those of low-mass starless cores (i.e. K and cm-3 ). However, the precise location and the distribution of this gas, required to understand its nature, can be determined only through higher angular resolution observations.
In this letter, we present observations of N2H+ and N2D+ towards I05345, obtained with the Submillimeter Array (SMA) and the Plateau de Bure Interferometer (PdBI), and we report on the detection of two compact condensations of N2D+ that have chemical features typical of low-mass pre–stellar core candidates. A full report and a more detailed analysis of the data obtained will be presented in a forthcoming paper.
2 Observations and data reduction
Observations of N2D+ (3–2) (at 231321 MHz) and N2H+ (3–2) (at 279511.7 MHz) towards I05345 were carried out with the SMA111The Submillimeter Array is a joint project between the Smithsonian Astrophysical Observatory and the Academia Sinica Institute of Astronomy and Astrophysics, and is funded by the Smithsonian Institution and the Academia Sinica. (Ho et al. 2004) in the compact configuration on 30 January and 21 February 2007, respectively. The correlator was configured to observe simultaneously the continuum emission and several other molecular lines. The phase center was the nominal position of the sub-mm peak detected with the JCMT (Fontani et al. 2006), namely R.A.(J2000)=05h37m52.4s and Dec.(J2000)=32∘00′06′′, and the local standard of rest velocity is km s-1. For gain calibration, observations of I05345 were alternated with the sources 3C111 and J0530+135. 3C279 and Callisto were used for passband and flux calibration, respectively. The SMA data were calibrated with the MIR package (Qi 2005), and imaged with MIRIAD (Sault et al. 1995). Channel maps were created with natural weighting, attaining a resolution of: 3.′′73.′′0 for the N2D+ (3–2) channel map; 3.′′02.′′8 for the 225 GHz continuum image; 2.′′72.′′0 for the N2H+ (3–2) channel map; 1.′′91.′′2 for the 284 GHz continuum image.
We observed the N2H+ (1–0) line at 93173.7725 MHz towards I05345 with the PdBI on 11 and 20 August 2006, in the D configuration, and on 3 April 2007 in the C configuration. We used the same phase reference and velocities as for the SMA observations. The nearby point sources 0507+179 and 0552+398 were used as phase calibrators, while bandpass and flux scale were calibrated from observations of 3C345 and MWC349, respectively. For continuum measurements, we placed two 320 MHz correlator units in the band when making the observations in D configuration, and six 320 MHz correlator units in C configuration. The N2H+ lines were excluded in averaging these units to produce the final continuum image (at MHz). The synthesized beam size of the N2H+ channel map was 3.′′23.′′4, while that of the continuum was 3.′′13.′′2. We stress that the observations of the N2H+ (1–0) and N2D+ (3–2) lines have approximately the same angular resolution. The data have been reduced with the GILDAS software, developed at IRAM and the Observatoire de Grenoble.
The spectra of both N2H+ and N2D+ obtained from the cleaned maps have been analysed with the software CLASS, with the method described in Sect. 2.1.1 of Fontani et al. (2006).
3 Results
3.1 Structure of the source
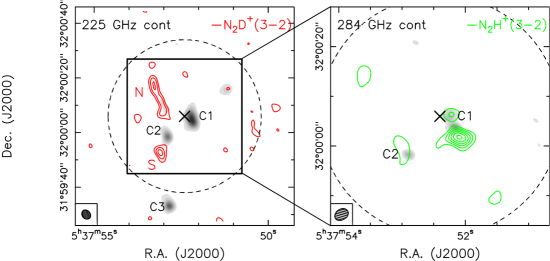
Right panel: map of the N2H+ (3–2) line emission integrated between –19.6 and –16.1 km s-1 towards I05345 (green contours), observed with the SMA (first contour = 3 rms ( Jy beam-1); step = 2 rms). The grey scale represents the 284 GHz continuum (first level is the 3 rms = 0.018 Jy beam -1; step = 3 rms). The dashed circle represents the primary beam at 284 GHz (′′). The cross indicates the map center and the ellipse in the bottom left corner is the SMA synthesised beam of the N2H+ image.
The map of the integrated intensity of the N2D+ (3–2) line, superimposed on the 225 GHz continuum map, is shown in the left panel of Fig. 1. The map indicates that the N2D+ emission arises from two molecular condensations: an extended clump located ′′ N–E of the map center and elongated ′′ in the N–S direction, and a compact core, ′′ in size, located ′′ S–E of the map center. In the following we will identify these condensations as N and S, respectively, and they represent the targets of the present study. The 225 GHz continuum image shows two main compact cores inside the SMA primary beam, one approximately corresponding to the map center and the other located ′′ S–E of the map center. Another compact source outside the interferometer primary beam is located ′′ south of the map center, and it corresponds to the southern continuum source detected in the JCMT image by Fontani et al. (2006, see their Fig. A.3). We will call these cores C1, C2 and C3, respectively. None of these cores overlaps with the two N2D+ condensations. Some extended emission however is detected at towards N. The right panel of Fig. 1 shows the N2H+ (3–2) integrated emission superimposed on the 284 GHz continuum emission, both observed with the SMA. At this frequency the continuum source C1 is resolved into a main peak and a fainter secondary peak north of the main one. The N2H+ (3–2) line integrated emission is compact and well overlaps with core C1, while it is detected only at 3 towards C2, and undetected towards N and S. The detection of N2H+ towards C1, and the non-detection of N2D+ at that location, is probably due to the fact that the continuum image is dominated by the emission of the warm dust, so that in the continuum condensation the temperature is too high for significant deuterium fractionation.
| Spectral resolution | velocity range | V | FWHM | ||||
|---|---|---|---|---|---|---|---|
| (km s-1) | (km s-1) | (K km s-1) | (km s-1) | (km s-1) | (K) | ||
| N | |||||||
| N2H+ (1–0) | 0.25 | –29.9; –12.5 | 8.7(0.3) | -17.915(0.003) | 0.732(0.007) | 4.132(0.212) | 6.7(0.1) |
| N2D+ (3–2) | 0.5 | –18.3; –16.7 | 0.64(0.03) | -17.91(0.02) | 0.88(0.014) | 0.1(fixed) | 6.71 |
| S | |||||||
| N2H+ (1–0) | 0.25 | –26.5; –9.3 | 10.3(0.5) | -17.283(0.005) | 0.73(0.01) | 6.1(0.4) | 6.6(0.1) |
| N2D+ (3–2) | 0.5 | –18.3; –16.7 | 0.82(0.06) | -17.51(0.04) | 0.88(0.06) | 0.1(fixed) | 6.61 |
1 assumed to compute the N2D+ total column density in Table 2
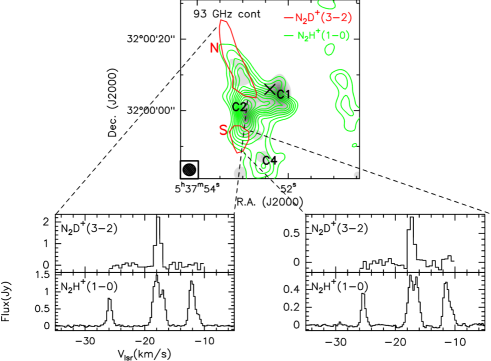
The integrated intensity map of the main group of the hyperfine (hfs) components of the N2H+ (1–0) line (see e.g. Caselli et al. 1995) observed with the PdBI is shown in Figure 2. The emission is extended and irregular, covering an area of ′′ in the N-S direction, and ′′ in the W-E direction. The main emission peak is close to C2, and the shape of the emission indicates that N2H+ (1–0) and the 93 GHz continuum are fairly-well overlapping. An extended component in both line and continuum oriented NE-SW roughly corresponds to condensation N. Another compact source, C4, is detected ′′ south of the map center. Such a different distribution of the integrated intensity with respect to that of the N2H+ (3–2) line is probably due to the fact that the extended emission is filtered out differently by the two interferometers. To compute the amount of the missing flux, we have compared our interferometric spectra with the single-dish spectra obtained with the IRAM-30m telescope (see Fontani et al. 2006). We have resampled the single-dish spectra of N2H+ (1–0) and (3–2) to the same resolution in velocity as the interferometric spectra. In the N2H+ (1–0) line, the flux measured by the PdBI is times less than that measured with the IRAM-30m telescope, while in the N2H+ (3–2) line the flux measured with the SMA is only one fifth of that measured with the 30m antenna. This indicates that the extended emission is much more resolved out in the SMA map with respect to the PdBI map.
3.2 N2H+ and N2D+ line parameters and deuterium fractionation
In Table 1 we give the N2H+ (1–0) and N2D+ (3–2) line parameters of the spectra integrated over the 3 rms level of the N2D+ emission in condensations N and S: in Cols. 3 – 7 we list integrated intensity (V), peak velocity (), FWHM, opacity of the main component (), and excitation temperature () of the lines. The integrated intensities have been computed over the velocity range given in Col. 2, while for the other parameters we have adopted the fitting procedure described in Sect. 2.1.1 of Fontani et al. (2006). We do not give the line optical depths and for the N2D+ lines because in both spectra the uncertainties are comparable to the values obtained. Because of this, we have fitted the lines forcing the optical depth to be 0.1.
Linewidths and peak velocities of both N2H+ and N2D+ are very similar in both condensations, indicating that they are tracing the same gas. In particular, the lines are km s-1 broad for both molecular species, i.e. nearly half of that observed with the IRAM-30m telescope. This can be due either to extended components with different velocity that have been resolved out, or to a decrease in turbulence going from the pc-scale to the sub-pc scale. However, it is interesting to notice that the lines are broader than the typical N2H+ and N2D+ lines observed towards low-mass pre–stellar cores, for which values of km s-1 are found on comparable linear scales (Crapsi et al. 2005, Roberts & Millar 2007).
We have derived N2H+ and N2D+ total column densities, (N2H+) and (N2D+), following the method described in the Appendix of Caselli et al. (2002b), which assumes a constant . (N2H+), (N2D+) and = (N2D+)/(N2H+), derived for N and S, are listed in Cols. 2, 3 and 4 of Table 2, respectively. These have been obtained using the values of given in Table 1. For the N2D+ (3–2) lines, we have assumed the excitation temperature of the N2H+ (1–0) line because we could not derive a reliable value from the fitting procedure taking into account the line hyperfine splitting, as already pointed out. In both condensations, is , which is comparable to the values of found in low-mass pre–stellar cores by Crapsi et al. (2005), following the same method. These values are also comparable to those derived by Pillai et al. (2007) in infrared-dark clouds from deuterated ammonia. However, their observations are related to the very cold, pc-scale molecular envelope, and not to compact sub-pc scale cores.
3.3 Nature of the N2D+ condensations
The main finding of this work is that the N2D+ emission in I05345 is concentrated in two condensations, both of them characterised by high values of deuterium fractionation. We discuss now which is the nature of these condensations.
We have computed the angular diameters of both condensations assuming that the N2D+ integrated intensity profile can be fitted with a 2D Gaussian: the geometric mean of the major and minor axis resulting from these fits has been corrected for the beam size. Then, the linear diameters, , have been computed using a source distance of 1.8 kpc (Zhang et al. 2005). Then, the mass of an equivalent homogeneous sphere of diameter , , has been obtained from (N2H+) assuming a N2H+ average abundance of 1.5 (Fontani et al. 2006). and are listed in Cols. 5 and 6 of Table 2, respectively. For N and S, we derive and , and and 0.05 pc, respectively. These values, together with a , suggest that both cores may be low-mass pre–stellar cores. On the other hand, as stated in Sect. 3.2, both N and S show lines broader than those typically observed in low-mass pre–stellar cores. We propose three possible scenarios about the nature of the two N2D+ condensations: (i) they represent the residual of the extended cold cloud in which the cluster of young stellar objects was formed, whose physical/chemical conditions have not been altered yet by the cluster members; (ii) they are a group of unresolved low-mass starless cores; (iii) they are single starless cores, which are either low- to intermediate-mass pre–stellar cores, or the seeds of future massive forming stars.
The first scenario is very unlikely for both N and S, since the N2D+ (3–2) line is expected to trace gas denser than cm-3, while the H2 volume densities measured in the pc-scale gas associated with high-mass star formation regions typically reach values no higher than cm-3. The third scenario is the most probable for S, while for N, which shows an elongated structure (see Fig. 1) indicative of possible multiple low-mass components, the second scenario is also possible. In fact, the shape of N resembles that of Oph A, a molecular clump with elongated shape, resolved into several low-mass starless cores (André et al. 2007). If so, the observed broad lines could be simply due to unresolved cores with diffent velocity. A detailed comparison between N and Oph A will be done in the forthcoming paper. However, it is also possible that N is, like S, a unique condensation, the observed structure being due to shaping by a powerful outflow associated with another cluster member. In fact, an outflow driven by the massive source C1 ( M⊙) has been detected observing the CO (2–1) line (this line is part of the large dataset obtained with the SMA that will be published in the forthcoming paper), and the red lobe is indeed detected at the edge of condensation N. If both N and S are single cores, what may cause the observed broad lines? The larger turbulence could be simply understood as the result of a high pressure environment (see e.g. McKee & Tan 2002). Despite of this, it is not at all clear which fraction of the line width is actually broadened by systematic motions, in particular infall or accretion of molecular material onto the pre-stellar cores. Only high resolution kinematic studies of the large scale gas around these condensations will give us clues on the line width partition, thus providing important constraints on the dynamical evolution of massive star forming regions.
| source | |||||
|---|---|---|---|---|---|
| (cm-2) | (cm-2) | (pc) | () | ||
| N | 1.9(0.6) | 2.1(0.3) | 0.11(0.04) | 0.09 | 8.7 |
| S | 1.5(0.5) | 1.6(0.3) | 0.11(0.04) | 0.05 | 2.5 |
It is a pleasure to thank the staff of the Smithsonian Astrophysical Observatory for the SMA observations. We also thank the IRAM staff for his help in the calibration of the PdBI data. Many thanks to the anonymous Referee for his/her useful comments and suggestions.
References
- André et al. (2007) André, Ph., Belloche, A., Motte, F., Peretto, N, 2007, A&A, 472, 519
- Beuther et al. (2007) Beuther, H., Churchwell, E.B., McKee, C.F., Tan, J.C. 2007, Protostars and Planets V, p. 165
- Caselli et al. (1995) Caselli, P., Myers, P.C., Thaddeus, P. 1995, ApJ, 455L, 77 ApJ, 523, L165
- Caselli et al. (2002a) Caselli, P., Walmsley C.M., Zucconi, A. et al. 2002a, ApJ, 565, 331
- Caselli et al. (2002b) Caselli, P., Walmsley C.M., Zucconi, A. et al. 2002b, ApJ, 565, 344
- (6) Crapsi, A., Caselli, P., Walmsley, C.M., et al. 2005, ApJ, 619, 379
- (7) Fontani, F., Caselli, P., Crapsi, A., et al. 2006, A&A, 460, 709
- Ho et al. (2004) Ho, P.T.P., Moran, J.M. & Lo K.Y. 2004, ApJ, 616, L1
- Kuiper et al. (1996) Kuiper, T.B.H., Langer, W.D., & Velusamy, T. 1996, ApJ, 468, 761
- McKee & Tan (2002) McKee, C.F. & Tan J.C. 2002, Nature, 416, 59
- (11) Molinari, S., Brand, J., Cesaroni, R., Palla, F. 1996, A&A, 308, 573
- (12) Oliveira, C. M., Hébrard, G., Howk, J. C., et al. 2003, ApJ, 587, 235
- (13) Pillai, T., Wyrowski, F., Hatchell, J., Gibb, A.G., Thompson, M.A. 2007, 467, 207
- (14) Qi, C. 2005, The MIR Cookbook (http://cfa-www.harvard.edu/ cqi/mircook.html)
- (15) Roberts, H. & Millar, T.J.007, A&A, 471, 849
- Sault et al (1995) Sault, R.J., Teuben, P.J. & Wright, M.C.H. 1995, ASPC, 77, 433
- (17) Sridharan, T.K., Beuther, H., Schilke, P., Menten, K.M., Wyrowski, F. 2002, ApJ, 566, 931
- Tafalla et al. (2002) Tafalla, M., Myers, P.C., Caselli, P., Walmsley, C.M., Comito, C. 2002, ApJ, 569, 815
- Tafalla et al. (2006) Tafalla, M., Santiago, J., Myers, et al. 2006, A&A, 455, 577
- (20) Zhang, Q., Hunter, T.R., Brand, J. et al. 2005, ApJ, 625, 864