Large-Amplitude Oscillation of an Erupting Filament as Seen in EUV, H and Microwave Observations
Abstract
We present multiwavelength observations of a large-amplitude oscillation of a polar crown filament on 15 October 2002, which has been reported by Isobe and Tripathi (Astron. Astrophys. 449, L17, 2006). The oscillation occurred during the slow rise ( 1 km s-1) of the filament. It completed three cycles before sudden acceleration and eruption. The oscillation and following eruption were clearly seen in observations recorded by the Extreme-Ultraviolet Imaging Telescope (EIT) onboard the Solar and Heliospheric Observatory (SOHO). The oscillation was seen only in a part of the filament, and it appears to be a standing oscillation rather than a propagating wave. The amplitudes of velocity and spatial displacement of the oscillation in the plane of the sky were about 5 km s-1 and 15,000 km, respectively. The period of oscillation was about two hours and did not change significantly during the oscillation. The oscillation was also observed in H by the Flare Monitoring Telescope at Hida Observatory. We determine the three-dimensional motion of the oscillation from the H wing images. The maximum line-of-sight velocity was estimated to be a few tens of km s-1, though the uncertainty is large owing to the lack of the line-profile information. Furthermore, we also identified the spatial displacement of the oscillation in 17 GHz microwave images from Nobeyama Radio Heliograph (NoRH). The filament oscillation seems to be triggered by magnetic reconnection between a filament barb and nearby emerging magnetic flux as was evident from the MDI magnetogram observations. No flare was observed to be associated with the onset of the oscillation. We also discuss possible implications of the oscillation as a diagnostic tool for the eruption mechanisms. We suggest that in the early phase of eruption a part of the filament lost its equilibrium first, while the remaining part was still in an equilibrium and oscillated.
keywords:
Prominences, Dynamics; Oscillations; Coronal Seismology1 Introduction
A variety of oscillatory motions of prominences and filaments have been observed and used to infer their structure and physical parameters (see the review by Ballester, 2006). In particular, global oscillations of filaments initiated by flare-associated disturbances (Ramsey and Smith, 1966) may provide useful information on the properties of filaments as oscillators, and hence on their stability.
Isobe and Tripathi (2006; hereafter paper I) reported an event in which a polar-crown filament exhibited large amplitude oscillation in its pre-eruptive slow rise phase. This event provides a rare opportunity to use so-called coronal seismology or prominence seismology in order to study the eruption mechanism of filaments. In paper I we reported that the oscillation repeated for about three cycles without any significant damping, until the onset of rapid acceleration and eruption of the filament. The period and the velocity amplitude measured in the plane of sky of the oscillation were about 2 hours and 4.2 km s-1, respectively. It was suggested that the large-amplitude oscillation in the filament was evidence for it retaining a non-linear stable equilibrium in its pre-eruptive, slow-rise phase. The transition from this equilibrium to eruption, i.e., loss of equilibrium (LOE) or instability, was triggered by rapid ( Alfvén time scale) mechanism such as magnetic reconnection.
In this paper we present further detailed analyses of this event using multiwavelength observations. In addition to the detection of the oscillation in extreme ultraviolet and H, we discovered that the oscillation was seen also in microwave. To the best of our knowledge, this is the first evidence of spatially resolved, large-amplitude oscillation of a filament in microwave imaging. One of the fundamental issues that remained unknown in paper I was the physical cause behind excitation of the oscillation. It is known that large amplitude filament oscillations are usually excited by flare-associated disturbances (see e.g., Ramsey and Smith, 1966; Eto et al., 2002; Jing et al., 2003, 2006; Okamoto et al., 2004; Vršnak et al., 2007). However, no flare associated with the onset of oscillation in this event was observed. In this paper we examine the magnetic-field data to study the mechanism of the excitation of the oscillation.
The paper is organized as follows: In Section 2 we briefly summarize the observational data. In Section 3 the oscillation seen in various wavelengths is presented. We discuss the possible excitation mechanisms responsible for the filament oscillation and their implication to eruption mechanisms in Section 4. Conclusions are summarized in Section 5.
2 Observations
The oscillation and subsequent eruption of a filament was observed on 15 October 2002. The filament was a large polar crown in the southern polar region. The oscillation was most clearly seen in 195 Å images taken by the Extreme-Ultraviolet Imaging Telescope (EIT; Delaboudinière et al., 1995) onboard the Solar and Heliospheric Observatory (SOHO). The cadence and spatial resolution of EIT are 12 minutes and 2.6 arcsec, respectively. The 195 Å passband of the EIT is dominated by an Fe xii line formed at 1 – 2 MK, but also contains an Fe xxii line at 192 Å formed at around 20 MK, which is usually much weaker in the quiet Sun region but highly significant in flaring active region (Tripathi et al., 2006). The filament (cold plasma in the corona) is seen as a dark feature due to absorption in the H i Lyman continuum (Kucera, Andretta and Poland, 1998; Engvold et al., 2001). We also used the line-of-sight magnetograms recorded by the Michelson Doppler Imager (MDI: Scherrer et al., 1995) onboard SOHO to study the photospheric magnetic-field configuration.
The filament oscillation was also observed by the Flare Monitoring Telescope (FMT) at Hida Observatory, Kyoto University. FMT observes the full disk of the Sun in five channels including H center and wings at Å with the time cadence of two seconds and a pixel sampling of 4.25 arcsec (Kurokawa et al., 1995). The advantage of FMT is its continuous, full disk observations in H wings. It has been used for the studies of transient and dynamic events such as filament oscillation (Eto et al., 2002; Okamoto et al., 2004), filament eruptions (Morimoto and Kurokawa, 2003b) and surges (Liu et al., 2005).
The spatial displacement associated with the oscillation was also identified in the microwave observation at 17 GHz from Nobeyama Radio Heliograph (NoRH; Nakajima et al., 1994). The advantage of microwave observation is that it is insensitive to temperature and velocity of filaments/prominences, i.e., the visibility of the filament does not change even when heating or motion of the filament occur. Hence the NoRH data have been used for the studies of prominence eruptions (Gopalswamy et al., 2003; Shimojo et al., 2006)
All of the images shown in this paper were rotated to the reference time of 06:00 UT to compensate for the effect of solar rotation. We used the DROT_MAP procedure in the Solar SoftWare to correct the rotation, and neglect the projection effect caused by the height of the filament above the photosphere.
3 Results
3.1 Oscillation and eruption as seen by EIT
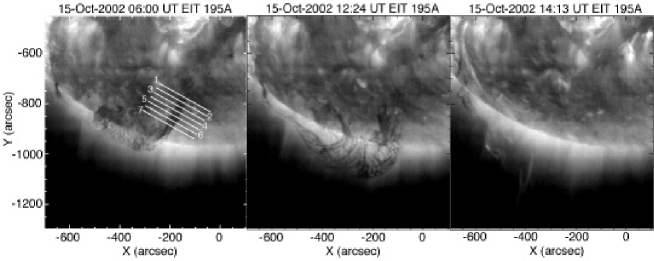
Figure 1 shows the EIT images of the filament during the oscillation (left), around the time of the onset of eruption (middle) and after the eruption (right). The and -axes are the distances from the disk center. Before the eruption, the eastern half ( arcsec) of the filament was seen above the limb. (Therefore, part of the filament was actually seen as a “prominence", though we use the term of “filament" to refer to the whole entity.) The western half ( arcsec) was seen as a dark filament on the disk. The apparent morphology of the filament is different between the eastern and western parts, likely because of projection effects. It seems that the eastern part is a vertical slab seen from the side, and the western part has similar structure but is seen from the top. After the eruption, brightenings at the eastern and western ends of the filament (right panel: []=[-650, -500] and [-100, -500]) are evident.
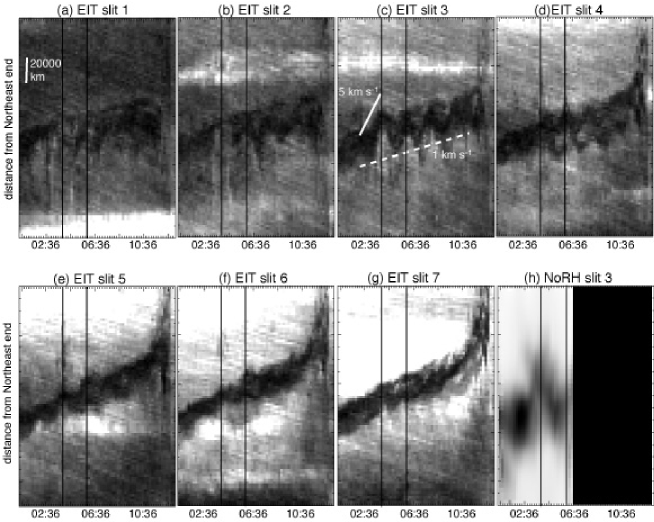
The oscillatory motion of the filament can be visualized by the temporal slices along the slits perpendicular to the filament. Figure 2 shows the temporal slices along seven different slits shown in the left panel of Figure 1. The right-bottom panel shows the time slice for slit three but for the microwave image; see Section 3.2. The oscillation starts at around 02:30 UT and completes three cycles with a period of about two hours. During the fourth cycle the filament is suddenly accelerated and erupted.
The oscillation is most prominent at slit three. The amplitude of the oscillation is smaller in the slits away from slit three in both directions and is almost unrecognizable in slit seven. The vertical black lines indicate the times of the first peak (04:00 UT) and the second peak (06:00 UT) as determined by visual inspection from the time slice of slit three. Although there are some ambiguities in determining the peaks, the oscillatory motion at the different slit position appears to be in the same phase. Therefore, the oscillatory motion can be interpreted as a standing oscillation. The amplitude of velocity and spatial displacement are about 5 km s-1 and 15,000 km, respectively. Note that, however, these values are measured in the plane of the sky.
In Paper I it was suggested that there may be an increase in the period based on the visual inspection of the time slices, although this was not conclusive. To study the change of period accurately, a wavelet analysis was performed on the EIT data; no substantial increase in the period was found (Pintér et al., 2007). This result has a significant influence on the diagnosis of the trigger mechanism for the filament eruption (see Section 4.3).
The remarkable point of this event is that the oscillation occurred while the filament is slowly rising toward the eruption. The slow rise motion is seen in Figure 2 as a general trend toward the southwest with a velocity of about 1 km s-1 (See also Figure 2 of paper I). Let us examine the effect of the correction of rotation on the velocity of the filament motion. As previously mentioned, we neglected the height of the filament when correcting the solar rotation. The error caused by this simplification is , where is the filament height and is the rotated angle. During the 12 hours in which we made the time slices, the photosphere at this latitude rotates about 5 – 6 degrees. If km, which seems reasonable, the error in terms of the velocity is about 0.25 km s-1 or less. Thus the error is smaller than the velocities of the slow rise and the oscillation.
3.2 NoRH and FMT observation of oscillation
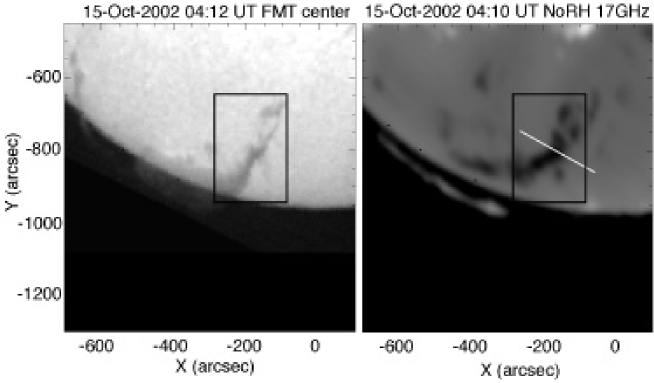
Figure 3 shows the H line center image from FMT (left panel) and the 17 GHz image from NoRH (right panel). Unfortunately the eruption occurred during the night for FMT and NoRH, but the first period of the oscillation was within the observation time of these instruments. The white line in the microwave image (right panel) shows the position of slit three shown in Figure 1 The time slice of this slit is shown in Figure 2 (panel h) which reveals a clear oscillatory motion.
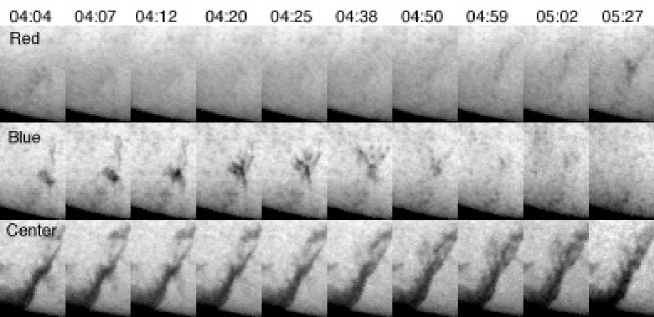
Figure 4 shows the time series of H images at line center and blue (-0.8 Å) and red (+0.8 Å) wings. The field of view is shown by the rectangle in Figure 3. The irregular time cadence is due to frequent interruptions by clouds. During 04:00 – 05:00 UT the filament appears in the blue wing images as a dark feature. The filament fades away in the blue wing around 05:00 UT, and then it appears in the red wing (05:02 and 05:27 UT). This is the well-known feature of oscillating filaments called “winking filament” (Hyder, 1966).
The three-dimensional velocity field can be inferred by comparing the H wing images and the motion in the plane of the sky. When the filament appears in the blue (red) wing, which means it is moving toward (away from) the Earth, it is moving toward Northeast (Southwest) in the plane of the sky (see Figure 2). Given that the filament is located near the southern limb of the Sun, if the direction of the oscillatory motion is vertical, the blue (red) shift should accompany southward (northward) motion. Since in this case the sense of oscillation appears to be opposite, we conclude that the oscillatory motion is horizontal. The contrast of the wing images is largest (i.e., the filament is dark) in the central area of the field of view, where the plane-of-the-sky velocity is also largest; see the position of slit 3 shown in the right panel of Figure 4. This is consistent with the interpretation as a standing oscillation.
The line-of-sight velocity of the filament can be inferred from the contrast in the wing images. Morimoto and Kurokawa (2003a) developed a method to determine the line-of-sight velocity from FMT data based on a cloud model. Using their method, we estimated the line-of-sight velocity of the oscillation to be about 20 – 30 km s-1 (see Paper I). This value depends on the line profile of the filament, which is unknown here (whereas in paper I we assumed a typical line profile presented in Morimoto and Kurokawa, 2003a). Therefore the uncertainty in the line-of-sight velocity is large.
4 Discussion
4.1 What is the trigger of the oscillation?
It is known that large-amplitude oscillations of filaments like this event are excited for flare-associated disturbances, such as Moreton waves (Ramsey and Smith, 1966; Eto et al., 2002), EIT waves (Okamoto et al., 2004), and nearby subflares (Jing et al., 2003, 2006). There was no observed flare or brightening associated with the present event that can account for the excitation of the oscillation. However, we identify an emerging flux region that may play a role in triggering the oscillation, and possibly in triggering the eruption as well.
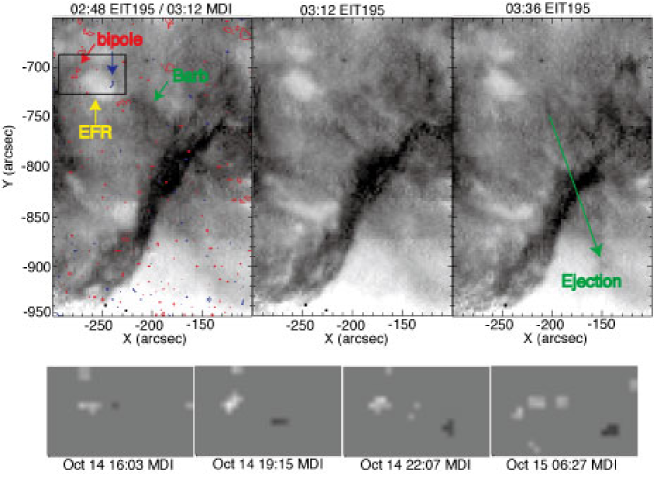
Figure 5 shows EIT images taken just before the onset of the oscillation. An MDI magnetogram taken at 03:12 UT is overlaid on the EIT image taken at 02:48 UT shown in the left panel. The blue and red contours correspond to +25 and -25 gauss, respectively. As indicated in the figure, there is a bipole whose opposite polarities are connected by a bright EUV loop. The lower panels of Figure 5 show temporal evolution of the magnetogram in the black box shown in the upper left panel. The bipole is already visible at 19:15 UT, October 14, and evolves with time as see in Figure 5. The separation of the two polarities is the characteristic of an emerging flux.
Also indicated in Figure 5 is a filament barb connected to the preexisting positive polarity region near the negative polarity of the emerging flux (02:48). This barb was seen for hours before the onset of oscillation. At 03:12 UT it suddenly disappears from the EIT images (see the middle panel of Figure 5) and a very faint jet-like ejection was seen at 03:36 UT toward the southwest. This ejection is co-temporal with the onset of oscillation and also co-spatial with the part of the filament where the amplitude of the oscillation is largest. We interpret these observations as follows. As the new flux emerged and expanded into the corona, it interacted with the filament barb and magnetic reconnection occurred. This reconnection produced the plasma ejection, which blew the filament from the side and excited the oscillation. We note that since we could not identify the polarity of the footpoint of the barb in the magnetogram, we do not know whether the direction of the magnetic field was favorable for reconnection or not. However, three-dimensional MHD simulations suggest that reconnection between an emerging flux and a coronal field can occur regardless of their mutual orientation, though the resultant dynamics and magnetic field configuration vary (Archontis et al., 2005; Galsgaard et al., 2007).
There was no brightenings in EIT images associated with the ejection, probably because the released energy is too small to brighten EUV or the reconnection occurred in the chromosphere. It is also possible that the time scale of brightening associated with the reconnection was shorter than the EIT cadence, and the brightening was not recorded by the EIT.
4.2 Internal structure of the filament
So far we considered the filament as a single entity. However, the filament has some internal structure, as seen in the EIT images in Figure 5. One can also see internal structure of the filament structure in Figure 3, which may indicate the presence of substructures that could be oscillating a little out of phase. Indeed, a movie of EIT images shows some motion along the filament. This is probably due to the direction of the perturbation that excited the oscillation (Jing et al., 2006; Vršnak et al., 2007). As indicated by the long arrow in Figure 5, the direction of the ejection that blows the filament was oblique to the filament axis, which possibly excited both lateral and longitudinal motions in the filament.
4.3 What is the implication for eruption mechanisms?
The large-amplitude oscillation occurred while the filament is slowly rising before eruption. Slow-rise motions before the fast acceleration and eruption have been commonly observed in various types of solar plasma ejections, such as filament eruption (Sterling and Moore, 2003, 2005; Chifor et al., 2006), X-ray plasmoid ejections (Ohyama and Shibata, 1997), and coronal mass ejections (Zhang et al., 2001). A fast-acceleration phase following the slow-rise phase has also been found in numerical simulations (e.g., Magara, Shibata, and Yokoyama, 1997; Chen and Shibata, 2000). The temporal evolution of the height of the ejecta seen in observations is similar to those in simulations where the ejecta already lost their stable equilibrium (for comparison of observation and simulation, see, e.g., Magara, Shibata, and Yokoyama, 1997; Sterling and Moore, 2005). This is suggestive of an initial growth of an instability or LOE as an explanation of the slow rise. Such slow rise usually lasts several tens of the Alfvén time of the system (i.e., time in which Alfvén waves travel across the system), typically seconds for active region events and several hours for quiet region filaments.
However, a slow rising motion of a filament that lasted much longer (period days) before its eruption has been reported by Nagashima et al.(2007). They interpreted the motion as a quasi-static evolution toward the critical height at which the filament lost its equilibrium (Forbes and Isenberg, 1991). The quasi-static evolution (a series of MHD equilibria) may be driven by photospheric motions (Forbes and Priest, 1995), an emerging flux (Lin, Forbes, and Isenberg, 2001), or continuous small scale reconnection in the lower atmosphere (Nagashima et al., 2007). This kind of slow rise is physically different from the former type, that is, initial growing phase of the LOE or instability.
The oscillation during the slow-rise phase provides strong evidence that the prominence retained its equilibrium during that time, which indicates that the slow rise found in our event is of the latter type: the quasi-static evolution before the LOE or instability sets in. However, our event also shows characteristics to those of the former type, the initial growing phase after the LOE or instability sets in. The height-time plot of the filament is quite similar to those of the former type; it shows a smooth transition from slow rise with constant velocity to the fast acceleration (see time slice for slit seven in Figure 3 and Figure 2 of Paper I). The duration of slow rise in our event ( 12 hours) seems quite long as that of the former type, but it is probably due to the long Alfvén time ( tow hours, see Paper I).
The oscillation continued until the onset of the fast acceleration. The amplitude of the oscillation was large; the displacement in the plane of the sky ( 20000 km) is as large as the width of the filament. Therefore, during the oscillation the equilibrium of the filament, or at least its oscillating part, was nonlinearly stable to the large perturbation. However, if the eruption occurs through the exchange of stability, we expect that the period of the oscillation becomes longer and longer as the system changes its equilibrium state and approaches the eruption. As mentioned in Section 3.1, the wavelet analysis showed no evidence for an increase in period (Pintér et al., 2007). Therefore it is unlikely that the slow rise is due to the change of the equilibrium state toward the critical point at which the LOE or instability sets in. Moreover, the transition from the nonlinearly stable equilibrium to eruption occurred within a period of the oscillation or, in other words, in the Alfvén time scale. We note that emerging flux and its reconnection with the filament barb that triggered the oscillation may have played a role in triggering the eruption, too (Feynman and Martin, 1995; Chen and Shibata, 2000; Lin, Forbes, and Isenberg, 2001; Tripathi, 2005).
However, the following question remains: Does the oscillation found in our event suggest that the similar slow rises found commonly in other events (Ohyama and Shibata, 1997, Zhang et al., 2001; Sterling and Moore, 2003, 2005; Chifor et al., 2006) also indicate quasi-static evolution, in contrast to the previous interpretation as the initial phase of LOE or instability? This may be the case, but here we propose another scenario.
We note that the oscillation occurred only in a part of the filament. The size of the oscillating part of the filament is about km (approximately the size of the box in Figure 3), whereas the size of the complete erupting filament is as large as the solar radius. In such a long filament, it is probably possible that the filament loses its equilibrium in a “global" sense, but a part of the filament still retains “local" equilibrium that can support “local" oscillation. Indeed, in many filament eruption events the whole filament does not erupt simultaneously, but often a part of the filament erupts first and the remaining parts seem to be dragged by the leading part (a process called “asymmetric eruption" by Tripathi, Isobe, and Mason, 2006. See also Isobe, Shibata, and Machida, 2002). Chifor et al.(2006) analyzed X-ray, EUV, and microwave brightenings of such an asymmetric eruption and found (i) that the filament started to rise from one end where an X-ray precursor was found, and (ii) there was a weak heating of the filament during the slow rise. They concluded that at first a part of the filament started to rise owing to the localized magnetic reconnection below the filament. Then the rise of the filament induced successive magnetic reconnection along the filament, and eventually the whole filament was destabilized and erupted (see also Chifor et al., 2007). This scenario naturally explain how a localized perturbation (such as an emerging flux) eventually leads to the destabilization of the whole filament.
We suggest that the observation presented in this paper further supports the model of Chifor et al., (2006). The oscillation in a part of the filament during the slow rise is evidence that that part of the filament still retained an equilibrium. However, the other nonoscillating part had already lost the equilibrium and started to rise, dragging the oscillating part. Thus the oscillating part was also forced rise, and eventually erupted along with the other parts of the prominence.
5 Conclusions
In this paper we presented the observations of a large amplitude oscillation of the polar crown filament in its pre-eruption, slowly rising phase. The oscillation was seen only in a part of the filament, and seems to be a standing oscillation rather than a propagating wave. The spatial displacement of the oscillation was also identified in 17 GHz microwave images from NoRH. Such an oscillation has not been reported during the more than ten years of NoRH observations (although we have not done a systematic survey for such events, so this does not mean that ours is the only such event), and we believe that this is the first observation of spatially resolved filament oscillation by microwave imaging.
In Contrast to previous observations of large-amplitude filament oscillations, there were no flares or even microflares associated with the excitation of the filament. However, we found that a filament barb connected near an emerging flux disappeared and seems to be ejected at the onset of the oscillation. We believe that reconnection between the emerging flux and the barb caused the ejection that blew the filament to excite the oscillation.
The large-amplitude oscillation occurred in the slow-rise phase of the filament, and only a part of the filament exhibited the oscillation. The oscillation is evidence that the oscillating part of the filament still retained a nonlinearly stable equilibrium during the slow rise. It supports the model by Chifor et al.(2006) that at first a part of filament loses equilibrium and starts to rise, and the slow rise induces LOE of the remaining part, leading to the destabilization of the whole filament.
Filament and prominence seismology is a powerful tool, not only for measuring the physical parameters, but also for diagnosing the stability and hence the trigger mechanism of filament eruption. It is worthwhile to search for more events in which filaments exhibit large-amplitude oscillation in their pre-eruption phase. From a theoretical point of view, there are many analytical and numerical models of pre-eruption filaments or flux ropes. Investigation of the behavior of these model filaments as oscillators may provide some physical insight into the mechanisms of filament eruptions.
\acknowledgementsname
We thank M. Shimojo for fruitful discussions. This work was supported in part by a Grant-in-Aid for Creative Scientific Research of the Ministry of Education, Culture, Sports, Science and Technology (MEXT) of Japan “The Basic Study of Space Weather Prediction" (17GS0208, K. Shibata, Principal Investigator). HI is supported by a Research Fellowship from the Japan Society for the Promotion of Science for Young Scientists. DT acknowledges the support from PPARC. RJ acknowledges The Nuffield Foundation (UK) for NUF-NAL 04 award.
References
- [2005] Archontis, V., Moreno-Insertis, F., Galsgaard, K., Hood, A.W.: 2005, Astrophys. J. 635, 1299.
- Ballester (2006) Ballester, J.L.: 2006, Phil. Trans. Roy. Soc. A 364, 405
- (2) Chen, P.F., Shibata, K.: 2000, Astrophys. J. 545, 524.
- (3) Chifor, C., Mason, H.E., Tripahi, D., Isobe, H., Asai, A.: 2006, Astron. Astrophys. 458, 965.
- (4) Chifor, C., Tripathi, D., Mason, H.E., Dennis, B.R.: 2007, Astron. Astrophys. 472, 967.
- (5) Delaboudiniere, J.-P. et al.: 1995, Solar Phys. 162, 291.
- (6) Engvold, O., Jakobsson, H., Tandberg-Hanssen, E., Gurman, J.B., Moses, D. 2001, Solar Phys. 202, 293.
- (7) Eto, S., Isobe, H., Narukage, N. et al.: PASJ200254481
- (8) Feynman, J., Martin, S.F.: 1995, J. Geophys. Res. 10, 3355.
- (9) Forbes, T.G., Isenberg, P.A.: 1991, Astrophys. J. 373, 294.
- (10) Forbes, T.G., Priest, E.R.: 1995, Astrophys. J. 446, 377.
- (11) Galsgaard, K., Archontis, V., Moreno-Insertis, F. Hood, A.W.: 2007, Astrophys. J. 666, 516.
- (12) Gopalswamy, N., Shimojo, M., Lu, W., Yashiro, S., Shibasaki, K., Howard, R.A.: 2003, Astrophys. J. 586, 562.
- (13) Hyder, C. L.: 1966, Zeit. Astrophys., 63, 78
- (14) Isobe, H., Shibata, K., Machida, S.: 2002, Geophys. Res. Lett., 29(21), 2014, doi:10.1029/2001GL013816
- (15) Isobe, H., Tripathi, D.: 2006, Astron. Astrophys. 449, L17.
- (16) Jing, J., Lee, J., Spirock, T.J., Wang, H.: 2006, Solar Phys. 236, 97.
- (17) Jing, J., Lee, J., Spirock, T.J., Xu, Y., Wang, H., Choe, G. S.: 2003, Astrophys. J. 584, L103.
- (18) Kucera, T.A., Andretta, V., Poland, A.I.: 1998, Solar Phys. 183, 107.
- (19) Kurokawa, H., Ishiura, K., Kimura, G. et al.: 1995, Geomagn. Geoelectr. 47, 1043
- (20) Lin, J., Forbes, T.G., Isenberg, P.A.: 2001, J. Geophys. Res. 106, 25053.
- (21) Liu, Y., Kurokawa, H., Kitai, R. Ueno, S., Su, J.T.: 2005, Solar Phys. 228, 149.
- (22) Magara, T., Shibata, K., Yokoyama, T.: 1997, Astrophys. J. 487, 437.
- (23) Morimoto, T., Kurokawa, H.: PASJ2003a55503
- (24) Morimoto, T., Kurokawa, H.: PASJ2003b551141
- (25) Nagashima, K., Isobe, H., Yokoyama, T., Ishii, T. T., Okamoto, T.J., Shibata, K.: 2007, Astrophys. J. 668, 533.
- (26) Nakajima, H. et al.: Proc. IEEE, 1994, 82, 705
- (27) Ohyama, M., Shibata, K.: PASJ199749249
- (28) Okamoto, T.J., Nakai, H., Keiyama, A., Narukage, N., UeNo, S., Kitai, R., Kurokawa, H., Shibata, K.: 2004, Astrophys. J. 608, 1124.
- (29) Pintér, B., Jain, R., Tripathi, D., Isobe, H. Astrophys. J. submitted.
- (30) Ramsey, H., Smith, S.F.: 1966, Astron. J., 71, 197
- Scherrer et al. (1995) Scherrer, P.H., et al., 1995, Solar Phys. 162, 129.
- (32) Shimojo, M., Yokoyama, T., Asai, A., Nakajima, H., Shibasaki, K.: PASJ20065885
- (33) Sterling, A.C., Moore, R.L.: 2003, Astrophys. J. 599, 1418.
- (34) Sterling, A.C., Moore, R.L.: 2005, Astrophys. J. 630, 1148.
- (35) Tripathi, D.: 2005, Ph.D. Thesis, University of Göttingen, Copernicus, GmBH, ISBN 3-936586-35-7
- (36) Tripathi, D., Del Zanna, G., Mason, H.E., Chifor, C.: 2006, Astron. Astrophys. 460, L53.
- (37) Tripathi, D., Isobe, H., Mason, H.E.: 2006, Astron. Astrophys. 453, 1111.
- (38) Vršnak, B., Veronig, A.M., Thalmann, J.K., Žic, T.: 2007, Astron. Astrophys. 295, 299.
- (39) Zhang, J., Dere, K.P., Howard, R.A., Kundu, M.R., White, S.M.: 2001, Astrophys. J. 559, 406.