The Shape of Cas A
Abstract
Based on optical, IR and X-ray studies of Cas A, we propose a geometry for the remnant based on a “jet-induced” scenario with significant systematic departures from axial symmetry. In this model, the main jet axis is oriented in the direction of strong blue-shifted motion at an angle of 110 - 120o East of North and about 40 - 50o to the East of the line of sight. Normal to this axis would be an expanding torus as predicted by jet-induced models. In the proposed geometry, iron-peak elements in the main jet-like flow could appear “beyond” the portions of the remnant rich in silicon by projection effects, not the effect of mixing. In the context of the proposed geometry, the displacement of the compact object from the kinematic center of the remnant at a position angle of 169o can be accommodated if the motion of the compact object is near to, but slightly off from, the direction of the main “jet” axis by of order 30o. In this model, the classical NE “jet,” the SW “counter-jet” and other protrusions, particularly the “hole” in the North, are non-asymmetric flows approximately in the equatorial plane, e.g., out through the perimeter of the expanding torus, rather than being associated with the main jet. We explore the spoke-like flow in the equatorial plane in terms of Rayleigh-Taylor, Richtmyer-Meshkov and Kelvin-Helmholz instabilities and illustrate these instabilities with a jet-induced simulation.
1 Introduction
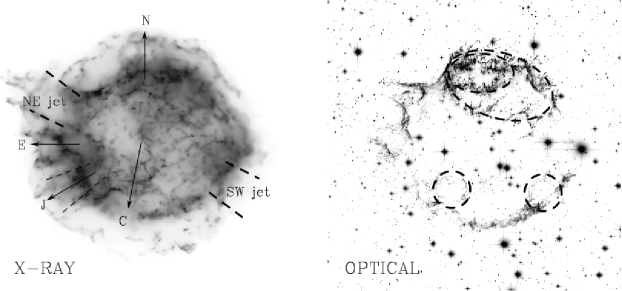
The star we now recognize as the supernova remnant Cassiopeia A probably exploded in 1680 (Thorstensen et al., 2001; Fesen et al., 2007). It has been an astrophysical mystery ever since its re-discovery by radio astronomers (Ryle & Smith, 1948) and has been the target of increasingly sophisticated studies over a range of wavelengths in the radio (Anderson et al., 1991; Keohane et al., 1996; Liszt & Lucas, 1999), optical (Fesen & Gunderson, 1996; Fesen, 2001; Fesen et al., 2001, 2006a, 2006b; Morse et al., 2004), IR (Krause et al., 2005; Ennis et al., 2006), and X-ray (Markert et al., 1983; Hughes et al., 2000; Willingale et al., 2002, 2003; Hwang et al., 2000, 2001, 2004; DeLaney et al., 2004; Laming et al., 2006). The projected image of Cas A shows a prominent jet-like structure in the NE and a “counter-jet” diametrically opposed in the SW. Other protrusions and interruptions in the images are notable in images at the various wavelengths. The first image taken with the Chandra Observatory dramatically revealed the long-sought compact object. This dim object has yet to be given a firm physical identification as a neutron star or black hole. The compact object is displaced from the kinematic center of the remnant (Fesen et al., 2006a) to the South, nearly perpendicular to the locus of the “jet/counter-jet” structure. X-ray studies of the remnant have led to the discovery that iron-rich regions lie beyond silicon-rich regions (Hughes et al., 2000), suggesting some sort of inversion of the expected “onion-skin” structure of the progenitor star. Fine-scale turbulence might mix the originally stratified composition and lead to Fe at larger radii than Si, but it is not clear that such a process can lead to a large scale segregation of the compositions, as the observations suggest.
Laming et al. (2006) consider the possibility that the NE/SW “jets” represent a spherical explosion into an inhomogeneous CSM with “cavities” so that expansion is faster into those cavities, as suggested by Blondin et al. (1996). They find that such a model cannot give a sufficiently high density of plasma at high enough temperature. The ejecta expand so rapidly that the density is too low either for appreciable electron-ion equilibration to raise the electron temperature or to sufficiently ionize the plasma as observed for the NE jet. Laming et al. consider a jet-induced model based on the calculations of Khokhlov et al. (1999) and find that such a model can provide the required conditions of ionization age and electron temperature for the collisional ionization equilibrium knots at the jet tip and the non-ionization equilibrium further back in the jet stream. Laming et al. argue that there should be a substantial amount of cold plasma at the “jet” head that has been cooled by radiative and adiabatic losses. This material could be composed of Fe, but is not necessarily so. Laming et al. note that the blast wave is not seen in the direction of the NE “jet.” The NE jet is thus not overdense compared to the stellar envelope, as it was for the jet-induced supernova models of Khokhlov et al. (1999) (see also Höflich, Khokhlov & Wang, 2001; Khokhlov & Höflich, 2001). Laming et al. find that the kinetic energy in the NE “jet” is a relatively modest ergs, perhaps insufficient to represent the major power source that caused the supernova explosion. This leaves open the basic physical mechanism of the explosion.
Hwang & Laming (2003) argue for an ejecta mass of about 2 M⊙ and a total mass of the star at the time of the explosion of about 3 M⊙. Chevalier & Oishi (2003) have made the case for a clumpy wind that may account for the quasi-stationary flocculi and that the explosion might have corresponded to a Type IIn or Type IIb supernova, in current typology. Young et al. (2006) argue that the progenitor was a star of 15 - 20 M⊙ on the main sequence that lost its hydrogen envelope to a binary companion and exploded with a mass of 4 - 6 M⊙.
Among the elements that must be explained to fully account for the shape of Cas A are:
-
•
A basic filametary morphology (Fig. 1a)
-
•
Quasi-stationary flocculi (Fesen, 2001)
-
•
Fast-moving knots of oxygen and their concentration at certain angles (Fesen et al., 2006b)
-
•
The appearance of “rings” at various parts of the perimeter (Fig. 1b)
-
•
The asymmetric distribution of mass (Willingale et al., 2003)
-
•
The distribution of silicon and other intermediate mass elements (Hwang et al., 2004)
- •
- •
- •
-
•
The location and direction of motion of the compact object (Fesen et al., 2006a)
-
•
The lack of a prominent pulsar wind nebula around the compact object (Fesen. Pavlov & Sanwal, 2006)
- •
-
•
The presence or absence of a companion star (Fesen. Pavlov & Sanwal, 2006)
As a step toward accounting for these properties we consider the physics and morphology implied by a “jet-induced” supernova model. The motivation for such a model has arisen in the context of recent developments in the study of the spectropolarimetry of core-collapse supernovae (Wang et al., 2003; Maund et al, 2007a, b, c; Wang & Wheeler, 2008) that show that core core collapse supernovae are routinely aspherical and frequently display a prominent axisymmetry. One obvious way to induce such an asymmetry is to explode the supernova with bi-polar jets (Khokhlov et al., 1999). Wheeler et al. (2007) point out that while bi-polar “jet-like” flow is common in core collapse supernovae, evidence for non-axisymmetric structure is also prominent. The presence of non-axisymmetric morphology is manifested as “loops” in the plane of the Stokes parameters Q and U. This non-axisymmetric structure was prominent in SN 1987A (Cropper et al., 1988) and is now recognized to be composition-dependent, with different species ejected in different directions. Deeper study of Cas A may help to inform our interpretation of the spectropolarimetric data and vice versa. A basic picture of a bi-polar explosion with significant non-axisymmetric flow may apply in general to core-collapse explosions. Here we explore whether such a picture can help to illuminate the morphology of Cas A.
2 Proposed Geometry
As an organizing principle, we will adopt here the ansatz that the explosion of Cas A was jet-induced without going into detail as to the physical origin of the jet(s). A basic jet-induced model has certain generic features: 1) principal high-velocity flow along an axis, presumably the rotational axis of the progenitor star and of the new-born compact remnant; 2) bow shocks generated by the jets, and a convergence of those bow shocks and associated flow onto the equator with 3) the subsequent expulsion of the bulk of the stellar core and mantle in a toroidal configuration (Khokhlov et al., 1999; Höflich, Khokhlov & Wang, 2001; Khokhlov & Höflich, 2001). For simple models in which the “up” and “down” jets are identical, the resulting fundamental geometry comprises a jet and torus structure. Here we will explore what orientation of this model, and what departures from its basic depiction, may account for the observed structure, kinematics, and composition distribution of Cas A. A key component of the jet-induced models is the distribution of the original “onion-skin” layers of the massive star progenitor (Höflich, Khokhlov & Wang, 2001; Khokhlov & Höflich, 2001; Maeda & Nomoto, 2003). One expects that the jet will be predominantly composed of iron-peak matter arising from deep within the progenitor. The bulk of the star, composed of the outer layers of Si, Ca, O, He, and perhaps some H, that surrounded the iron core will be compressed and expelled in the expanding equatorial torus.
If a jet/torus geometry pertains to Cas A, a principal question to ask is the direction of the main jet flow. Laming et al. (2006) have established that the the NE “jet” does represent a jet-like flow, but its rather feeble energy suggests that this may not be the principal axis of the explosion. We note that in the jet-induced model, the energy originally injected in a relatively narrow solid angle in the jets is redistributed throughout the stellar envelope. The amount of energy remaining in the original jet direction is model dependendent. Thus how measurements of energy and velocities in a given direction constrain models is not obvious. Markert et al. (1983) presented Einstein data that showed a substantial blue shift in the SE direction as projected on the sky, not along the classic NE “jet.” Hwang et al. (2001) and Willingale et al. (2002) presented the same feature in Chandra and XMM Newton X-ray Doppler shift maps. Willingale et al. (2003) identify a torus with an axis oriented approximately in this direction. Dewey et al. (2006) present another version of a Cas A X-ray Doppler map coupled with transverse proper motions from DeLaney et al. (2004) to yield a 3D map of a selection of X-ray emitting knots. This map (comprising only 17 points, but promising the richness to come) shows again that, as viewed from the top, normal to the line of sight, the major blue-shifted component is oriented at about 45o to the East (clockwise) from the line of sight to the observer, with a red shifted component at about 225o. From the observer’s point of view, the knots with highest blue shift form a rough “ring” with a rather large opening angle of 30o. This again suggests a major flow pattern at a projected position angle (counterclockwise from North on the plane of the sky) of about 125o as illustrated in Fig. 1a. This direction is also marked by a concentration of Fe that extends beyond the Si-rich material in that direction (Hughes et al., 2000; Hwang et al., 2004). Here we assume that the direction indicated by these observations represents the projected main axis of the jet in the jet/torus geometry. We suggest that the main jet axis is then oriented to the SE at a position angle of about 125o, roughly 40 - 50o to the East and 20 - 30o to the South with respect to the line of sight.
This geometry suggests an alternative explanation for the observation of iron-peak matter beyond the silicon-rich material (Hughes et al., 2000). Rather than a literal mixing of the matter through Rayleigh-Taylor or other processes, the apparent distribution of matter of different composition could be affected by projection effects. In particular, in the proposed geometry, the main jet would be iron rich. The equatorial flow would tend to be Si rich (also O and Ca rich). In this configuration, the iron in the jet in the SE direction approaching the observer would tend to be faster, but it would also appear to be “outside” the Si in the SE portion of the slower moving torus because of projection effects. This might give a natural explanation for the apparent “overturn” of the Fe compared to the Si, without requiring “overturn,” per se.
Because of entrainment effects there could be some high-velocity Si in the axial jet flow and some Fe in the equatorial flow. Note also that the initial energy in the jet will be dissipated throughout the mantle and envelope and that rapid flow in the direction of the jet could lead to adiabatic expansion and cooling so that a significant portion of the jet flow would be difficult to detect in current X-ray observations, as found for the NE “jet” by Laming et al. (2006).
3 The Compact Object
Fesen et al. (2006a) have shown that the position of the compact object in Cas A is located to the South at a position angle of o from the kinematic center of the explosion determined by tracing the proper motion of expanding optical emission knots (see Fig. 1a). This has posed a special puzzle for a picture in which the classic NE jet and SW counter-jet represented the principal axis of the explosion. One would then expect, on general grounds under the jet-induced ansatz, the motion of the compact object to be roughly along that axis. Instead the motion inferred by the displacement of the compact object from the kinematic center is nearly normal to the NE/SW axis. In the geometry proposed here, the PA of the compact object requires some, but only modest, misalignment from the main axis of the jet in the SE direction.
Consider the geometry of Cas A in spherical polar coordinates, with the observed position angles projected onto the plane of the sky. In spherical polar coordinates, let be the latitudinal angle, measured from East (counterclockwise) of North and be the longitudinal angle measured in the plane of the observer, such that is toward the observer and is in the opposite direction with increasing to the East (clockwise as viewed from the North). With unit vectors corresponding to the observer direction ( = 0o), East ( = 90o), and North, respectively, the position vectors of the jet (subscript J) and compact object (subscript C) are then:
| (1) |
| (2) |
The angle, , between the jet and compact object is given by:
| (3) |
such that
| (4) |
The observed position angle on the sky, , measured East of North (counterclockwise), is related to the latitudinal angle, , of the 3D model of Cas A by:
| (5) |
Equation 5 can be solved to give and in terms of and . When substituted into Eqn. 4, this gives as a function of :
| (6) |
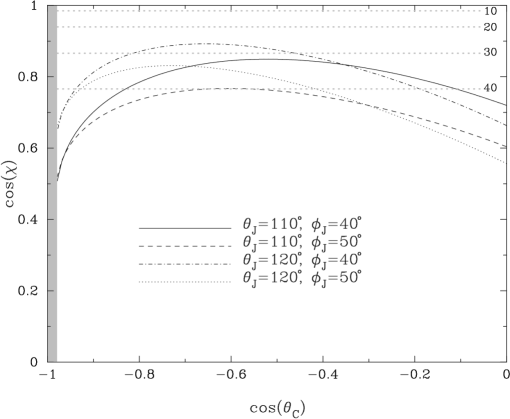
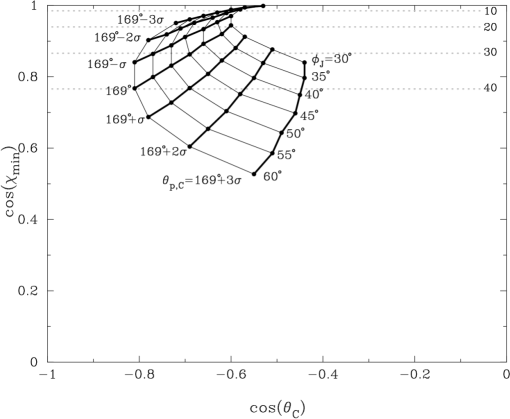
Figure 2 gives as a function of the unknown angle, , for a range of plausible values of and for the nominal value of the position angle of the compact object, . Note that is bounded on one side by motion essentially on the line of sight corresponding to = 90o for which = 0 and . On the other extreme the motion at the observed position angle could be in the plane of the sky corresponding to = 90o and , for which . While there are ranges of parameter space with large values of , there are clearly ranges that give a modest value, o. Fig. 2 shows that for a given choice of the jet angles, has a minimum at a specific value of . Figure 3 gives a plot of versus for o and a range of values of and .
Figures 2 and 3 show that while there are valid portions of parameter space for which the separation angle would be large, there is an ample and reasonable range of parameter space for which the direction of motion would be near to that of the proposed main jet. In particular, if the main axis of the jet is about 40 - 50o East and 20 - 30o South of the line of sight (o), then the motion of the compact object would only have to be of order 30o off the main axis of the jet to point at a projected position angle o. In this proposed geometry, the PA of the compact object would be nearly, if not exactly, aligned with the axis of the main SE jet and nearly orthogonal to the NE/SW “jet” axis. While this departure of the motion of the compact object from the principal axis requires further explanation, it is completely in keeping with the tilt of the rings in SN 1987A from the apparent axis of symmetry (Wang et al., 2002) and with the dispersion of proper motions of young pulsars from the axes of symmetry of their remnants Ng & Romani (2006), and perhaps with growing evidence from spectropolarimetry for “tilted-jet” models of core collapse wherein the jets defining bi-polar axes are not exactly aligned with the dominant geometry of the progenitor (Maund et al, 2007a, b, c).
4 Jets and Holes
What, then, are we to make of the classic NE “jet” and SW “counter-jet” structure? Beside these features, Cas A shows other evidence for “rings” and “holes” in optical imaging as spectacularly displayed in new HST ACS images as displayed in the Hubble Heritage collection (Fig. 1b; Fesen, private communication 2007; http://heritage.stsci.edu/2006/30/index.html) In particular, there is a prominent ring in the North (on the far side from the observer) and a smaller ring within that, suggesting the rims of “holes.” There are other smaller, but distinct, ring-like features in the SE and SW. Clearly, Cas A does not correspond to a simple axially-symmetric, jet-induced flow.
The outward flow and shocks involved in a supernova explosion are, in many circumstances, subject to Rayleigh-Taylor (RT) and Richtmyer-Meshkov (RM) instabilities. In addition, any hydrodynamic flow that is not strictly spherically symmetric will involve shear and the possibility of Kelvin-Helmholz (KH) instabilities. All such instabilities could contribute to the breakdown of strict axial symmetry. In the jet-induced models of Khokhlov et al. (1999) the jet was, in fact, subject to the KH instability, but the growth time was long compared to the propagation time out of the core, so the structure, although computed in full 3D, maintained the axisymmetric structure of the initial conditions despite the presence of the instability. Another way of breaking symmetry is to have axial jets of different strength. Khokhlov et al. (1999) computed two axial jets of identical nature, but discussed the possibility that the “up” and “down” jets could have different energy and momenta, with the difference in the momenta being delivered to the compact object in the form of a “kick.” This imbalance in jet properties could both break the mirror symmetry that was imposed in the calculations of Khokhlov et al. (1999) and cause a deviation of the directions of the jets and the recoil of the compact object, with possible implications for Cas A and other core collapse supernovae.
We thus also hypothesize that while the main jet and counter-jet that actually triggered the explosion of Cas A are to the SE/NW, the classical NE/SW “jet/counter-jet” structure and the northern “hole” are secondary effects resulting from instabilities in the equatorial plane of relatively modest energy ergs. In particular, we postulate that these features represent faster “spoke” or “finger” “jet-like” flow in the plane of the expanding torus due to various instabilities encountered by the expanding toroidal flow.
In the jet-induced model, the equatorial, toroidal component will inevitably be subject to KH instabilities as it propagates out into the mantle and envelope. The growth time is shorter for smaller wavelengths, but the shortest wavelengths will be suppressed by any restoring force as might be rendered by embedded magnetic fields. It is thus difficult to determine the characteristic scale of these streaming instabilities in the absence of an appropriate 3D numerical calculation. Hungerford et al. (2003) performed relevant 3D calculations with both jet-like and disk-like flow, but it is not clear that their SPH calculation had the resolution to see the KH instability and others to be discussed below. The KH instability will also accompany RT and RM instabilities. There may also be a coupling between the shear flow along the top and bottom faces of the expanding torus and the RT and RM instabilities that will be triggered along the outer rim of the torus. It may be that the KH instability is mostly responsible for entrainment, not the growth of spokes.
The equatorial, toroidal flow will also be subject to RT instabilities as the denser torus is decelerated by the less dense mantle and envelope of the star. The core is roughly an n = 3 polytrope. The torus expands with density decreasing roughly as if there is little increase in the vertical height. If the density profile in the core is steeper than , the torus will always tend to be denser than the mantle into which it expands. While the details will depend on the nature (density, energy, opening angle) of the axial jets, the calculation of Khokhlov et al. (1999) shows that the toroidal structure remains denser than the surrounding He core by about a factor of 3 as the torus comes to the edge of the helium core. The torus will be denser than any surrounding hydrogen envelope of essentially constant density. The torus will thus constantly be subject to RT instabilities as it propagates outward, depending on its heat content and capacity to do work, just as for the spherical expansion that has traditionally been studied in this context (Chevalier, 1976; Kifonidis et al., 2003, 2006).
While in the linear limit, small scales will grow faster by RT instability. In the non-linear limit the velocity of the growth of RT instabilities is given approximately by:
| (7) |
where a is the effective acceleration and L is the characteristic scale length (Youngs, 1986). At this stage, larger scales will grow faster. Laser-induced production of 3D RT instabilities has shown that RT fingers tend to form and grow at nearly the effective “free-fall” rate, the velocity of the interface before deceleration, in this case , the velocity of the expanding torus (Drake et al., 2004).
The characteristic length scale for the RT instability is often taken to be the pressure scale height in the star (Chevalier, 1976). Alternatively, the characteristic length scale for the RT structures may be the effective vertical height of the expanding torus. If so, the torus might tend to break up into fingers, where is the radius of the torus and its (full) thickness. The jet-induced models of Khokhlov et al. (1999) give an opening angle of 30o as the torus impinges on the outer helium core. This would give implying 5 or 6 “fingers” per hemisphere or 10 - 12 around the full perimeter of the torus. This is somewhat larger than, but perhaps in the ball park of, the number of “fingers” seen in Cas A. The most prominent fingers might be fewer than the total.
Equation 7 depends on the amplitude of the deceleration, which is itself a function of the density of the torus and the ambient medium into which it propagates. Invoking momentum conservation (neglecting the pressure within the torus as if it were already cold and expanding homologously) and expressing the effective acceleration as the ram pressure exerted by the mantle, divided by the mass per unit area of the torus that is decelerated in a given time, one can write:
| (8) |
where is the density of the mantle, is the density of the torus, is the velocity of the torus, and is the timescale of the growth of the RT structure. From Eqns. 7 and 8, we can write
| (9) |
and hence
| (10) |
giving
| (11) |
where and is the radius of the torus.
For the particular simulation of the core of a 15 M⊙ star of Khokhlov et al. (1999), the torus hits the edge of the helium core of radius cm in 35 seconds and hence has a mean velocity of km s-1. The torus has a density about 3 times that of the mantle so the acceleration that drives the RT instability at that point will be cm s-2 and the growth rate of the fingers will be . The latter result suggests that the RT fingers might not have reached the saturation limit at this epoch. Note that if the fingers grow at the rate of motion of the interface, (Drake et al., 2004), then they could develop 3 times faster.
The RM instability occurs when shocks propagate down density gradients and especially when shocks encounter density discontinuities, such as found at composition boundaries in massive stellar cores. For the cores of stars that were the likely progenitor of Cas A, these are the Fe/Si boundary, the Si/O boundary, the C-O/He boundary, and the He/H boundary, if any (Kifonidis et al., 2003, 2006). For perturbations of initially small amplitude, , of characteristic length, L, the growth rate for RM instabilities is:
| (12) |
where A is the Atwood number, (Youngs, 1986). At the boundary of the helium core, where 1/2 then for .
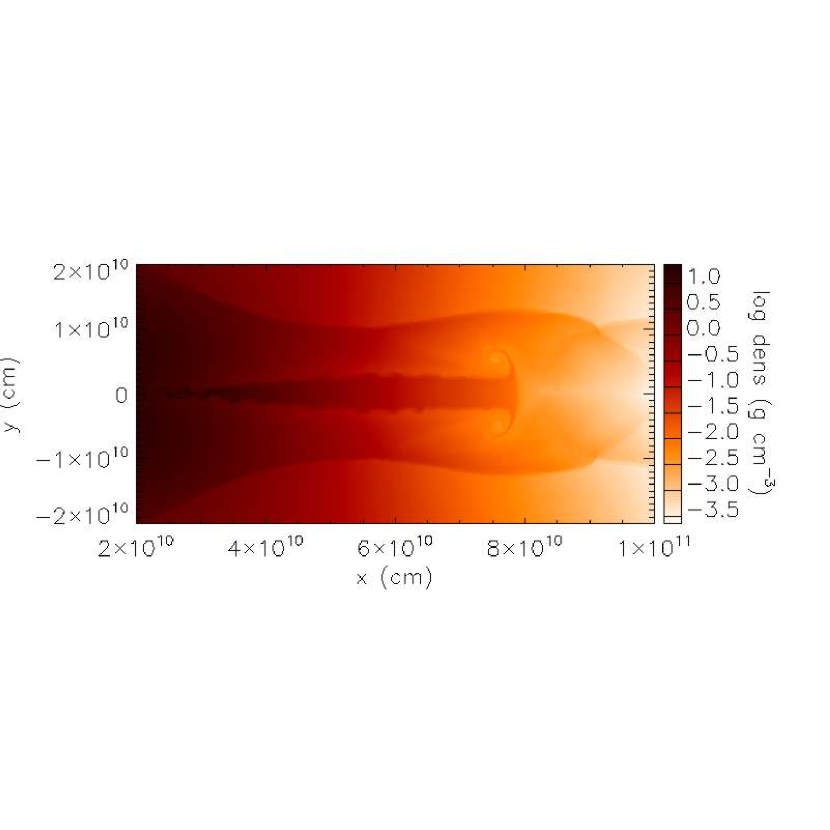
To illustrate the capacity of a jet-induced model to produce this variety of instabilities (if not literally the structure of Cas A), we show in Figure 4 the result of a two-dimensional simulation of equal and opposite jets propagating from the center of a helium star. The progenitor model was the 3.5 M⊙ core remaining from the evolution of a star of 10 M⊙ (Woosley et al., 1995). The jets were introduced as an inflow boundary condition at the inner radial coordinate of 3.82 cm with an opening angle of about 25o. The jet density, pressure and injection velocity rise linearly to maximum values of 6.5 g cm-3, ergs cm-3 and 3.22 cm s-1, respectively, over the course of 0.05 seconds. After about 0.5 seconds, the jet injection velocity is linearly reduced to zero in about 1.5 seconds. These parameters were chosen so as to deliver a total energy of ergs to the star (one-half that energy in each jet). The mass interior to the lower boundary, 1.593M⊙, was included as a point mass source of gravitation. The self-gravity of the remaining portion of the star was neglected. These conditions were intended to approximately reproduce those of Khokhlov et al. (1999).
The resulting dynamics were computed using the FLASH code (Fryxell et al., 2000). We used a grid in spherical coordinates with eight levels of refinement in both radius and angle. The maximum effective number of angular zones is 1024 and the maximum number of radial zones is 8192. This gives a minimum resolution in radius of cm and in angle of 0.175o(corresponding to cm at R = cm). This compares to the simulation of Khokhlov et al. (1999) that had a minimum resolution of cm near the inner boundary that degraded in the Cartesian grid of that simulation to cm at the outer boundary (). Our maximum resolution remains constant in radius and our angular resolution is higher throughout the simulation compared to that of Khokhlov et al. (1999). The instabilities that set in at larger radius are thus better resolved.
Figure 4 shows the results after 47 seconds with the jets in the vertical directions. The leading shock induced by the jets has propagated out of the star (initial radius cm) and off the grid ( cm). The effect of the jets in the inner core have “healed” due to transverse pressure gradients. The remnants of the passage of the jets can still be seen in the outer triangular regions at a radius of cm. The effects of instabilities are plainly seen. The RM instabilities and associated KH instabilities induced as the jet shock propagated across the Si/O boundary are seen in the “cap” at about cm. The horizontal structure is in the equatorial plane and results from the convergence of the jet-induced blast waves on the equator. KH rippling is seen at about cm and an RM/KH “mushroom” is seen on the leading edge of the toroidal structure at about cm. All this structure would be different for 3D (the small extensions right on the computational axis at cm are surely artificial) and with a true, rather than numerically generated, Reynold’s number in the flow, but the basic presence of the instabilities is well illustrated. We note that while a plausible, but arbitrary, perturbation must be added to induce RM and RT growth in a spherical model (Kifonidis et al., 2006), a jet-induced model, by assumption, represents a large asymmetric “perturbation,” leading to “natural” and significant instabilities. Details of this simulation will be presented elsewhere.
The RT and RM (and KH for that matter) instabilities tend to lead to mixing in the non-linear limit. If we want to explain “fingers” in Cas A, then it may be necessary for the fingers to break out of the star before that turbulent, non-linear limit is reached, although finer scale structure might be related to the fast-moving knots. The analysis given above (Eqns 8 - 11) suggests that might be the case for the RT instability; that the RT fingers have not reached saturation before the explosion leaves the helium core. The RM instabilities may grow faster locally at the composition discontinuities, but it is not clear in the absence of an appropriate simulation how this will interact with the RT structure. Limitation of the non-linear turbulence might be aided by the fact that the progenitor star had lost most or all of its hydrogen envelope and hence was something similar to a bare helium core. Figure 4, which is not yet in homologous expansion, hints that some of this structure may survive.
We note that in the proposed picture the toroidal flow and “fingers” should be composed of elements such as Si, Ca, O, and should be relatively devoid of iron-peak matter. This might agree with the high-velocity oxygen-rich knot structure of Fesen et al. (2006b) and the relative paucity of Fe in the direction of the NE “jet” observed in the X-ray. Once again, we note that especially fast moving matter in the “fingers” may undergo adiabatic expansion and cooling so that the bulk of it may be hard to detect.
If there are equatorial “fingers” of faster flow, this flow may also drive lateral pressure waves piling up matter on the “walls.” These walls might thus be denser and that higher density might inhibit the flow adjacent to the primary flow in the finger. This might account for the marked gaps in the flow pattern reported by Fesen et al. (2006b).
Another way to induce RT instabilties is to accelerate denser material by lighter material. This might occur if there is a later injection of energy from the new-born neutron star into the previously exploded and expanding material. There are a variety of mechanisms that might provide a somewhat delayed input of energy into increasingly less dense matter surrounding a new-born neutron star.
Wheeler & Akiyama (2007) have pointed out that non-axisymmetric instabilities in rapidly rotating neutron stars are likely to generate a strong magnetoacoustic flux. This flux would push on the inside of the expanding torus produced by a previous phase of MHD jets that propagated up the rotation axis. The resulting interaction might produce RT instabilities. Wheeler & Akiyama (2007) note that this process is likely to be amplified by the deleptonization, contraction and spin-up of the proto-neutron star on the timescale on which the radius contracts, of order 0.1 - 1 s. It is not clear how any such magnetoacoustic flux would be propagated: some might go up the rotation axis, but a substantial portion might go out the equatorial plane, directly accelerating the postulated expanding torus from within.
At somewhat later phases, after the neutron star has shrunk to its final radius, km, it will continue to cool by neutrino emission for another 10 - 100s, the (other) Kelvin-Helmholtz timescale. During this phase the neutron star may emit a neutrino-driven wind (Qian & Woosley, 1996). Toward the end of this phase, as the density declines in the vicinity of the neutron star, the flow may become magnetically-dominated, thus resulting in a relativistic wind flow (Bucciantini et al., 2006, 2007) (see also Thompson et al., 2004; Metzger et al., 2007). Bucciantini et al. (2007) note that this sort of flow seems to naturally occur in the equatorial plane. This work does not account for the fact that the supernova ejecta will not have dispersed on the relevant timescales and thus will present a different outer boundary condition - a working surface - than that assumed in the numerical models as discussed by Komissarov & Barkov (2007). Nevertheless, there is a suggestion for a natural tendency for an original MHD jet flow up the axis to evolve to an equatorial flow at later times driven by a pulsar wind. The characteristic timescale, 10 - 100 s is roughly the time it takes for the original shock, 10 s, and the torus, somewhat slower, to propagate to the edge of a helium core. Thus, at about the time this jet/torus structure breaks out of the core, there might be a strong, relativistic, equatorial pulsar wind that begins to accelerate the jet-induced torus from within. The low densities associated with this late-time fast wind will naturally lead to RT instabilities as the slower, denser torus is accelerated from within by the pulsar wind. We argue that such a wind should be expelled into structure roughly similar to Figure 4.
In effectively free-streaming calculations, Bucciantini et al. (2007) find that their numerical models give essentially the same asymptotic solutions as analytic solutions with the energy scaling like . This would mean that half the energy is directed within a half-angle of o. This energy distribution is wider than the torii computed here and by Khokhlov et al. (1999), but an appropriate calculation must consider the interior of the supernova as the appropriate “outer” boundary condition. This might lead to a more confined equatorial flow. Bucciantini et al. (2007) also note a tendency to form “plasmoids” with characteristic angles of 5 - 10o. Such structures might see RT instabilities and give somewhere of order 20 - 40 “fingers.” The calculations of Bucciantini et al. (2007) were done for a magnetar-like case and the results for the density and Lorentz factor of the pulsar wind will depend on the specific magnetization and inner boundary condition, but the principles should apply to both pulsars and magnetars. We note that arguments have been made that the compact object in Cas A is a magnetar, but also that there is no current obvious evidence for a pulsar wind (Fesen. Pavlov & Sanwal, 2006; Krause et al., 2005).
5 Discussion and Conclusions
Despite attempts to deconvolve the three-dimensional structure, the interpretation of the kinematics, dynamics, and morphology of Cas A remains difficult. We adopt a jet-induced structure as an organizing principle to frame the analysis of observations and to provide a model to test. We suggest that Cas A exploded from a jet-like mechanism, but that, unlike many interpretations, the main jet is not the well-known NE “jet.” We argue that a structure to the SE with a position angle of o represents the main jet. This feature is less immediately discernable because of projection effects, but is suggested in Doppler maps. It is also iron rich. In the jet-induced model, the bulk of the ejecta, the intermediate-mass elements, should be ejected in an equatorial torus (for jets of equal and opposite momentum) that results from the convergence of blast waves on the equator. We interpret the NE “jet” and other structure as flows that are roughly normal to the main SE jet that result from non-axisymmetric structure in the equatorial plane of the jet. This structure may resolve one of the current mysteries of Cas A, that the proper motion of the compact object seems to be nearly normal to the principle axis of the dynamics. In our proposed morphology, the compact object has been “kicked” at an angle o to that of the main jet. The proposed picture also opens the way for a new interpretation of chemical structure, especially the fact that iron is seen beyond silicon: this observation may be significantly affected by projection effects, rather than resulting from true “mixing” of the ejecta.
There have been hints of the geometry we propose here in previous discussions of Cas A. Markert et al. (1983) proposed an inclined ring model (their Figure 5), but their solution was a ring with its axis virtually along the line of sight. To account for the SE feature, they invoked non-uniform emissivity around the perimeter of the ring. The ring may have non-uniform emissivity, but their particular solution does not account for why this SE feature is iron-rich, and does not seem to be quantitatively consistent with subsequent work. Willingale et al. (2002) used XMM Newton composition and Doppler data to do a 3D deconvolution, presenting a proposed side view from the East (their Figure 11). They remark that the data is well characterized by the doughnut shape suggested by Markert et al. (1983), but their side view seems to show the axis of the torus tilted at about 45o to the line of sight, rather than the 87o advocated by Markert et al. (1983). With the spatial resolution available, the projection of Willingale et al. (2002) shows no particular evidence of the NE jet. Willingale et al. (2003) propose a clumpy toroidal geometry in which the axis of the toroid is oriented 40o East of the line of sight and 125o (counterclockwise) to the South of North, essentially the same as we have chosen here. Along this torus they identify concentrations of mass and energy on opposing sides to the “North” and “South” that are near to, but not quite the same as North and South on the plane of the sky (see their Figure 4 for the coordinate system they define). They refer to these concentrations of mass and energy as “jets” but do not relate them to the Doppler feature in the SE discussed by Willingale et al. (2002), and they are distinctly not the directions of the classic NE and SW jets. It is also not quite clear how this torus relates to the deconvolution given by Willingale et al. (2002). Willingale et al. (2003) suggest that the torus they identify may be the shell of matter ejected by a progenitor Wolf-Rayet star. Here we raise the possibility that the torus is that produced by a jet-induced explosion. The mass map presented by Willingale et al. (2003) does not show any special evidence for the iron-rich mass in the SE that we identify as the main direction of the jet axis. This may be related to the fact that the hot iron moving along the jet axis has relatively little mass. Like Willingale et al. (2003), we have no immediate explanation for the asymmetric distribution of mass around the perimeter of this torus, but propose that this is related to the instabilities and non-axisymmetric flows normal to the jet axis that we have discussed here, rather than “jets” per se. Willingale et al. (2003) point out that the apparent asymmetry of the explosion might suggest shear and hence turbulence and clumpiness intrinsic to the ejecta without needing a collision with an external medium. We have illustrated just this sort of effect in Figure 4.
Krause et al. (2005) have provided another interesting and mysterious aspect concerning the nature of Cas A. They have identified an apparent bi-polar flow and associated infrared echoes. Their preferred orientation is a position angle of about 26o at an angle of about 82o to the line of sight, nearly in the plane of the sky. This angle differs from every other geometric feature discussed in this paper. Krause et al. (2005) suggest that Cas A contains a magnetar that had a soft gamma-ray repeater outburst circa 1952. There is no sign of a Crab-like synchrotron nebula, which is also an issue for our suggestion that a pulsar wind might play a role in shaping the ejecta. The energy injected by a soft gamma-ray repeater burst is rather small compared to a supernova kinetic energy, but such a burst of energy might affect portions of the ejecta, enhancing previous irregularities. It would be interesting to look for other possible indications of such a magnetar burst. We note that the ionization ages identified by Willingale et al. (2003) are on the scale of a century or less.
Burrows et al. (2005) proposed that the main axis of the explosion of Cas A is that associated with the “iron-rich, mass-rich, energy-rich” SE direction and that this direction be a rotation axis. They speculate that the rotation axis precessed from the generation of the main jet to the generation of the later, secondary flow associated with the NE jet, or that the latter could be a magnetic dipole axis (although a magnetic axis would be expected to rotate in direction at the pulsar period if tilted with respect to the rotation axis). Burrows et al. (2005) argue that the inferred direction of motion of the central object is along the proposed axis of explosion with an inferred blue-shift. We have made the specific proposal of a displacment of the line of motion of the compact object by 30o from the axis of the main jet. Burrows et al. (2005) suggest that the motion of the compact object could be due to a slightly top-bottom asymmetric bi-polar flow. Janka et al. (2005) also suggest that the NE jet is induced after the main explosion, perhaps due to accretion onto the neutron star. Here we propose that there is an explicit jet/torus structure of to Cas A, and agree with the general suggestions of Burrows et al. (2005) and Janka et al. (2005) that the NE jet is some form of secondary flow, caused by the complex interaction of the jets or by the late-time effect of a pulsar wind, or perhaps repeated soft gamma-ray repeater outbursts.
To produce a robust explosion, the main explosion engine should involve ergs. Even if this energy begins in jets, it is spread through a large solid angle by subsequent dynamical interaction with the surrounding progenitor star. Thus it is not clear how much energy should be directed along the main axis once free expansion is attained. This can be quantified by suitable models. It remains to be seen whether an analyis of the SE structure similar to that done by Laming et al. (2006) will reveal a sufficiently large kinetic energy in the SE to be consistent with a jet in that direction being the primary origin of the explosion. The evidence that only ergs is involved in the NE jet is consistent with that being only a secondary effect. It is also important to determine the extent to which projection of an iron-rich SE jet on a silicon-rich equatorial flow can quantitatively account for the observed apparent composition inversion.
An important aspect of this model is that the non-axisymmetric structure arises from instabilities in or near the equatorial plane. We have sketched possible instabilities, including the effects of a pulsar wind. Three-dimensional hydrodynamics calculations or even pehaps MHD calculations (Stone & Gardiner, 2007) are required to determine whether or not the structure of Cas A can arise in a natural and physically self-consistent way from a jet-induced model. Such a model would have to yield a plausible explanation of transverse velocities up to 14,000 km s-1 in the direction of the NE jet (Fesen et al., 2006b) in contrast to transverse velocities of 8,000 km s-1 along the SE structure (the radial velocities in both of these directions are more modest; Willingale et al. (2002)). We note that this high velocity in the NE direction may be an indication that this is a secondary flow, perhaps driven by a pulsar wind, invoking once again the notion that the original jet energy must be dissipated throughout the ejecta to cause the explosion. A separate injection of energy may be necessary to blow holes in the original ejecta, accelerate some regions to high velocity and produce fast moving knots. Fesen et al. (2006b) note that the NE jet is like a “spray” of ejecta knots rather than a narrow jet. That might be an important clue to the underlying process.
There is no model today that accounts for the nature of Cas A. The positive aspects of the model we present here are that it roughly accounts for the iron-rich SE structure, the extension of iron beyond silicon in that direction, and the motion of the compact object in nearly that direction. On the negative side, there is much structure in Cas A that remains unexplained. Our model gives no natural explanation for why the NE jet and SE counter-jet seem so nicely and oppositely aligned, a problem for any model in which these are secondary flows. It may also be the case that the structure seen in Cas A might be generated in the absence of a jet-induced origin. This has certainly not been demonstrated. It may also be true that the NE jet defines a symmetry axis and the compact object has been kicked at some oblique angle due to equatorial instabilities, but such a theory would also require elaboration.
An important aspect going forward is to compare models with observations. For our model we predict: a) there is enough mass and kinetic energy in the SE and NW directions to account for the explosion (some of this matter may be fast, cool and difficult to directly observe; much of the originally directed energy has spread throughout the ejecta); b) there is high-velocity iron extending to large distances in the SE (in front) and NW (in back); c) the 3D structure and kinematics should show an expanding toroidal structure, roughly normal to the SE direction we have defined here, consistent with the energy deposited in the progenitor star by the jet-induced blast waves; d) the intermediate mass elements are concentrated in this torus; e) the apparent “overturn” that places iron beyond silicon in the plane of the observer is largely due to differentiated, composition-dependent, bulk flow, not mixing due to turbulence; f) the compact object is moving toward us; g) the “holes” in the remnant caused by secondary flow, including the NE and SW jets, are the locus of faster moving material; h) the walls defining the holes are in transverse motion; the holes should be getting larger. We urge those analyzing the data on Cas A to put these predictions to the test in order to more deeply understand this remarkable explosion. The structure to the SE (and NW) and the torus defined by Willingale et al. (2003), in particular, warrant much more detailed study. We need to better understand the kinematic and dynamical relation between the SE feature, the NE/SW “jets,” and this torus and to know whether the torus is more consistent with a pre-existing shell or a structure created by the supernova.
References
- Anderson et al. (1991) Anderson, M., Rudnick, L., Leppik, P., Perley, R., & Braun, R. 1991, ApJ, 373, 146
- Blondin et al. (1996) Blondin, J. M., Lundqvist, P., & Chevalier, R. A. 1996, ApJ, 472, 257
- Bucciantini et al. (2006) Bucciantini, N., Thompson, T. A., Arons, J., Quataert, E., & Del Zanna, L. 2006, MNRAS, 368, 1717
- Bucciantini et al. (2007) Bucciantini, et al. 2007, ArXiv Astrophysics e-prints, arXiv:astro-ph/0701578
- Burrows et al. (2005) Burrows, A., Walder, R., Ott, C. D. & Livne, E. 2005, ASP Conference Series, 332, 350
- Chevalier (1976) Chevalier, R. A. 1976, ApJ, 207, 872
- Chevalier & Oishi (2003) Chevalier, R. A., & Oishi, J. 2003, ApJ, 593, L23
- Cropper et al. (1988) Cropper, M., Bailey, J., McCowage, J., Cannon, R. D., & Couch, W. J. 1988, MNRAS, 231, 695
- DeLaney et al. (2004) DeLaney, T., Rudnick, L., Fesen, R. A., Jones, T. W., Petre, R., & Morse, J. A. 2004, ApJ, 613, 343
- Dewey et al. (2006) Dewey, D., DeLaney, T., & Lazendic, J. S. 2006, ArXiv Astrophysics e-prints, arXiv:astro-ph/0611908
- Drake et al. (2004) Drake, R. P., Leibrandt, E. C., Kuranz, C. C., Blackburn, M., Robey, H. F., Remington, B. A., Edwards, M. J. Miles, A. R., Perry, T. S., Wallace, R. J., Louis, H., Knauer, J. P., & Arnett, D. 2004, Physics of Plasmas, 11, 1.
- Ennis et al. (2006) Ennis, J. A., Rudnick, ., Reach, W. T., Smith, J. D., Rho, J., DeLaney, T., Gomez, H., & Kozasa, T. 2006, ApJ, 652, 376
- Fesen & Gunderson (1996) Fesen, R. A., & Gunderson, K. S. 1996, ApJ, 470, 967
- Fesen (2001) Fesen, R. A. 2001 ApJS, 133, 161
- Fesen et al. (2001) Fesen, R. A., Morse, J. A., Chevalier, R. A., Borkowski, K. J., Gerardy, C. L., Lawrence, S. S., & van den Bergh, S. 2001, AJ, 122, 2644
- Fesen. Pavlov & Sanwal (2006) Fesen, R. A., Pavlov, G. G., & Sanwal, D. 2006, ApJ, 636, 848
- Fesen et al. (2006a) Fesen, R. A., et al. 2006, ApJ, 636, 859
- Fesen et al. (2006b) Fesen, R. A., et al. 2006, ApJ, 645, 283
- Fesen et al. (2007) Fesen, R. A., et al. 2007, ApJ, in press, astro-ph/0603371
- Fryxell et al. (2000) Fryxell, B., et al. 2000, ApJS, 131, 273
- Höflich, Khokhlov & Wang (2001) Höflich, P., Khokhlov, A., & Wang, L. 2001, in Proc. of the 20th Texas Symposium on Relativistic Astrophysics, eds. J. C. Wheeler & H. Martel (New York: AIP)
- Hungerford et al. (2003) Hungerford, A. L., Fryer, C. L., & Warren, M. S. 2003, ApJ, 594, 390
- Hughes et al. (2000) Hughes, J. P., Rakowski, C. E., Burrows, D. N., & Slane, P. O. 2000, ApJ, 528, L109
- Hwang et al. (2000) Hwang, U., Holt, S. S., & Petre, R. 2000, ApJ, 537, L119
- Hwang et al. (2001) Hwang, U., Szymkowiak, A. E., Petre, R., & Holt, S. S. 2001, ApJ, 560, L175
- Hwang & Laming (2003) Hwang, U., & Laming, J. M. 2003, ApJ, 597, 362
- Hwang et al. (2004) Hwang, U., et al. 2004, ApJ, 615, L117
- Janka et al. (2005) Janka, H.-Th., Scheck, L. Kifonidis, K., Müller, E. & Plewa, T. 2005, ASP Conference Series, 332, 363
- Keohane et al. (1996) Keohane, J. W., Rudnick, L., & Anderson, M. C. 1996, ApJ, 466, 309
- Khokhlov et al. (1999) Khokhlov, A. M., Höflich, P., Oran, E. S., Wheeler, J. C., Wang, L., & Chtchelkanova, A. Yu. 1999, ApJ, 524, L107
- Khokhlov & Höflich (2001) Khokhlov, A. & Höflich, P. 2001, in AIP Conf. Proc. No. 556, Explosive Phenomena in Astrophysical Compact Objects, eds. H.-Y, Chang, C.-H., Lee, & M. Rho (New York: AIP), 301
- Kifonidis et al. (2003) Kifonidis, K., Plewa, T., Janka, H.-T., Müller, E. 2003, A&A, 408, 621
- Kifonidis et al. (2006) Kifonidis, K., Plewa, T., Scheck, L., Janka, H.-T., Müller, E. 2006, A&A, 453, 661
- Komissarov & Barkov (2007) Komissarov, S. & Barkov, M. 2007, MNRAS, in press
- Krause et al. (2005) Krause, O., et al. 2005, Science, 308, 1604
- Laming et al. (2006) Laming, J. M., Hwang, U., Radics, B., Lekli, G., & Takács, E. 2006, ApJ, 644, 260
- Liszt & Lucas (1999) Liszt, H., & Lucas, R. 1999, A&A, 347, 258
- Maeda & Nomoto (2003) Maeda, K., & Nomoto, K. 2003, ApJ, 598, 1163
- Markert et al. (1983) Markert, T. H., Clark, G. W., Winkler, P. F., & Canizares, C. R. 1983, ApJ, 268, 134
- Maund et al (2007a) Maund, J. R., Wheeler, J. C., Patat, F., Baade, D., Wang, L. & Höflich, P. 2007a, ApJ, accepted, astro-ph/0709.1487
- Maund et al (2007b) Maund, J. R., Wheeler, J. C., Patat, F., Baade, D., Wang, L. & Höflich, P. 2007b, MNRAS, accepted, astro-ph/0707.2237
- Maund et al (2007c) Maund, J. R., Patat, F., Baade, D., Höflich, P., Wang, L. & Wheeler, J. C.,2007c, å, accepted, astro-ph/0709.0004
- Metzger et al. (2007) Metzger, B. D., Thompson, T. A., & Quataert, E. 2007, ApJ, 659, 561
- Morse et al. (2004) Morse, J. A., Fesen, R. A., Chevalier, R. A., Borkowski, K. J., Gerardy, C. L., Lawrence, S. S., & van den Bergh, S. 2004, ApJ, 614, 727
- Ng & Romani (2006) Ng, C.-Y., & Romani, R. W. 2006, ApJ, 644, 445
- Qian & Woosley (1996) Qian, Y.-Z., & Woosley, S. E. 1996, ApJ, 471, 331
- Ryle & Smith (1948) Ryle, M., & Smith, F. G. 1948, Nature, 162, 462
- Stone & Gardiner (2007) Stone, J. M., & Gardiner, T. 2007, ArXiv e-prints, 709, arXiv:0709.045
- Thompson et al. (2004) Thompson, T. A., Chang, P., & Quataert, E. 2004, ApJ, 611, 380
- Thorstensen et al. (2001) Thorstensen, J. R., Fesen, R. A., & van den Bergh, S. 2001, AJ, 122, 297
- Wang et al. (2002) Wang, L., et al. 2002, ApJ, 579, 671
- Wang et al. (2003) Wang, L., Baade, D., Höflich, P., & Wheeler, J. C. 2003, ApJ, 592, 457
- Wang & Wheeler (2008) Wang, L. & Wheeler, J. C. 2008, ARA&A, in press
- Wheeler et al. (2007) Wheeler, J. C., Maund, J. R., & Akiyama, S. 2007, in “Supernova 1987A: 20 Years After,” eds. S. Immler, K. Weiler, in press, arXiv:0704.3960
- Wheeler & Akiyama (2007) Wheeler, J. C., & Akiyama, S. 2007, ApJ, 654, 429
- Willingale et al. (2002) Willingale, R., Bleeker, J. A. M., van der Heyden, K. J., Kaastra, J. S. & Vink, J. 2002, A&A, 381, 1039
- Willingale et al. (2003) Willingale, R., Bleeker, J. A. M., van der Heyden, K. J., & Kaastra, J. S. 2003, A&A, 398, 1021
- Woosley et al. (1995) Woosley, S. E., Langer, N., & Weaver, T. A. 1995, ApJ, 448, 315
- Young et al. (2006) Young, P. A., et al. 2006, ApJ, 640, 891
- Youngs (1986) Youngs, D. L. 1986, Physica, 12D, 32