Outburst of the 2 s Anomalous X-ray Pulsar 1E 1547.0–5408
Abstract
Following our discovery of radio pulsations from the newly recognized Anomalous X-ray Pulsar (AXP) 1E 1547.05408, we initiated X-ray monitoring with the Swift X-ray Telescope, and obtained a single target-of-opportunity observation with the Newton X-ray Multi-Mirror Mission (XMM-Newton). In comparison with its historic minimum flux of ergs cm-2 s-1, the source was found to be in a record high state, – ergs cm-2 s-1, or ergs s-1, and declining by 25% in 1 month. Extrapolating the decay, we bound the total energy in this outburst to ergs. The spectra (fitted with a Comptonized blackbody) show that an increase in the temperature and area of a hot region, to 0.5 keV and of the surface area of the neutron star, respectively, are primarily responsible for its increase in luminosity. The energy, spectrum, and timescale of decay are consistent with a deep crustal heating event, similar to an interpretation of the X-ray turn-on of the transient AXP XTE J1810197. Simultaneous with the 4.6 hour XMM-Newton observation, we observed at 6.4 GHz with the Parkes telescope, measuring the phase relationship of the radio and X-ray pulse. The X-ray pulsed fraction of 1E 1547.05408 is only , while its radio pulse is relatively broad for such a slow pulsar, which may indicate a nearly aligned rotator. As also inferred from the transient behavior of XTE J1810197, the only other AXP known to emit in the radio, the magnetic field rearrangement responsible for this X-ray outburst of 1E 1547.05408 is probably the cause of its radio turn-on.
Subject headings:
ISM: individual (G327.24–0.13) — pulsars: individual (1E 1547.0–5408, PSR J1550–5418, XTE J1810–197) — stars: neutron1. Introduction
Anomalous X-ray pulsars (AXPs) and soft gamma-ray repeaters (SGRs) are young neutron stars (NSs) with rotation period of 2–12 s and inferred surface magnetic field strength G. See Woods & Thompson (2006) and Kaspi (2007) for recent reviews. In the magnetar model (Duncan & Thompson, 1992; Thompson & Duncan, 1995, 1996), the rearrangement and decay of their extreme fields is responsible for their large and variable X-ray luminosity, which exceeds that available from rotational braking. Thirteen magnetars are confirmed111Nine AXPs and four SGRs; there are two more candidates. See catalog at http://www.physics.mcgill.ca/pulsar/magnetar/main.html., of which the AXP 1E 1547.05408 is the most recent. Discovered with the Einstein X-ray satellite in 1980 (Lamb & Markert, 1981), 1E 1547.05408 was identified as a magnetar candidate in the center of the small candidate SNR G327.240.13 by Gelfand & Gaensler (2007). It was subsequently observed to be emitting radio pulsations at a period of s (Camilo et al., 2007b), with spin-down properties of a magnetar ( G), and a distance estimate of 9 kpc from its dispersion measure (DM). 1E 1547.05408 (PSR J15505418) and the 5.5 s AXP XTE J1810197 are the only magnetars known to emit in the radio (Camilo et al., 2006). Both are demonstrably transient radio sources, having not been detected in previous surveys of adequate sensitivity.
Here, we report on new X-ray observations of 1E 1547.05408 made shortly after the radio discovery of its pulsations, and compare them with archival X-ray data in order to understand the nature of its apparent X-ray outburst from its spectral and pulse properties. Radio pulsar coverage was also obtained at the same time as one of the X-ray observations, and the phase relationship of the radio and X-ray pulse was determined.
2. X-ray Observations
2.1. Swift
Following the detection of radio pulsations from 1E 1547.05408 on 2007 June 8, seven observations were made with the Swift X-ray telescope (XRT; Gehrels et al., 2004; Burrows et al., 2005) between 2007 June 22 and July 30. The data were taken in photon counting mode, which provides imaging with half-power diameter resolution and 2.5 s time sampling. Neither the counts nor the time resolution were sufficient to detect pulsations. We used the archived event files with standard screening criteria applied. A total of 22.4 ks of exposure was obtained, although 2.6 ks of this had incorrect attitude solution; the latter was not used for spectral analysis. The source was detected in the range 1–8 keV with an initial count rate of 0.095 s-1, and a systematic decrease of about 30% over the 40 day interval (see Fig. 1). The seven Swift observations were summed in order to accumulate sufficient statistics for a useful spectral fit. The spectral modeling is discussed in §3.
The maximum observed flux, ergs cm-2 s-1 in the 1–8 keV band on 2007 June 22, is 16 times greater than the minimum seen in 2006 July–August, and 2.6 times greater than the previous highest flux (Gelfand & Gaensler, 2007). The small dynamic range of the data in Figure 1 prevents a characterization of the decay curve, whether linear, exponential, or power law. Additional observations were made by Swift on 2007 September 28 – October 1, after a 2 month gap caused by a gyroscope anomaly, and finally on October 26. These show the flux leveling off and possibly rising again. The proximity of the Sun prevents further observations until early 2008.

2.2. XMM-Newton
The results of all archival X-ray observations of 1E 1547.05408 were published by Gelfand & Gaensler (2007). Here, we reanalyze their long (46 ks) XMM-Newton observation of 2006 August 21, which found the source in its lowest observed state, in order to compare the components of its X-ray spectrum with the high state and to make a more sensitive search for pulsations at the now known period. We reprocessed the observation data files using the emchain and epchain scripts under Science Analysis System (SAS) version xmmsas_20060628_1801-7.0.0. The 73.4 ms sampling of the European Photon Imaging Camera pn CCD (EPIC pn; Turner et al., 2003) in “full frame” mode was adequate to search for pulsations from 1E 1547.05408. The 0.9 s sampling of the two EPIC MOS cameras, operated in “large window” mode, is close to the Nyquist frequency for the 2 s pulsar.
On 2007 August 9 we obtained a new XMM-Newton observation. The exposure time was 4.2 hr in the EPIC pn and 4.6 hr in the EPIC MOS. The pn CCD was operated in “large window” mode, with 48 ms sampling. The two MOS CCDs were operated in “small window” mode, with time sampling of 0.3 s, in order to be used to study the pulsed light curve. We processed the data using the SAS version mentioned above. This observation came 10 days after a string of Swift observations, and its flux falls on the linear decay fitted to the prior Swift points (see Fig. 1). Spectral fitting of the XMM-Newton observations is discussed in §3 and timing analysis for pulsations in §4.
3. X-ray Spectral Fitting
We first tried fitting a single blackbody to the spectra from XMM-Newton and Swift. A single blackbody is an inadequate fit in either high or low states. It leaves a deficit of flux at 1 keV, and an excess at the highest energies, keV. The low-energy end of the spectrum may be affected by an unmodeled proton cyclotron absorption line, of resonance energy keV, where is the gravitational redshift and . For G, the line would appear at keV. However, there is not enough coverage of the continuum at low energies to model it.
Similarly, the high-energy end of the spectrum is poorly characterized. However, we can fit the high-energy excess with a simple Comptonization model that introduces only one additional parameter. In this model, surface thermal photons are multiply scattered by relativistic electrons of mean energy and optical depth (Pozdnyakov et al., 1976; Rybicki & Lightman, 1979). The mean energy boost factor per scattering is . In the limit , an analytic approximation for the spectrum can be derived that is a function only of the surface blackbody temperature and the combined scattering parameter . The scattered spectrum resembles the original blackbody, plus a tail that at high energies approaches a power law of photon index . This model was also used by Tiengo et al. (2005) to fit spectra of another AXP, although they derived (in our notation) .

| 2006 Aug 21 | 2007 Jun 22–Jul 30 | 2007 Aug 9 | |
|---|---|---|---|
| Parameter | XMM-Newton | Swift average | XMM-Newton |
| ( cm-2) | 3.12 (fixed) | ||
| (keV) | |||
| 2.93 (fixed) | |||
| (cm2) | |||
| (ergs cm-2 s-1)aaAbsorbed flux in the keV band. | |||
| ( ergs s-1)bbUnabsorbed, bolometric blackbody luminosity. | 0.95 | 11.3 | 7.2 |
| ( ergs s-1)ccUnabsorbed total luminosity including Comptonized component. | 1.39 | 15.2 | 9.7 |
| 0.99(117) | 1.1(27) | 0.77(252) |
Note. — Uncertainties are 90% confidence intervals for three interesting parameters. Luminosities and areas are computed for kpc, assuming isotropic flux.
While this approach neglects effects of the magnetic field, which are treated by the more realistic resonant cyclotron scattering model (Lyutikov & Gavriil, 2006; Fernández & Thompson, 2007; Rea et al., 2007a; Güver et al., 2007), the effects on the spectrum are similar, and our Comptonized blackbody model is in fact equivalent to equation (58) of Fernández & Thompson (2007), which they used to fit their own Monte Carlo spectral results. Either scattering model is more meaningful than the “traditional” pure power-law plus blackbody fit, because there is no physical mechanism that extends such a power law to photon energies less than the seed blackbody photons.
The results of spectral fitting are summarized in Table 1 and Figure 2. Acceptable values of and reasonably small errors on the three fitting parameters , and were obtained from both XMM-Newton observations. In the case of Swift, where fewer photons were collected, we could obtain a small error on , but was not constrained. We therefore fixed and in the fitting of the Swift spectrum to their nearly contemporaneous values measured by XMM-Newton in 2007.
From the average Swift spectrum of 2007 June–July, most of the flux is fitted by a blackbody whose bolometric luminosity is ergs s-1, and the corresponding area is cm2, or of the NS surface. In addition, there is a Compton scattered component of ergs s-1. Together, these components account for the total luminosity ergs s-1 in Table 1. Relative to these averages of 2007 June–July, the maximum luminosity and area recorded by the first Swift observation of 2007 June 22 are higher, i.e., ergs s-1, , and ergs s-1. Smaller values are then obtained from the subsequent XMM-Newton observation on 2007 August 9, which, within the errors, are consistent with a decrease of the blackbody area at a constant temperature. We fitted individual Swift observations to look for more subtle changes in spectral shape. Within the larger uncertainties of the individual spectra, there is no evidence for spectral changes from 2007 June 22 through October 26.
The XMM-Newton and Swift spectra from 2006 August and 2007 June, respectively, show that a combination of the increase in the blackbody temperature from 0.4 keV to 0.5 keV and an increase of the area of that hot region by a factor of 5 is primarily responsible for the dramatic increase in X-ray flux. There is no evidence for a major change in the efficiency of magnetospheric scattering between the two states, as the scattering parameter remained the same to within errors. Only of the X-ray luminosity is in the Compton scattered component in any state, as can be seen by comparing and in Table 1.
4. X-ray Pulsations
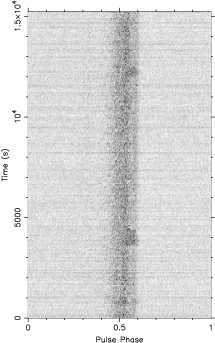
Only the XMM-Newton observations of 1E 1547.05408 have sufficient photon statistics and time resolution to search for pulsations. The event times were converted to Barycentric Dynamical Time (TDB) using the precise position of the pulsar, (J2000) R.A. = , Decl. (Camilo et al., 2007b). Events were extracted from the 2007 August XMM-Newton observation in a radius around the source in the EPIC pn CCD, and in the MOS CCDs. Photons in the range keV from the three detectors were combined, and searched for pulsations using the test. A signal was found consistent with the contemporaneous radio period with , , and . The power spectrum is shown in Figure 3. These values correspond to a chance probability of . The power contributed by the harmonics is indicative of a pulse that is narrower than a sinusoid. From the search, we derive s (), compared with s in the radio (see §5).
Figure 3 also shows the keV X-ray pulse folded at the exact radio period (determined in §5). We note that, while the 48 ms time sampling of the pn is more than sufficient to resolve the pulse, the 0.3 s sampling of the MOS also adequately resolves the observed structure. The X-rays are weakly modulated with pulsed amplitude , defined as the fraction of total counts above the minimum of the light curve. This is small compared to most AXPs, and comparable only to the small amplitude of 4U 0142+614 (Rea et al., 2007b; Gonzalez et al., 2007). The latter has a complex pulse shape, which is energy dependent as well as varying with luminosity. Within the limited statistics available for 1E 1547.05408, we do not have evidence for energy dependence of its pulse shape.


A search of the 2006 August 21 XMM-Newton observation of 1E 1547.05408 at the extrapolated radio period was less sensitive because (1) the source was in a low flux state at the time, (2) the 0.9 s sampling of the MOS detectors in large window mode is close to the Nyquist frequency, and (3) the lack of a contemporaneous radio ephemeris required a search over several dozen independent trial periods. The latter is especially problematic, as the period derivative of a magnetar can vary by a factor of several on a timescale of 1 year (e.g., Gavriil & Kaspi, 2004). Allowing for , up to 12 times its discovery value of (Camilo et al., 2007b), requires a search of independent periods in the 2006 August observation of 1E 1547.05408.
We extracted events from an optimized radius of around the source in the 2006 August EPIC pn image, and applied the test. The keV band was chosen to optimize the signal-to-noise. The strongest signal in the search range described above yielded and corresponds to , which is close to its 2007 June value of , and even closer to the latest value from continued radio timing, (F. Camilo et al., in preparation). The light curve folded at the corresponding period of 2.069067(12) s is quasi-sinusoidal with a pulsed fraction of (see Fig. 3). The overall statistical significance of this signal is difficult to estimate because the range of considered is somewhat arbitrary, but it is probably 98–99%. When we add the source photons from the MOS detectors to the search, increases to 24.0 (see Fig. 3), which is encouraging of the reality of the signal, as its significance rises to while the period remains consistent, s. Therefore, we consider this a tentative detection of pulsations on 2006 August 21.

5. Contemporaneous Radio Pulsar Observation
We observed 1E 1547.05408 with the Parkes telescope in Australia on 2007 August 9, overlapping with the XMM-Newton observation. We collected data for 4.3 hr beginning at 09:57 UT, 16 min before the start of the X-ray observation. We used the central beam of the methanol multibeam receiver and recorded data using two different spectrometers. With an analog filterbank, we sampled a bandwidth of 576 MHz centered on 6.6 GHz. Each of 192 polarization-summed frequency channels was sampled every 1 ms with one-bit precision. In parallel, we operated a digital filterbank (DFB) with a bandwidth of 256 MHz centered on 6.4 GHz, which folded the data into 2048-bin (1 ms resolution) profiles in all Stokes parameters.
We analyzed the data in standard fashion using the PRESTO, TEMPO, and PSRCHIVE packages. The pulsar was detected at s on MJD 54321.44. In order to compare the radio and X-ray light curves in absolute phase, radio pulse times-of-arrival were converted to TDB using TEMPO, and corrected to infinite frequency using the measured cm-3 pc (Camilo et al., 2007b). At the high radio frequency used, an uncertainty in DM of 100 cm-3 pc contributes a negligible 10 ms uncertainty to the infinite-frequency arrival time.
The phase alignment is shown in Figure 4. The centroid of the radio pulse lags the X-ray centroid by 0.15 cycles, while the peak of the radio pulse comes 0.19 cycles after the X-ray centroid. There were three events in the radio observation in which the pulse profile suddenly changed for times ranging from 100 to 800 seconds, then returned to its otherwise steady shape (see Fig. 5). This behavior is peculiar to radio emitting AXPs, and is also seen in XTE J1810197 (Camilo et al., 2007a). No changes in X-rays are seen in connection with these events, as the X-ray flux remained constant throughout the observation.

6. Discussion
6.1. Distance
The X-ray-measured cm-2 exceeds the total Galactic 21 cm H I column density of cm-2 in the direction of 1E 1547.05408 (Dickey & Lockman, 1990), suggesting that most of the absorption is due to molecular material. The equivalent of the CO column density in this direction is cm-2 according to the CO maps of Bronfman et al. (1989). Half of the total atomic plus molecular column is then sufficient to account for the X-ray absorption.
The cm-3 pc is consistent with the X-ray-measured and implies a distance kpc according to the free-electron model of Cordes & Lazio (2002). A smaller kpc was suggested by Gelfand & Gaensler (2007) assuming an association with two nearby star forming regions with H I measured distances. This smaller distance estimate would place PSR J15505418 in or near the Crux–Scutum spiral arm, while kpc would be compatible with a location near the Norma spiral arm. At kpc, the X-ray luminosities and blackbody areas in Table 1 would be smaller by a factor of 5.
The Galactic longitude of PSR J15505418, , falls on the tangent of our line of sight to the Norma spiral arm as mapped in CO (see Fig. 9 of Bronfman et al., 1989), at a distance of 8.5 kpc. In this direction the bulk of the CO lies at radial velocities ranging from to km s-1. If PSR J15505418 ever becomes much brighter in the radio, an H I absorption study may be able to pin down its distance more precisely, since absorption in the Crux-Scutum arm extends only to negative velocities of km s-1, while velocity as negative as km s-1 would indicate a distance closer to the Norma arm (see Fig. 4 of McClure-Griffiths et al., 2001).
6.2. Emission Mechanisms and Geometry
The X-ray spectrum of 1E 1547.05408 is similar to that of other AXPs, having a thermal component that even in a low state is fitted by a blackbody of keV, which is hotter by at least a factor of 3 than modeled cooling NSs of its same age (e.g., Yakovlev et al., 2002). This indicates that localized heating of of the NS surface area by magnetic field decay is the primary source of luminosity in the faintest observed state of 1E 1547.05408, with a smaller contribution to the spectrum from magnetospheric scattering. The remainder of the NS surface is presumably too cool to be detected, given the large distance and intervening absorption of soft X-rays.
The 0.15 cycle offset between the radio and X-ray pulses recalls the question of whether radio emission from magnetars arises on open or closed field lines, or both. It is possible that magnetic field lines on which large currents flow and radio emission is generated are anchored in the area of concentrated crustal heating from which the thermal X-ray emission emerges. In this case, the phase lag of the radio may by due to the azimuthal twist of these closed field lines, with the radio emission coming from higher altitude and different azimuth from the X-rays. On the other hand, it is not necessary that the X-ray and radio emission are associated with the same field lines, especially if radio emission is restricted to the open field line bundle while X-ray heating occurs on closed field lines. The present data leave this question open.
If we accept the tentative detection of X-ray pulsations in 2006 August, then the pulsed fraction decreased by a factor of 2 while the pulsed flux increased by a factor of 8 during the outburst. Such a trend has been seen in other magnetars, notably 1E 1048.15037 (Tiengo et al., 2005; Gavriil et al., 2006) and CXOU J164710.2455216 (Muno et al., 2007; Israel et al., 2007). One possible reason for this effect is the growth of the hot region, which occupies a significant fraction of the NS surface in outburst, but not in quiescence. Another explanation involves the changing relative contributions of the surface blackbody and scattered flux. A small surface hot spot may be highly modulated if eclipsed by the rotation of the NS, which may account for the 100% pulsed fraction of CXOU J164710.2455216 in quiescence. In outburst, enhanced magnetospheric scattering decreases that modulation. In the case of 1E 1547.05408, the Comptonized component that we fitted represents a small fraction () of the X-ray flux in any of its states, so scattering probably does not account for a change in its pulsed fraction. However, the increase in heated area to 16% of the NS surface may have that effect.
On the other hand, if we discount the evidence of enhanced pulsed amplitude in 2006, then the small X-ray pulsed fraction of in the high state (by inference in the low state as well), and the broad radio pulse, suggest that these emitting regions are both close to the axis of rotation, i.e., that PSR J15505418 is nearly an aligned rotator. This is in contrast to the other radio emitting magnetar, XTE J1810197. The pulsed fraction of XTE J1810197 was larger () at the peak of the outburst than in quiescence (Gotthelf et al., 2004). This, plus the polarization properties of the radio pulse, led Camilo et al. (2007a) to favor large inclination angles for XTE J1810197. The observed characteristics of the quiescent state of XTE J1810197, for which only an upper limit of on its pulsed fraction is known (Gotthelf et al., 2004), may also be controlled by its surface thermal emission, since unlike 1E 1547.05408, the pre-outburst spectrum of XTE J1810197 appears to be a cool blackbody covering the entire surface, with no evidence for a surface hot spot.
6.3. Energetics of the Outburst
1E 1547.05408 resembles the transient AXP XTE J1810197 in that its maximum X-ray observed luminosity, ergs s-1, is similar to the steady luminosity of most other AXPs, while 1E 1547.05408 and XTE J1810197 are usually much fainter. Assuming that the high state observed here belongs to a well-defined event, we can extrapolate the decay to estimate the total integrated energy in the outburst. Unfortunately, the functional form of the decay is not well established due to the small dynamic range of the available data, and the poorly constrained quiescent level. If we adopt the linear decay fitted in Figure 1 as the flux to be attributed to the outburst, then the total energy beginning on 2007 June 22 will be ergs. In comparison, the outburst of XTE J1810197 released ergs (Gotthelf & Halpern, 2007).
However, it is likely that the outburst of 1E 1547.05408 began before our earliest observation of it. A serendipitous detection of the radio pulsar in a survey on 2007 April 23 is reported by S. Johnston (private communication), from which we infer that the X-ray outburst was already in progress at least two months prior to our first Swift observation. The above estimate is then a lower bound on the outburst energy. An upper bound on the total energy can be derived by hypothesizing that the outburst began shortly after 2006 August 22, when 1E 1547.05408 was last observed in a low state. In this case, the initial luminosity was 3 times that seen on 2007 June 22, and the integrated energy is ergs.
An additional source of uncertainty in the total energy is the possibly aligned geometry of the pulsar as discussed above. This could cause us to overestimate the luminosity, which was calculated assuming isotropic flux, by a factor of a few. Nevertheless, the estimates are within an order of magnitude of the energy released in the outburst of XTE J1810197. The latter was interpreted as cooling following a deep crustal heating event (Halpern & Gotthelf, 2005; Güver et al., 2007), which is a promising hypothesis for 1E 1547.05408 as well.
CXOU J164710.2455216 in Westerlund 1 (Israel et al., 2007; Muno et al., 2007) is also a transient AXP. Its quiescent flux was a factor of fainter than its outburst. The peak luminosity on the first day of the outburst was ergs s-1. The flux decay followed a power law of index , and the integrated energy in the outburst was ergs during the first 130 days (Israel et al., 2007), although it could end up being much higher as the flux remained well above the quiescent level. This behavior was similar to the decay of the AXP 1E 2259+586 following a bursting episode (Woods et al., 2004). The flux integral of such a shallow decay is unbounded, which may imply that continuing energy input from the magnetic field dominates the post-burst decay, rather than the simple afterglow of an impulsive event. In contrast to the slow decay of CXOU J164710.2455216 and 1E 2259+586, models of cooling after a deep crustal heating event follow approximate power-laws in the range (Lyubarsky et al., 2002), while the observed decay of XTE J1810197 was well fitted by an exponential (Gotthelf & Halpern, 2007).
Since there was no detection of X-ray bursting activity from 1E 1547.05408 prior to its discovery as a radio pulsar, we do not know if a discrete event was responsible for its current outburst. Accordingly, it is not yet clear if the decaying X-ray flux is an afterglow of a sudden injection of energy, or simply one in a series of fluctuations in its continuous heating by magnetic field decay. We do know that earlier X-ray observations of 1E 1547.05408, by Einstein and ASCA, found it at fluxes intermediate between the low and high levels recorded here (Gelfand & Gaensler, 2007), suggesting that the recent outburst may not be an isolated event. Indeed its X-ray flux appears to have levelled off, and may even be rising again.
7. Conclusions
Prompted by its discovery as a transient radio pulsar, we obtained new X-ray observations of PSR J15505418 that reveal it in the highest state yet observed, with ergs s-1 and declining. The peak of the outburst was not observed in X-rays, but it could have been several times higher. As this is the second AXP to be detected as a transient radio source, after XTE J1810197, we infer that magnetic field rearrangement accompanying an X-ray outburst may be a necessary (although not sufficient) condition for radio turn-on of an AXP.
We also detected X-ray pulsations from PSR J15505418 for the first time, although the pulsed fraction is among the smallest observed from AXPs. Together with the properties of the simultaneously observed radio pulse, this may indicate a nearly aligned geometry. In both quiescence and outburst, the X-ray spectrum is dominated by a small blackbody hot spot of keV, with a lesser Comptonized component, as is the case for most AXPs. The changing luminosity is due mostly to the increase in area of the blackbody, and partly to its increase in temperature. This, plus the energy and time scale of the decay, suggests an origin of the brightening in a deep crustal heating event rather than a change in magnetospheric currents. The historical X-ray luminosities of 1E 1547.05408 span only a factor of 16, including some intermediate states, which is not as extreme a range as experienced by XTE J1810197 and CXOU J164710.2455216 (a factor of ). It is not yet clear if we have sampled the total range of luminosity of 1E 1547.05408, or what the duty cycle and decay time of its largest outbursts are.
References
- Bronfman et al. (1989) Bronfman, L., Alvarez, H., Cohen, R. S., & Thaddeus, P. 1989, ApJS, 71, 481
- Burke et al. (1997) Burke, B. E., Gregory, J., Bautz, M. W., Prigozhin, G. Y., Kissel, S. E., Kosicki, B. N., Loomis, A. H., & Young, D. J. 1997, IEEE Trans. Electron Devices, 44, 1633
- Burrows et al. (2005) Burrows, D. N., et al. 2005, Space Sci. Rev., 120, 165
- Camilo et al. (2007a) Camilo, F., et al. 2007a, ApJ, 663, 497
- Camilo et al. (2007b) Camilo, F., Ransom, S. M., Halpern, J. P., & Reynolds, J. 2007b, ApJ, 666, L93
- Camilo et al. (2006) Camilo, F., Ransom, S. M., Halpern, J. P., Reynolds, J., Helfand, D. J., Zimmerman, N., & Sarkissian, J. 2006, Nature, 442, 892
- Cordes & Lazio (2002) Cordes, J. M., & Lazio, T. J. W. 2002, preprint (astro-ph/0207156)
- Dickey & Lockman (1990) Dickey, J. M., & Lockman, F. J. 1990, ARA&A, 28, 215
- Duncan & Thompson (1992) Duncan, R. C., & Thompson, C. 1992, ApJ, 392, L9
- Fernández & Thompson (2007) Fernández, R., & Thompson, C. 2007, ApJ, 660, 615
- Gavriil & Kaspi (2004) Gavriil, F. P., & Kaspi, V. M. 2004, ApJ, 609, L67
- Gavriil et al. (2006) Gavriil, F. P., Kaspi, V. M., & Woods, P. M. 2006, ApJ, 641, 41
- Gehrels et al. (2004) Gehrels, N., et al. 2004, ApJ, 611, 1005
- Gelfand & Gaensler (2007) Gelfand, J. D., & Gaensler, B. M. 2007, ApJ, 667, 1111
- Gonzalez et al. (2007) Gonzalez, M. E., Dib, R., Kaspi, V. M., Woods, P. M., Tam, C. R., & Gavril, F. P. 2007, ApJ, submitted (arXiv:0708.2756)
- Gotthelf et al. (2004) Gotthelf, E. V., Halpern, J. P., Buxton, M., & Bailyn, C. 2004, ApJ, 605, 368
- Gotthelf & Halpern (2007) Gotthelf, E. V., & Halpern, J. P. 2007, Ap&SS, 308, 79
- Güver et al. (2007) Güver, T., Özel, F., Göğüş, E., & Kouveliotou, C. 2007, ApJ, 667, L73
- Halpern & Gotthelf (2005) Halpern, J. P., & Gotthelf, E. V. 2005, ApJ, 618, 874
- Israel et al. (2007) Israel, G. L., Campana, S., Dall’Osso, S., Muno, M. P., Cummings, J., Perna, R., & Stella, L. 2007, ApJ, 664, 448
- Kaspi (2007) Kaspi, V. M. 2007, Ap&SS, 308, 1
- Lamb & Markert (1981) Lamb, R. C., & Markert, T. H. 1981, ApJ, 244, 94
- Lyubarsky et al. (2002) Lyubarsky, Y., Eichler, D., & Thompson, C. 2002, ApJ, 580, L69
- Lyutikov & Gavriil (2006) Lyutikov, M., & Gavriil, F. 2006, MNRAS, 368, 690
- McClure-Griffiths et al. (2001) McClure-Griffiths, N. M., Green, A. J., Dickey, J. M., Gaensler, B. M., Haynes, R. F., & Wieringa, M H. 2001, ApJ, 551, 394
- Muno et al. (2007) Muno, M. P., Gaensler, B. M., Clark, J. S., de Grijs, R., Pooley, D., Stevens, I. R., & Portegies Zwart, S. F. 2007, MNRAS, 378, L44
- Özel & Güver (2006) Özel, F., & Güver, T. 2006, ApJ, 659, L141
- Pozdnyakov et al. (1976) Pozdnyakov, L. A., Sobol, I. M., & Sunyaev, R. A. 1976, Pis’ma Astron. Zh., 2, 140
- Rea et al. (2007a) Rea, N., Zane, S., Lyutikov, M., & Turolla, R. 2007a, Ap&SS, 308, 61
- Rea et al. (2007b) Rea, N., et al. 2007b, MNRAS, 381, 293
- Rybicki & Lightman (1979) Rybicki, G. B., & Lightman, A. P. 1979, Radiative Processes in Astrophysics (New York: Wiley)
- Thompson & Duncan (1995) Thompson, C., & Duncan, R. C. 1995, MNRAS, 275, 255
- Thompson & Duncan (1996) ———. 1996, ApJ, 473, 322
- Tiengo et al. (2005) Tiengo, A., Mereghetti, S., Turolla, R., Zane, S., Rea, N., Stella, L., & Israel, G. L. 2005, A&A, 437, 997
- Turner et al. (2003) Turner, M. J. L., Briel, U. G., Fernando, P., Griffiths, R. G., & Villa, G. E. 2003, Proc. SPIE, 4851, 169
- Woods & Thompson (2006) Woods, P. M., & Thompson, C. 2006, in Compact Stellar X-ray Sources, ed. W. H. G. Lewin & M. van der Klis (Cambridge: Cambridge Univ. Press), 547
- Woods et al. (2004) Woods, P. M., et al. 2004, ApJ, 605, 378
- Woods et al. (2005) ———. 2005, ApJ, 629, 985
- Yakovlev et al. (2002) Yakovlev, D. G., Kaminker, A. D., Haensel, P., & Gnedin, O. Y. 2002, A&A, 389, L24