Swift captures the spectrally evolving prompt emission of GRB 070616††thanks: This paper is dedicated to the memory of Dr. Francesca Tamburelli who died during its production. Francesca played a fundamental role within the team which is in charge of the development of the Swift XRT data analysis software at the Italian Space Agency’s Science Data Centre in Frascati. She is sadly missed.
Abstract
The origins of Gamma-ray Burst prompt emission are currently not well understood and in this context long, well-observed events are particularly important to study. We present the case of GRB 070616, analysing the exceptionally long-duration multipeaked prompt emission, and later afterglow, captured by all the instruments on-board Swift and by Suzaku WAM. The high energy light curve remained generally flat for several hundred seconds before going into a steep decline. Spectral evolution from hard to soft is clearly taking place throughout the prompt emission, beginning at 285 s after the trigger and extending to 1200 s. We track the movement of the spectral peak energy, whilst observing a softening of the low energy spectral slope. The steep decline in flux may be caused by a combination of this strong spectral evolution and the curvature effect. We investigate origins for the spectral evolution, ruling out a superposition of two power laws and considering instead an additional component dominant during the late prompt emission. We also discuss origins for the early optical emission and the physics of the afterglow. The case of GRB 070616 clearly demonstrates that both broadband coverage and good time resolution are crucial to pin down the origins of the complex prompt emission in GRBs.
keywords:
gamma-rays:bursts1 Introduction
The prompt emission mechanism for Gamma-ray Bursts (GRBs) is commonly attributed to internal shocks due to collisions of shells of different Lorentz factors ejected from the vicinity of a compact object (Rees & Mészáros, 1994). Later afterglow emission comes from an external shock as the GRB blastwave decelerates through interaction with the surrounding medium (Mészáros & Rees, 1997). Though the general picture appears applicable to most GRBs, the details are far from understood and other models, in particular magnetised flows, have also been proposed (e.g. Mészáros, Rees & Papathanassiou, 1994; Usov, 1994; Kumar et al., 2007; Zhang, 2007).
The advent of the Swift mission (Gehrels et al., 2004) has revealed additional features, for example steep decays and X-ray flares (Burrows et al., 2005a), whose properties are consistent with an internal origin (e.g. Tagliaferri et al., 2005; Nousek et al., 2006; O’Brien et al., 2006; Chincarini et al., 2007; Falcone et al., 2007). The steeply decaying phases that directly follow both prompt emission and X-ray flares are usually interpreted as due to the curvature effect (e.g. Kumar & Panaitescu, 2000) where high latitude emission is delayed with respect to that on-axis. However, significant spectral evolution is not expected in this model, and new mechanisms must be invoked to explain those observations that do show spectral evolution during the steep decay phase (Zhang, Liang & Zhang 2007).
Of particular interest are the longest duration GRBs in which the relationship between various possible early emission components can be studied. Observationally, very few GRBs are detected in -rays for more than 400 seconds as quantified using the T90 parameter. For example, approximately 0.5% of the BATSE sample meet this criteria (Paciesas et al., 1999). Some of the very long duration GRBs include those with a pre-cursor or a late flare (e.g. Price et al., 2002; Nicastro et al., 2004). Interestingly, the very long GRBs also include several FRED-like (fast rise, exponential decay) events which can be spectrally quite soft (Giblin et al., 2002; in ’t Zand et al., 2000).
In the Swift era it remains true that very few GRBs have a T s. The longest is GRB 060218, which is an unusually long, low luminosity, spectrally soft GRB (Campana et al., 2006b). In the first Swift BAT catalogue (Sakamoto et al., 2007) there are only three others: GRB 060929, which has a spectrally soft, late giant flare (Palmer et al., 2006); GRB 070129, for which BAT triggered on a precursor (Krimm et al., 2007); and GRB 070616.
Here we present data for the case of GRB 070616, in which the prompt emission shows a very complex multipeaked structure, leading to one of the longest prompt emission durations ever recorded. We take advantage of extensive coverage of such a long burst by the Swift Burst Alert Telescope (BAT; Barthelmy et al., 2005), the X-Ray Telescope (XRT; Burrows et al., 2005b) and the UV/Optical Telescope (UVOT; Roming et al., 2005). Combining data from Swift and Suzaku (Mitsuda et al., 2007) we study the evolution of the prompt emission spectrum, following the temporal variability of the peak energy, and study the development of the afterglow component.
In Section 2 we describe the Swift and Suzaku observations. In Section 3 we outline the X- and -ray temporal characteristics. In Section 4 we model the X-ray to -ray spectra and investigate spectral evolution. We discuss the discovery of an optical transient in the UVOT images in Section 5 and go on to model the spectral energy distributions in Section 6. In Section 7 we present possible interpretations for our findings, and discuss them in the context of the blastwave model and in comparison with other GRBs, with summary and conclusions in Section 8.
2 Observations
On 2007 June 16 at 16:29:33 UT (hereafter T0), the Swift BAT triggered on and located GRB 070616 (trigger=282445, Starling et al. 2007a). This was an image trigger, where the GRB is detected by forming an image from the collected counts which is then searched for a new point source. Swift slewed immediately to the BAT location. T90 (15–350 keV) is s (estimated error including systematics), which is among the longest T90 values for BAT GRBs.
The XRT began observing the field at 16:31:44 UT, 131 seconds after the BAT trigger; a bright, fading and uncatalogued X-ray source was clearly detected. XRT observed the source for a total exposure of 144.5 ks out to T0+3.7105 s, beginning in Windowed Timing (WT) mode at T0+137 s and continuing in Photon Counting (PC) mode at T0+976 s. Using 899 s of overlapping XRT PC mode data and UVOT band data, we obtain an astrometrically corrected X-ray position (using the USNO-B1 catalogue, Goad et al., 2007b) of RA (J2000) = 02h 08m 36.59s; Dec (J2000) = +56∘ 56′ 43.8′′, with an error of radius 2.4 arcseconds (90% containment). The error circle contains the bright star USNO-B1.0 1469-0076513.
The UVOT took a finding chart exposure of 100 seconds with the White filter starting at T0+142 s, and continued with a long band exposure followed by cycling through all seven filters. The count rates in and band exposures between 250 and 1050 seconds after the trigger show a significant excess (at 3) with respect to late observations (1 day after the trigger) at the position of the USNO-B1.0 star. We discuss this further in Section 5.
The Suzaku Wide-band All-sky Monitor (WAM; Yamaoka et al., 2005), one element of the Hard X-ray Detector (HXD; Takahashi et al., 2007) with total bandpass 50 keV to 5 MeV, detected GRB 070616 at 16:31:50 UT, 137 s after the Swift BAT trigger. The observations cover 140 s of the GRB emission, truncated by passage into the South Atlantic Anomaly. With these data alone we put a limit on the GRB duration of T90 of 112 s over 150–700 keV, consistent with the BAT (15–350 keV) T90.

The Swift data were processed with the standard Swift data reduction pipelines, and spectra and light curves were extracted with xselect. All XRT spectra are grouped such that a minimum of 20 counts lie in each bin, and X-ray light curves have a minimum of 15 source region counts per bin. We used a source extraction region of box width 40 pixels for XRT spectra in WT mode (1 pixel = 2.36′′). In the first orbit of PC mode data, emission from the source was piled up, and spectra were extracted using a 20 pixel radius annulus excluding the inner 4 pixels in radius; a correction for this was made to the ancilliary response file. Thereafter a circular source region of radius 17 pixels was employed. Background spectra were extracted from a nearby source-free region of radius 86 pixels. Spectral fitting was performed in Xspec (Arnaud, 1996) using version 008 response files. Errors are given at the 90% confidence level throughout, unless otherwise stated.
3 Temporal characteristics of the prompt emission
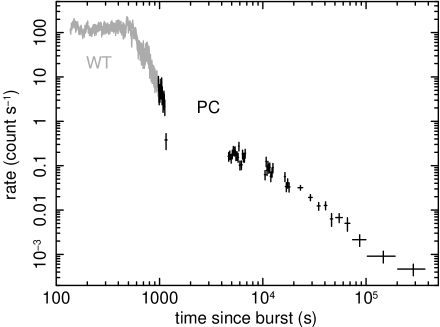
Light curves for the prompt emission in all observed bands are shown in Fig. 1. The -ray light curves show no strongly peaked or variable emission around T0, as is common for BAT image triggers such as this. BAT triggered instead on a gradual rise which lasted approximately 100 s before the first and strongest peak, centred at T0+120 s. Thereafter multiple blended peaks continue the prompt emission out to T0+500–600 s. At this point the -ray emission appears to return to the count rate at which it began at T0, whilst the X-ray emission begins a steep decay lasting until T0+1200 s (Fig. 2), and the band optical emission continues a steady rise (Fig. 1).
The X-ray observations cover much of the time period over which BAT could detect the source, and we constructed a joint BAT-XRT light curve to compare emission from the two bands. This was done by performing joint power law fits to fine time-sliced BAT-XRT (WT) spectra, and extrapolating the BAT spectra to the XRT energy band. The main peaks in the multipeaked prompt emission are found to be temporally coincident, strongly suggesting that the X-ray and -ray emission come from the same component: the GRB prompt emission. In contrast, the band optical data show a slowly rising light curve from T0+250–1000 s which is not mimicked in any of the high energy bands (Fig. 1).
We performed a lag analysis (e.g. Norris et al., 1996)
over two intervals in the BAT light curve: 70 s covering the largest
peak, and 155 s covering the flat multipeaked structure following
the largest peak. We use the four
BAT channels 15–25 keV (channel 1), 25–50 keV (2), 50–100 keV (3) and
100–350 keV (4) and 256 ms time binning. For the first interval we find the following lags:
31 = 220 ms ; 42 = 410200 ms
and in the second interval the lags have decreased to:
31 = 64 ms ; 42 = 0 ms.
The time resolution of the analysis prevents accurate measurements of lags 256 ms,
causing the relatively large errors reported here.
We attempted to model the underlying temporal behaviour of the prompt X-ray emission by fitting a multiply broken power law model to the XRT light curve, as is often done for complex GRB light curves. We find the following temporal slopes, (), and break times : = -(0.08) up to = 524, = 4.87 up to = 999 and up to 1200 s (the steepest segment of the decay has a slope so large when fit with a simple power law it is difficult to accurately measure). Between the steep slope and the first probable afterglow emission, T0+1130 to T0+5800 s, we measure = 0.5 using a power law fit to the last point on the steep decay and the second orbit of PC mode data. The afterglow temporal slope from 4600 s using this method is = 1.46.
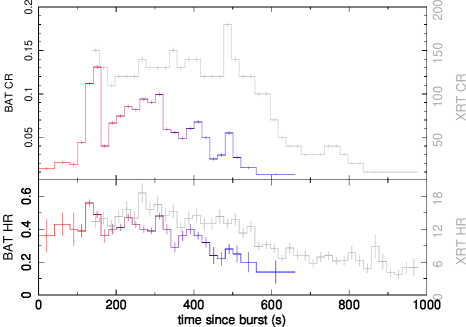

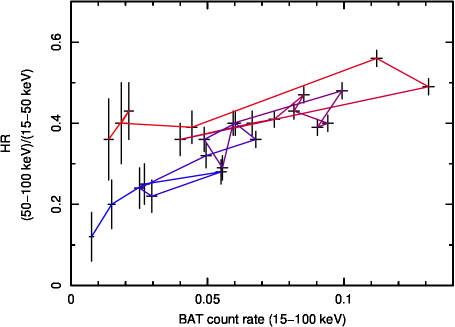
For the XRT and BAT we obtained hardness ratios as a function of time (Fig. 3). The BAT hardness ratio (15–50 keV/50–100 keV) remained approximately constant until T0+285 s when the spectra softened significantly over the remainder of the -ray observations. The XRT hardness ratio (1–10 keV/0.3–1 keV) shows the same behaviour, with the spectral evolution beginning at approximately T0+500 s (see also Fig 10 in Section 7.1). In both bands the emission begins with a hard spectrum, evolving to become softer. The source is spectrally harder at higher count rates, as shown in Fig. 4. In the lower panel of Fig. 4 we show that flares themselves are not driving this correlation, although they are consistent with it, but that there is an overall trend in the hardness ratios with only the smaller scale changes corresponding to hardening within individual flares (individual flares can be seen as loops, following the colour scale from red through to blue which represents the passage of time).
| Time | F-stat | |||
|---|---|---|---|---|
| s | 1022 cm-2 | |||
| 137-963 | 0.35 | 1.260.01 | 897/720 | |
| 137-237 | 0.35 | 1.060.03 | 346/387 | |
| 237-337 | 0.35 | 0.99 | 398/409 | |
| 337-437 | 0.35 | 1.13 | 393/410 | |
| 437-537 | 0.35 | 1.300.02 | 489/396 | |
| 537-637 | 0.35 | 1.590.03 | 288/284 | |
| 637-737 | 0.35 | 1.840.05 | 150/127 | |
| 737-837 | 0.35 | 1.85 | 109/111 | |
| 837-963 | 0.35 | 1.970.10 | 59/51 | |
| 976-1200 | 0.35 | 2.20.3 | 2.44/6 | |
| 137-963 | 0.400.01 | 1.34 | 824/719 | 610-15 |
| 137-237 | 0.390.03 | 1.09 | 341/386 | 0.02 |
| 237-337 | 0.42 | 1.07 | 385/408 | 210-4 |
| 337-437 | 0.420.03 | 1.210.04 | 375/409 | 110-5 |
| 437-537 | 0.490.03 | 1.50 | 397/395 | 110-19 |
| 537-637 | 0.42 | 1.71 | 258/283 | 210-8 |
| 637-737 | 0.42 | 1.960.09 | 142/126 | 0.01 |
| 737-837 | 0.39 | 1.91 | 104/110 | 0.02 |
| 837-963 | 0.30 | 1.86 | 56/50 | 0.11 |
| 976-1200 | 0.9 | 2.1 | 2.35/5 | 0.68 |
| 137-237 | 0.40 | 1.120.03 | 341/387 | |
| 237-337 | 0.40 | 1.05 | 385/409 | |
| 337-437 | 0.40 | 1.19 | 376/410 | |
| 437-537 | 0.40 | 1.37 | 431/396 | |
| 537-637 | 0.40 | 1.68 | 261/284 | |
| 637-737 | 0.40 | 1.93 | 143/127 | |
| 737-837 | 0.40 | 1.95 | 104/111 | |
| 837-963 | 0.40 | 2.060.10 | 64/51 | |
| 976-1200 | 0.40 | 2.30.3 | 2.55/6 |
4 Spectral fitting
4.1 X-ray
To investigate the spectral evolution seen in Figs. 3 and 4, we began by characterising the XRT X-ray spectrum for the prompt emission interval. All results are given in Table 1. To test for the presence of intrinsic absorption, we extracted a time-averaged spectrum over the time range T0+137–963 s. We fit the spectrum with a power law model with absorption set initially to the Galactic value of cm-2 (LAB survey, Kalberla et al., 2005) and then allowed to go free. The inclusion of a small column of intrinsic absorption, amounting to cm-2 at , is required according to the F-test (F-statistic = 610-15, Table 1).
We then extracted X-ray spectra in 100 s time bins from T0+137 to T0+837 s, and two further longer time bins of sizes 126 s and 224 s to extend coverage to the end of the steeply decaying phase (T0+1200 s). We fit these spectra with a power law plus Galactic+intrinsic absorption (amounting to a total column of cm-2). We also allowed the intrinsic absorption column to vary to test for any temporal changes which may be caused by e.g. ionisation by the GRB emission, but found no variation confirming that the time-averaged that we have applied is appropriate throughout. We observed the power law slope to change from to in 800 s, indicating that a spectral softening occurred in the X-ray band. This begins after the T0+337–437 s segment, and corresponds to the time of the change in the X-ray hardness ratio (see Fig. 3).
We also fit a broken power law model to the same data, initially with Galactic absorption only. The broken power law model provides statistically equal or better fits than the absorbed power law model in most cases, but this may be a symptom of the need for intrinsic absorption, and/or possibly additional spectral curvature. Adding cm-2 of intrinsic X-ray absorption does not significantly improve the majority of the broken power law fits. Although it is difficult to statistically distinguish between a power law plus intrinsic extinction and a broken power law, we find that the break energies and power law slopes in the latter model move seemingly randomly in time whereas the steepening in the single power law model matches the hardness ratio behaviour very well. In general, we expect that there will be some material within the host galaxy that lies in front of the GRB and along our line-of-sight causing detectable X-ray absorption (e.g. Campana et al., 2006a). We therefore do not consider the broken power law model further in fits to the XRT data.
The X-ray afterglow during the second orbit of PC mode data (T0+4608–6976 s) shows a soft spectrum which is well fitted by a single absorbed (Galactic+intrinsic as above) power law with (/dof = 11/13). No spectral variation is seen through the afterglow phase when comparing the above time range with data from T0+10 ks onwards which are well fit with a power law of photon index (/dof =14/16).
4.2 X-ray to -ray
We now extend the above analysis to include the higher energy BAT spectrum. Firstly we extracted a time-averaged BAT-XRT spectrum covering the prompt emission phase from the start of XRT observations to the end of source visibility with the BAT (137–963 s). We fit this with three models: a power law, broken power law and the Band function (Band et al., 1993). The normalisation for each instrument is always tied such that they are equal. In the Band function fits we fixed the high energy power law slope to as found in the Suzaku spectrum (Morigami et al., 2007, and adopting ), since the energy range with slope is expected, at least initially, to lie above the BAT band. Each model was also absorbed by either the Galactic column alone, or the previously determined Galactic+intrinsic column. Again inclusion of the small amount of intrinsic absorption improved the power law and Band fits, but was not a significant improvement for the broken power law fits. Results are given in Table 2. A single power law is a poor representation of the time-averaged joint spectrum, and we find the Band function or a broken power law provides a better fit.
To follow the spectral evolution, we time-sliced the BAT data into six 100 s bins covering T0+137–737 s, corresponding to some of those extracted for the XRT. We fit the three models listed above to the joint BAT-XRT spectra for each time bin, this time absorbed by the combination of Galactic and intrinsic absorption. The single power law model shows the same softening of the spectral slope with time as was seen for the time-sliced XRT data. The broken power law or the Band function again provide a better fit than a single power law model. The broken power law model fits suggest a fairly constant break in the middle of the X-ray band at 4–5 keV (we note that the fits are biased towards the X-ray band where there are the greatest number of counts). In the Band function fits the peak energy is derived from the free parameters (low energy power law index) and (characteristic energy) and the fixed parameter (high energy power law slope) using
| (1) |
(see Band et al. 1993 for a detailed description of the Band function; errors on are calculated using average symmetrical error bars). can be well constrained and is observed to move to lower energies with time from 135 keV down to 4 keV in 600 s (Fig. 5, Table 2), while the spectral slope also varies gradually, softening with time.

To confirm the validity of the high energy spectral slope we fixed in the previous Band function fits and the position of the peak energy derived from fits to the Swift data alone, we performed power law fits to the Suzaku WAM spectrum. The constraints we derive on the power law slopes are consistent with the value used in previous analysis (see Table 2). We then performed joint fits for WAM, BAT and XRT. The results allow us to confirm the previous findings using a broader-band spectrum. In particular, previous BAT-XRT fits suggest the peak energy of the spectrum lies in the Suzaku energy band at these times (250 s) and is therefore more accurately measured in the WAM-BAT-XRT joint fit. Results are reported in Table 2. The absorbed Band function fit to the broadband data is shown in the plot (energy equivalent of ) in Fig. 6.

5 Identifying the optical afterglow
An optical transient (OT) was not immediately identified in the Swift UVOT images owing to superposition with the bright ( = 14.4) star USNO-B1.0 1469-0076513, whose colours are consistent with those of a hot star. The blended image of the star plus the OT is extended compared to other stars in the field. In both the UVOT and bands the OT was separated from the nearby star by subtracting a properly scaled later image from earlier images. For the band subtraction we used the sum of the first and third exposures (T0+250–650 s and T0+986–1152 s) and a sum of 2 later exposures covering T0+178.2–185.1 ks. The band subtraction used a sum of the first 2 exposures (T0+704–723 s and T0+866–874 s) and a sum of 3 later exposures covering T0+97.2–98.1 ks. The scaling was based on the total exposure times and all images were mod-8 and aspect-corrected, and rebinned to 22 UVOT sub-pixels (1′′1′′). The subtracted images, of which the band is shown in Fig. 7, reveal the sources which have varied between the considered epochs. Due to minor changes in the average point spread function (PSF) of the stellar source during the orbit, count rate noise in the original images, and the combined effect of uncompensated coincidence-loss where the OT and stellar PSFs overlap, the stellar image could not completely be removed and is present as a low intensity peak and ring of opposite sign. Some residual of other bright stars can thus also be found in the subtraction. The net images in the and filters differ slightly due to different PSF and coincidence-loss effects in each band. These complications have only a minor effect on the determination of the OT position, which is found from a combination of the subtracted images of both bands. We find a best position for the afterglow at RA (J2000) = 02h 08m 36.37s; Dec (J2000) = 56∘ 56′ 44.1′′, with an uncertainty of 1.2′′ (radius, 90% confidence).

Using a 4′′ radius extraction region and a nearby source-free background region, we determine the count rates and flux densities for the OT after subtracting those of the star (Table 3). The OT is detected in the and bands at 3, and at lower significance in the band. It is not detected in the UV filters and has disappeared below detection limits in exposures taken after 1147 s in , 739 s in and 870 s in . We do not use the white filter here due to high coincidence losses. Detection of this source in the band indicates a redshift less than 3.
A limit on the near-infrared magnitude was found using the 1.34m ground-based TLS Tautenburg telescope using ISIS image subtraction (Alard & Lupton, 1998) of two epochs, finding a conservative limit on the magnitude of at 0.3 days after the trigger (K. Wiersema & D.A. Kann, private communication; see also Kann & Wilson, 2007).
To support the argument that the OT is the optical counterpart to the GRB, we performed an identical analysis on another star in the same field of view. This star reveals no change of flux throughout the observations, ruling out instrumental effects as the cause of the flux variations seen in the GRB OT. Observations carried out for a further 2 days suggest the star superposed on the OT position can be considered a constant source, making it highly unlikely that the star in the XRT error circle flared at such time that it mimicked a GRB afterglow.
| Band | Tmid | Texp | Count/s | Flux (Jy) |
| V | 317.8 | 135 | 0.450.42 | 113105 |
| 416.7 | 62.6 | 2.090.61 | 530154 | |
| 478.9 | 61.5 | 2.490.61 | 630155 | |
| 540.9 | 62.4 | 2.230.61 | 564155 | |
| 601.9 | 59.3 | 3.360.63 | 850160 | |
| 640.8 | 18.4 | 2.571.12 | 651284 | |
| 792.2 | 19.5 | 2.961.97 | 749277 | |
| 1005 | 37.1 | 4.930.83 | 1248209 | |
| 1044 | 41.0 | 2.480.75 | 627191 | |
| 1085 | 41.1 | 2.450.75 | 620190 | |
| 1126 | 41.0 | 2.480.75 | 627191 | |
| 5942 | 200 | 0.99 | 253 | |
| 11729 | 885 | 0.49 | 124 | |
| B | 734.0 | 10.0 | 3.812.13 | 309173 |
| 6044 | 393 | 1.04 | 84 | |
| 18286 | 615 | 0.83 | 67.5 | |
| U | 714.0 | 9.8 | 2.741.30 | 16880 |
| 865.0 | 9.8 | 2.481.29 | 15279 | |
| 5839 | 393 | 0.86 | 53 | |
| 17516 | 885 | 0.56 | 34 | |
| UVW1 | 765.0 | 39.8 | 1.47 | 143 |
| UVM2 | 740.0 | 39.8 | 0.84 | 104 |
| UVW2 | 767.5 | 19.0 | 1.68 | 139 |
6 Spectral energy distributions
We constructed three optical to X-ray spectral energy distributions (SEDs) spanning the prompt emission phase and one SED in the afterglow phase using the ISIS spectral fitting package (Houck & Denicola, 2000) and fitting in count space using the method described in Starling et al. (2007b). Throughout these fits we fixed the total X-ray absorption (Galactic+intrinsic) to the value of cm-2 derived from the X-ray spectral fits. Galactic extinction is also included in all fits with (Schlegel, Finkbeiner & Davis, 1998). We adopt the Small Magellanic Cloud (SMC) extinction curve for fits to the intrinsic optical extinction in the host galaxy111The SMC extinction curve is generally a better fit to GRB host galaxy extinction than that of the Milky Way or the Large Magellanic Cloud (e.g. Starling et al., 2007b; Schady et al., 2007). The SMC has the lowest metallicity of these three nearby galaxies for which extinction curves have been derived, more closely resembling the low metallicity GRB host galaxies. We also note that Solar metallicity is assumed for the X-ray absorption measurements which means the adopted value is likely a lower limit., allowing for distances to the source of 0–3 (see Section 5).
The afterglow spectral energy distribution at 5670 s comprises UVOT and upper limits and XRT data. Fits to the SED are consistent with the synchrotron model, if there is a break in between the optical and X-ray bands (discussed further in Section 7.3). Fixing the difference between the power law slopes in this broken power law model to 0.5, as expected for a cooling break, implies that some intrinsic absorption is also needed. Fitting to the optical upper limits and X-ray data we can set a lower limit to the required optical extinction of . This amount of intrinsic optical extinction lies at the high end of the observed distribution (e.g. Starling et al., 2007b), whilst the intrinsic X-ray absorption is relatively small for a GRB (e.g. Campana et al., 2006a).
The optical emission observed at earlier times is not necessarily associated with the high energy prompt emission. In creating the SEDs for these prompt phases we assume the optical and X-ray/-ray emission do come from the same component, and determine what spectral shape and amount of intrinsic extinction would be required in this scenario. The first of the prompt phase SEDs at 284 s includes UVOT band, XRT and BAT data. We fit a Band function to the spectrum with the high energy photon index fixed to 2.36. The availability of optical and high energy data provides a rare opportunity for Band function fits to a broadband SED. The band datapoint lies below the best possible fit to the whole SED. To obtain an acceptable fit either intrinsic extinction would have to be present at the level of or both extinction and a further spectral break could be present.
The second epoch SED at 770 s includes UVOT and band and XRT data. We fit an absorbed power law to the spectrum. The power law model overpredicts the optical data, illustrated in Fig. 8, and allowing for some intrinsic extinction decreases the value by 50%. In order to obtain an acceptable fit either intrinsic extinction would have to be present at the level of = 0.03–1.40, or we have a spectral break plus extinction. For the latter model we find a best fitting break energy of 0.70.2 keV, = 1.4, 1.970.05 consistent with BAT-XRT Band function fits (Section 4.2) and 0.5. The power law slopes differ by 0.5 consistent with a cooling break inferring that the cooling break moves to lower energies with time. Both single and broken power law fits are, however, statistically acceptable and indistinguishable.
The third epoch SED at 1082 s is the least constrained: this SED covers the final part of the steep X-ray decay phase of the light curve where the X-ray source has become fainter and XRT was operating in PC mode. A joint fit of the UVOT band data and the X-ray spectrum manages to accommodate the single optical point without inclusion of any intrinsic extinction, with a slope of and /dof = 8.6/7, but is inconsistent with the fit to the X-ray data alone of (Table 1, Section 4.1) and with the afterglow SED fits. Including an intrinsic extinction component the power law photon index is then best fit with and the range of allowed extinction values is 0.5–2.2. More complex models cannot be tested with this dataset.

7 Discussion

In GRB 070616 we have the rare opportunity to track the detailed spectral and temporal evolution from -rays to X-rays throughout the entire prompt emission phase. Hence we devote the majority of this discussion to the possible origins of the complex prompt emission, as well as the early optical emission, using the observational results given above. We also provide a brief discussion of the afterglow characteristics in the framework of the standard synchrotron model.
7.1 The prompt emission mechanisms
The prompt emission of GRB 070616 is atypical of GRBs in that the emission rises relatively slowly over about 100 seconds to a peak, then persists at a fairly constant level for 150 s in -rays and 350 s in X-rays before showing a rapid decline. Throughout the constant phase the light curve resembles a large number of flares or flickering superimposed on an underlying constant intensity emission. During this prompt phase we observe strong spectral evolution from hard to soft. The spectral evolution begins at T0+285 s at -ray energies, while the X-ray flux is still at an approximately constant level, and begins 200 s later at X-ray energies around the onset of the steep X-ray decay (Fig 3).
The spectral variability suggests a peak moving through the bandpass. We find that the peak of the spectrum can be accurately measured by adding the higher energy Suzaku WAM data to the Swift coverage. Assuming the Band function to model the spectrum, the spectral peak started out at the high energy end of the BAT range — and was probably above 200 keV before the XRT or Suzaku observations began — and moved to lower energies to most probably lie within the XRT bandpass beyond T0+700 s (Fig. 5). Indeed such strong spectral evolution may help explain some of the steep X-ray decline. We also find an indication that the BAT spectral lags may have decreased during the prompt emission from the first main peak to 200 s later: such lag evolution appears to be common among spectrally evolving GRBs (J. Cannizzo et al. in preparation). The second, lower lag measurement was taken just after the BAT hardness ratio had begun its decrease and the spectral peak energy had fallen below 100 keV to be clearly detectable within the BAT energy range.
While the spectral peak is moving we also measure a softening of the spectrum at frequencies below the peak. The spectral index above the peak energy, , is found to be 2.36 from the Suzaku data (Morigami et al., 2007). The spectrum is observed to be harder at higher count rates, as has been shown for several other GRBs (e.g. GRB 051117a, Goad et al. 2007a; GRB 061121, Page et al. 2007). Superimposed on this general trend is a hardening during the rise of individual flares, but this effect is not driving the overall evolution (Fig. 4).
Spectral evolution through the prompt phase has been noted previously, and is inconsistent with the idea that the curvature effect alone – the delayed arrival of emission from progressively higher latitudes within the jet – is driving the emission during the steep decay phase (e.g. Liang et al., 2006). If we try to force a curvature effect model to explain the observed steep X-ray slope from the peak of the last flare at T0+757 s out to T0+950 s, we would expect that phase to begin at T0+632 s given the requirement of the model that ( and adopting the average spectral energy index over that time interval of , Fig. 9). This would require a long initial emission period of over 600 s. In the sample of Swift GRBs studied by Liang et al. (2006) the typical injection of energy tends to occur at the onset of the previous large peak. The curvature effect clearly cannot explain the steepest part of the X-ray decay from T0+976–1200s (see last point in Fig. 9, also seen in e.g. GRB 051117a, Goad et al. 2007a; GRB 070110, Troja et al. 2007). However, the combination of the curvature effect and the strong spectral evolution we observe, which is a continuous process starting well before 600 s, may be able to account for the steep X-ray decay.
Zhang et al. (2007) studied the X-ray tails of the prompt emission for a sample of Swift GRBs and found that only 25% of those could be fit with the curvature effect alone; those not well fit showed spectral evolution. From fits to 16 GRBs, they tested and subsequently disfavoured two possible causes of the spectrally evolving X-ray tails, namely an angle-dependent spectral index in structured jets and a superposition of the curvature effect and a power law decay component. The observed spectral softening could, they suggest, be caused by cooling of the plasma where the cooling frequency decreases with time. This manifests itself as a cut-off power law shape with the cut-off moving to lower energies with time, shown to be a good fit to GRB 060218 and proposed earlier for GRB 980923 (Giblin et al., 1999), and similar to our Band function results for GRB 070616. In this scenario the peak energy we track through the BAT band would be the cooling frequency. The prompt emission SED at 770 s after the trigger, including optical emission, is consistent with an absorbed broken power law where the break shows the characteristics of a cooling break (though a single absorbed power law provides an equally good fit). In the afterglow SED we most probably do detect the cooling break, hence we may have observed it moving to lower energies with time. However, we also observe softening of the low energy power law slope in addition to movement of a peak or cooling frequency. Other models for the prompt emission have been suggested - see Zhang (2007) for a review.

We now investigate origins for the apparent spectral evolution in the simple superposition of multiple components. Fig. 10 shows the spectral evolution in the XRT band, characterised by the fitted power law slope (), displaying a similar behaviour to many of the bursts studied by Zhang et al. (2007) and resembling most closely that of GRB 060510B which also had a lengthy prompt emission duration of T s with some flaring (Barthelmy et al., 2006). To approximate the shape of the spectral evolution of GRB 070616 in the X-ray band ( vs. time) we fit a model with two power laws:
| (2) |
where is time since a fitted T0,fit value and is the photon energy. We fixed the spectral slopes to those of the typical measured prompt and afterglow values, and . We fixed at the probable afterglow temporal slope during the plateau of 0.5 (see Section 3) while , T0,fit and the relative contributions of the prompt and afterglow components were left to vary. This double power law model, overlaid on the evolution of in Fig. 10, appears to be a reasonable description of the behaviour through the steep decay and afterglow phases, with , T0,fit = T0+200 s and the two components contributing equally to the flux at T0+800 s. The spectral shape evolves due to the increasing contribution from the afterglow to the overall spectrum. We then returned to the high energy light curve to test the double power law model fitted above. The dashed line in the lower panel of Fig. 11 shows the double power law model applied to the high energy light curve. Clearly, although the evolution of is well modelled the flux is not. We can therefore rule out a spectrally invariant double power law model.

It is possible that there is a further emission component, in addition to the high latitude emission, contributing to the steep decay ending the prompt emission, which becomes prominent between the prompt and early afterglow phases. To examine this possibility we applied the modelling procedure of O’Brien et al. (2006) and Willingale et al. (2007) in which it was shown that GRB early light curves can be well modelled by up to two emission components each consisting of an exponential followed by a power law decay. The first component models the prompt emission, adjusting the zero time, T0, to provide the best fit. For GRB 070616 this moves zero close to the brightest peak in the prompt light curve at 121 seconds after the trigger. The best-fit model to the Swift BAT and XRT data is given in Table 4 and Fig. 11.
| component | parameter | value |
|---|---|---|
| 1 | 7.37 | |
| 1 | 1400 s | |
| 2 | 1.69 | |
| 2 | 14380 s |
We find that the light curve of GRB 070616 is not well fitted by the usual two components consisting of an exponential plus a power law decline. The first, prompt component can fit the initial prompt data following the brightest peak, but then declines until the second, afterglow component starts to dominate. This final component can be fit with a power law of slope from 4600 s onwards, typical of a post-plateau GRB afterglow (Table 4). There remains an excess flux dominating from some 200–1000 seconds post-trigger. We speculate that this flux plus the spectral evolution indicate an additional source of prompt emission which does not dominate in the majority of GRBs.
Interestingly, several, although not all, of the GRBs with strong spectral evolution studied in Zhang et al. (2007) are also not well fitted by the two-component light curve model (e.g. GRBs 051227 and 060614, see Willingale et al., 2007). Others not well fitted by this modelling procedure, such as GRB 051117A (Goad et al., 2007a) were identified by Zhang et al. (2007) as having evolution which they attributed to flares. Such GRBs may instead be more similar to GRB 070616. GRB 051117A, for example, shows a long, bright, slowly declining prompt emission period with flaring followed by a sharp drop to a plateau or afterglow phase. GRB 070616 may be a case where the flux remains fairly constant, with flaring, up to the sharp drop. Among the Swift BAT bursts we notice of order 10 bursts with an initially flat high energy light curve, most prominent in GRB 070616, which when studied as a sample may provide more evidence in support of either a long-duration central engine or an additional component (N. Lyons et al. in preparation).
7.2 The origin of the early optical emission
The Swift era has provided a wealth of information on the early -ray and X-ray emission. The prompt optical emission has been harder to reveal as in most GRBs the flux level lies below that accessible to fast-response, modest aperture telescopes. Even so, for those GRBs which have been detected the relationship between the optical and X-ray emission is complex. In a very small number of cases the optical actually lies above the extrapolation of the higher-energy emission (e.g. GRB 990123, Akerlof et al., 1999). The optical can be dominated by a component related to the prompt high energy emission (e.g. Vestrand et al., 2005; Yost et al., 2007a). More usually, the optical lies below such an extrapolation, as shown for a sample of ROTSE-detected Swift GRBs by Yost et al. (2007b, using BAT data only for the extrapolations). This pattern of diverse behaviour strongly suggests a mixture of components can contribute to the prompt optical emission, including the afterglow (due to the external shock) and emission from the prompt fireball (which may include a reverse shock). In the latter case the optical should connect, possibly with a spectral break, with the prompt -ray – X-ray spectrum.
Few optical datasets have sufficient broadband data to check for consistency in spectral shape as well as overall flux level, limiting our ability to constrain reddening effects as opposed to spectral breaks. For GRB 070616 the combination of long-duration prompt emission plus early optical multi-colour data can provide some constraints on the relationship between the optical emission and the high-energy prompt emission. The band light curve shows a rise to a plateau-like phase from the first observation beginning at T0+250 s and extending to T0+1000 s. The optical decay does not follow the steeply decaying X- and -ray prompt emission. A gradual rise would be typical of the start of afterglow emission, seen in a number of bursts (Molinari et al., 2007). We performed a power law fit to the band light curve shown in Fig. 1 and measure = -(). This is consistent with predictions for the afterglow rise in the fireball model of (e.g. Zhang & Mészáros, 2004). Fits to the three prompt emission SEDs for GRB 070616 all show that extrapolation of the high energy spectrum to lower energies overpredicts the optical flux, however this may be overcome with a relatively large amount of intrisic extinction or a combination of extinction and a spectral break, if the optical data are assumed to be prompt emission dominated.
We can compare this burst with other GRBs for which well-time-resolved prompt optical data are available, and whose light curves are not afterglow-dominated from early times. For GRB 050820A Vestrand et al. (2006) find a rising optical component plus a component correlated with the -ray emission. In GRB 050904 the optical data rose to a plateau before mimicking a flare seen in the X-rays (Boër et al., 2006). Similarly in GRB 051111 Yost et al. (2007a) suggest a combination of components produce the prompt optical emission with a significant contribution to the early optical flux from an extension of the higher-energy spectrum. These are similar to the case of GRB 061121 (Page et al., 2007) where the high energy prompt emission consisted of a single large peak, which was mimicked in the optical data, although an additional spectrally evolving optical component is also seen. Extrapolation of the high energy spectrum in GRB 061121 overpredicts the early optical emission, suggesting a spectral break. We note that the extrapolation of the high energy spectrum to the optical band predicts a relatively higher optical flux in GRB 061121 than in GRB 070616, due to its softer high energy spectrum.
For GRB 070616 we conclude that strong optical emission associated with the prompt phase and described by a simple extrapolation of the observed higher energy spectrum cannot be present without invoking a further spectral break in between optical and X-rays or extinction in the host at the highest end of the currently observed values (e.g. Schady et al., 2007; Starling et al., 2007b). We can likely rule out the external-external” shock model (Mészáros & Rees, 1993), which requires that the broadband prompt emission is produced by one and the same mechanism and any variability is caused by density enhancements in the external medium, given the very different behaviour of the optical and X-ray light curves.
7.3 The afterglow
After T0+4000 seconds the X-ray afterglow can be considered ‘typical’ of what we know for GRB afterglows: the spectral and temporal parameters lie within the range of the 250 Swift-observed GRBs. We test these parameters against the synchrotron model, using the closure relations for the case of a cooling break in between the optical and X-ray bands, and , and find that the observed temporal and spectral X-ray slopes are just consistent at the 90% level and therefore follow the expectations for synchrotron emission (in the slow cooling regime). This result also indicates that the afterglow has not reached the ‘jet’ phase, in agreement with the lack of evidence for a jet break during the Swift observations. We do not find good agreement if the cooling frequency were to lie above the X-ray band, , at this time, consistent with the requirement of a broken power law to best describe the SED of the late-time afterglow spectrum plus optical upper limits. Therefore we conclude that the observed spectral break is due to the cooling frequency. The cooling frequency is likely to lie at or above the X-ray frequencies at earlier times (4000 s), depending on the circumburst medium density structure, but we cannot confirm this since the initial X-ray emission is prompt-dominated.
We find a 90% confidence range for the injected electron energy index, , of 2.68–3.46, as determined from the measured X-ray spectral index where . This is higher than the commonly quoted ‘universal’ value of derived from some numerical simulations of particle acceleration in relativistic shocks (e.g. Achterberg et al., 2001), but other numerical simulations (e.g. Baring, 2004) and recently published observational studies of samples of afterglows (Shen, Kumar & Robinson, 2006; Starling et al., 2007c) find a range of allowed values for which encompass the values we report for GRB 070616.
8 Conclusions
GRB 070616 has afforded us the rare opportunity to track the detailed spectral and temporal evolution from -ray to optical wavelengths throughout much of the prompt emission phase, owing to Swift’s fast slew capability, the broadband coverage provided by the combination of Swift with Suzaku WAM, and the long prompt emission duration. The high energy light curve remains generally flat for several hundred seconds before going into a steep decline.
Spectral evolution from hard to soft is clearly taking place through the prompt emission (flat and decaying phases) of GRB 070616, beginning at 285 s out to at least 1000 s. The high energy spectrum from 0.3–800 keV is well modelled by a Band function. We track the spectral peak energy moving from 135 keV down to 4 keV and measure a softening of the low energy spectral slope from 1.1–2.3. The curvature effect, whilst contributing to the spectral shape, is not dominating during the steep decay at 1000 s.
The presence of an additional component, perhaps not present in most GRBs, is favoured by the inability of a two-component fit to model the light curve. This unusual light curve shape of an initial constant flux followed by a sharp drop, plus the strong spectral evolution, is most prominent in GRB 070616, but we note a similar structure can be found in a small number of other GRBs which are also not dominated by the curvature effect and not well fit by the two-component model.
We find that the optical data during the prompt phase are not consistent with a simple extrapolation of the high energy spectrum, requiring either significant intrinsic extinction or some extinction plus a break in the spectrum between the X-ray and optical bands.
The afterglow is consistent with the synchrotron model, with the cooling break lying in between optical and X-ray bands at a few thousand seconds after the trigger.
The prompt emission of GRB 070616 comprises a component well fitted with a Band function and a possible further component. It is clear that both broadband coverage and good time resolution are crucial to pinning down the origins of the complex prompt emission in GRBs.
![[Uncaptioned image]](/html/0711.3753/assets/x13.png)
9 Acknowledgments
We thank E. Rol, O. Godet, P.A. Evans, G. Sato, S.T. Holland, F.E. Marshall, S.R. Oates and A. de Ugarte Postigo for useful discussions. We thank all the Suzaku WAM team for their contributions, in particular M.S. Tashiro, K. Yamaoka, K. Morigami and M. Ohno, and we acknowledge the whole Swift team for their many contributions. We thank B. Gendre for useful comments on the manuscript. RLCS, KLP and JPO acknowledge financial support from STFC.
References
- Achterberg et al. (2001) Achterberg A., Gallant Y.A., Kirk J.G., Guthmann A.W., 2001, MNRAS, 328, 393
- Akerlof et al. (1999) Akerlof C. et al., 1999, Nature, 398, 400
- Alard & Lupton (1998) Alard C., Lupton R.H., 1998, ApJ, 503, 325
- Arnaud (1996) Arnaud K., 1996, ASPC, 101, 17
- Band et al. (1993) Band D. et al., 1993, ApJ, 413, 281
- Baring (2004) Baring M.G., 2004, Nuclear Physics B Proceedings Supplements, 136, 198
- Barthelmy et al. (2005) Barthelmy S. et al., 2005, Space Sci. Rev., 120, 143
- Barthelmy et al. (2006) Barthelmy S. et al., 2006, GCN Circulars, 5107
- Boër et al. (2006) Boër M., Atteia J.L., Damerdji Y., Gendre B., Klotz A., Stratta G., 2006, ApJ, 638, L71
- Burrows et al. (2005a) Burrows D.N. et al., 2005a, Science, 309, 1833
- Burrows et al. (2005b) Burrows D.N. et al., 2005b, Space Sci. Rev., 120, 165
- Campana et al. (2006a) Campana S. et al., 2006a, A & A, 449, 61
- Campana et al. (2006b) Campana S. et al., 2006b, Nature, 442, 1008
- Chincarini et al. (2007) Chincarini G. et al., 2007, ApJ in press, preprint (arXiv:astro-ph/0702371)
- Falcone et al. (2007) Falcone A.D. et al., 2007, ApJ submitted, preprint (arXiv:0706.1564)
- Gehrels et al. (2004) Gehrels N. et al., 2004, ApJ, 611, 1005
- Gehrels et al. (2005) Gehrels N. et al., 2005, Nature, 437, 851
- Giblin et al. (2002) Giblin T.W., Connaughton V., van Paradijs J., Preece R.D., Briggs M.S., Kouveliotou C., Wijers R.A.M.J., Fishman G.J., 2002, ApJ, 570, 573
- Giblin et al. (1999) Giblin T.W., van Paradijs J., Kouveliotou C., Connaughton V., Wijers R.A.M.J., Briggs M.S., Preece R.D., Fishman G.J., 1999, ApJ, 524, L47
- Goad et al. (2007a) Goad M.R. et al., 2007a, A & A, 468, 103
- Goad et al. (2007b) Goad M.R. et al., 2007b, A & A in press, preprint (arXiv:0708.0986)
- Houck & Denicola (2000) Houck J.C., Denicola L.A., 2000, ASPC, 216, 591
- in ’t Zand et al. (2000) in ’t Zand J.J.M. et al., 2004, Proceedings of the Third Rome Workshop on Gamma-Ray Bursts in the Afterglow Era, ASP Conference Series, 312, 18, Eds. M. Feroci, F. Frontera, N. Masetti, L. Piro.
- Kalberla et al. (2005) Kalberla P.M.W., Burton W.B., Hartmann D., Arnal E.M., Bajaja E., Morras R., Poppel W.G.L., 2005, A & A, 440, 775
- Kann & Wilson (2007) Kann D.A., Wilson A.C., 2007, GCN Circulars, 6629
- Krimm et al. (2007) Krimm H. et al., 2007, GCN Circulars, 6058
- Kumar et al. (2007) Kumar P. et al., 2007, MNRAS, 376, L57
- Kumar & Panaitescu (2000) Kumar P., Panaitescu A., 2000, ApJ, 541, L51
- Liang et al. (2006) Liang E.W. et al., 2006, ApJ, 646, 351
- Mészáros & Rees (1993) Mészáros P., Rees, M.J., 1993, ApJ, 405, 278
- Mészáros & Rees (1997) Mészáros P., Rees, M.J., 1997, ApJ, 476, 232
- Mészáros, Rees & Papathanassiou (1994) Mészáros P., Rees, M.J., Papathanassiou, H., 1994, ApJ, 432, 181
- Mitsuda et al. (2007) Mitsuda K. et al. 2007, PASJ, 59, S1
- Molinari et al. (2007) Molinari E. et al., 2007, A & A, 469, L13
- Morigami et al. (2007) Morigami K. et al., 2007, GCN Circulars, 6578
- Nicastro et al. (2004) Nicastro L. et al., 2004, A&A, 427, 445
- Norris et al. (1996) Norris J.P., Nemiroff R.J., Bonnell J.T., Scargle J.D., Kouveliotou C., Paciesas W.S., Meegan C.A., Fishman G.J., 1996, ApJ, 459, 393
- Nousek et al. (2006) Nousek J. et al., 2006, ApJ, 642, 389
- O’Brien et al. (2006) O’Brien P.T. et al., 2006, ApJ, 647, 1213
- Paciesas et al. (1999) Paciesas W.S. et al., 1999, ApJS, 122, 465
- Page et al. (2007) Page K.L. et al., 2007, ApJ, 663, 1125
- Palmer et al. (2006) Palmer D., Sato G., Barthelmy S.D., Sakamoto T., Markwardt C., Gehrels N., 2006, GCN Circulars, 5662
- Price et al. (2002) Price P.A. et al., 2002, ApJ, 573, 85
- Rees & Mészáros (1994) Rees M.J., Mészáros P., 1994, ApJ, 430, L93
- Roming et al. (2005) Roming P.W.A. et al., 2005, Space Sci. Rev., 120, 95
- Sakamoto et al. (2007) Sakamoto T. et al., 2007, ApJ in press, preprint (arXiv:0707.4626)
- Schady et al. (2007) Schady P. et al., 2007, MNRAS, 377, 273
- Schlegel, Finkbeiner & Davis (1998) Schlegel D.J., Finkbeiner D.P., Davis M., 1998, ApJ, 500, 525
- Shen, Kumar & Robinson (2006) Shen R., Kumar P., Robinson E.L., 2006, MNRAS, 371, 1441
- Starling et al. (2007a) Starling R.L.C. et al., 2007a, GCN Circulars, 6542
- Starling et al. (2007b) Starling R.L.C., Wijers R.A.M.J., Wiersema K., Rol E., Curran P.A., Kouveliotou C., van der Horst A.J., Heemskerk M.H.M., 2007b, ApJ, 661, 787
- Starling et al. (2007c) Starling R.L.C., van der Horst A.J., Rol E., Wijers R.A.M.J., Kouveliotou C., Wiersema K., Curran P.A., Weltevrede P., 2007c, ApJ in press, preprint (arXiv:0704.3718)
- Tagliaferri et al. (2005) Tagliaferri G. et al., 2005, Nature, 436, 985
- Takahashi et al. (2007) Takahashi T. et al., 2007, PASJ, 59, 35
- Troja et al. (2007) Troja E. et al., 2007, ApJ, 665, 599
- Usov (1994) Usov V.V., 1994, MNRAS, 267, 1035
- Vestrand et al. (2005) Vestrand W.T. et al., 2005, Nature, 435, 178
- Vestrand et al. (2006) Vestrand W.T. et al., 2006, Nature, 442, 172
- Willingale et al. (2007) Willingale R. et al., 2007, ApJ, 662, 1093
- Yamaoka et al. (2005) Yamaoka K. et al., 2005, IEEE, TNS, Vol. 52, No. 6, 2765
- Yost et al. (2007a) Yost S.A. et al., 2007a, ApJ, 657, 925
- Yost et al. (2007b) Yost S.A. et al., 2007b, ApJ, 669, 1107
- Zhang (2007) Zhang B., 2007, Chin. J. Astrophys, 7, 1
- Zhang et al. (2007) Zhang B.-B., Liang E.-W., Zhang B., 2007, ApJ, 666, 1002
- Zhang & Mészáros (2004) Zhang B., Mészáros P., 2004, Int.J.Mod.Phys., A19, 2385