The mid IR – hard X-ray correlation in AGN and its implications for dusty torus models ††thanks: Based on ESO observing programmes 075.B-0844(C) and 077.B-0137(A)
Abstract
Aims. We investigate mid-infrared and X-ray properties of the dusty torus invoked in the unification scenario for active galactic nuclei by using the relation between mid IR and hard X-ray luminosities to constrain the geometry and physical state of the dusty torus.
Methods. We present new VISIR observations of 17 nearby AGN and combined these with our earlier VISIR sample of 8 Seyfert galaxies. After combining these observations with X-ray data from the literature, we studied the correlation between their mid IR and hard X-ray luminosities.
Results. A statistically highly significant correlation is found between the rest frame m () and 2-10 keV () luminosities. Furthermore, with a probability of 97 %, we find that Sy 1 and Sy 2 nuclei have the same distribution of over .
Conclusions. The high resolution of our MIR imaging allows us to exclude any significant non-torus contribution to the AGN mid IR continuum, thereby implying that the similarity in the / ratio between Sy 1s and Sy 2s is intrinsic to AGN. We argue that this is best explained by clumpy torus models. The slope of the correlation is in good agreement with the expectations from the unified scenario and indicates little to no change in the torus geometry with luminosity. In addition, we demonstrate that the high angular resolution is crucial for AGN studies in the IR regime.
Key Words.:
galaxies: active – Infrared: galaxies – X-rays: galaxies1 Introduction
The unification model for active galactic nuclei (AGN) interprets the different appearance of Seyfert 1 (Sy1) and Seyfert 2 (Sy2) galaxies uniquely as the result of an orientation effect (Antonucci 1993; Barthel 1994; Urry & Padovani 1996). The central engine is considered to be surrounded by an optically and geometrically thick molecular torus. Associated with this torus are large masses of dust that supposedly reprocess the X-ray and UV emission from the accretion disk and re-emit it in the mid infrared (MIR) regime (Pier & Krolik 1993).
It is thus very attractive to search for correlations between IR continuum and hard X-ray emission in order to test the unification scenario for AGN. A tight correlation between the m continuum and the absorption-corrected 2-10 keV luminosities for 8 nearby Seyfert galaxies was reported by Krabbe et al. (2001) using resolution MIR imaging. More recently, Lutz et al. (2004) found a correlation between the rest frame m luminosity and the absorption-corrected hard X-ray luminosity for a sample of AGN. This sample was comprised of objects for which angular resolution ISOPHOT spectra and hard X-ray observations were available; in particular it does not contain Compton-thick objects. However, the authors reported two problems that the unification scenario faces when compared with their observations. (I) The scatter of the relation is about an order of magnitude larger than expected from the results of Krabbe et al. (2001). (II) There is no significant difference between type 1 Seyferts (Sy types 1 to 1.5) and type 2 Seyferts (Sy types 1.8 to 2) objects in the average ratio of mid-infrared to hard X-ray emission, as would be expected from an optically and geometrically thick as well as smooth torus dominating the mid IR AGN continuum. This was also supported by Alonso-Herrero et al. (2002) who investigated the correlation between the m luminosity and the black hole mass of AGN. In an earlier paper (Horst et al. 2006, hereafter Paper I), we presented VISIR observations of 8 nearby Seyfert nuclei. With our angular resolution of at FWHM we then improved upon Krabbe et al. (2001) and Lutz et al. (2004) by a factor of 3 and 80, respectively, thus minimising contributions from extra-nuclear emission. We found a strong correlation between the rest frame m and 2-10 keV luminosities with type 1 and type 2 Seyferts following the same correlation of . We interpreted this as a strong indication for the obscuring medium to be clumpy rather than smoothly distributed and thus appearing as optically thin in the mid infrared. Moreover, we found the slope to be in good agreement with the theoretical predictions by Beckert & Duschl (2004).
Here we present results from our enlarged AGN sample which contains 21 newly observed objects, out of which 17 were detected with VISIR. Thus, we can now analyse the mid IR and hard X-ray properties of 25 objects.
Throughout this paper we assume km s-1 Mpc-1, and (Spergel et al. 2006).
2 Target selection and X-ray data
2.1 Target selection
Our first sample of VISIR targets (see Paper I, ) was drawn from the sample by Lutz et al. (2004). Our criteria were observability at low airmass from Paranal observatory during ESO period 75, redshifts below 0.1 and coverage of a wide span of hard X-ray luminosities in both type 1 and type 2 objects. For the present work we have revisited the X-ray properties of these objects (see Appendix A) to account for the most recent observations. However, only minor changes had to be applied to the luminosities reported in Paper I. The revisited characterisation of the sample is given in Table 1. Redshifts were taken from the NED, Seyfert types are according to Véron-Cetty & Véron (2006) – with L denoting LINER type AGN – and the inclination angles of the host galaxies on the sky were taken from the HyperLeda database (Paturel et al. 2003). The last column contains the linear scale on the plane of the sky that is resolved by VISIR, computed for an angular resolution of , which is a typical value for our observations (see Table 3).
For our second sample of objects (listed in Table 2), we also selected targets not included in the Lutz et al. sample. We browsed the literature for relatively nearby AGN () with inferred absorption-corrected hard X-ray luminosities that are observable at low airmass from Paranal observatory during ESO period 77. An additional criterion was the inclination of the host galaxy toward the plane of the sky. We set the limit at an inclination angle of in order to avoid viewing the AGN through large amounts of gas in the host galaxy. Note, that two objects from our first sample – NGC 526a and NGC 7314 – do not meet this requirement.
| Object | Sy | log | Scale∗∗ | ||
| [erg/s] | [pc] | ||||
| Fairall 9 | 0.047 | 1.2 | 320 | ||
| NGC 526a | 0.019 | 1.9 | 135 | ||
| NGC 3783 | 0.010 | 1.5 | 70 | ||
| NGC 4579 | 0.005 | L | 35 | ||
| NGC 4593 | 0.009 | 1.0 | 65 | ||
| PKS 2048-57 | 0.011 | 1h | 80 | ||
| PG 2130+099 | 0.062 | 1.5 | 415 | ||
| NGC 7314 | 0.005 | 1h | 35 | ||
| ∗Column 4 lists the inclination angles of the host galaxies on the sky. | |||||
| ∗∗Column 6 contains the scale we resolve in our observations. | |||||
For our target selection we searched the literature for AGN with inferred 2-10 keV luminosities. Observations at different epochs were taken as an indicator for the intrinsic variability of the object. This task requires a lot of care as X-ray observations can be of varying quality especially if non-imaging instruments are involved. Furthermore, different authors sometimes pursue different strategies for fitting the observed data. In general we gave higher priority to recent data obtained at the best spatial resolution and highest signal-to-noise ratio. Where multi-epoch observations are not available we assume a variability / uncertainty of a factor of 2 (0.3 dex) which is a typical value for our sample. Furthermore we account for a distance uncertainty of 10 %.
The main characteristics of the selected AGN are listed in Table 2; a more detailed description of the X-ray properties of each object can be found in Appendix A. The classification of all AGN in our sample has been done according to Véron-Cetty & Véron (2006) with the exception of NGC 4303 (see section 2.2) and Cen A which is listed as a possible BL Lac object but is commonly referred to as an optical type 2 AGN. For the rest of this paper, we summarise Sy types 1.0, 1.2 and 1.5 as “type 1” and Sy types 1.8, 1.9, 2.0 and 1h (broad lines detected in the polarised spectrum) as “type 2”.
| Object | Sy | log | Scale | ||
| [erg/s] | [pc] | ||||
| MCG-01-01-043 | 0.030 | 1.0 | 200 | ||
| Mrk 590 | 0.026 | 1.0 | 175 | ||
| NGC 1097 | 0.004 | L | 30 | ||
| NGC 4303 | 0.005 | L∗ | 35 | ||
| NGC 4472 | 0.003 | 2.0 | 20 | ||
| NGC 4507 | 0.012 | 1h | 80 | ||
| NGC 4698 | 0.003 | 2.0 | 20 | ||
| NGC 4941 | 0.004 | 2.0 | 30 | ||
| IRAS 13197-1627 | 0.017 | 1h | 115 | ||
| Cen A | 0.002 | 2.0∗ | 7∗ | ||
| NGC 5135 | 0.014 | 2.0 | 95 | ||
| MCG-06-30-15 | 0.008 | 1.5 | 55 | ||
| NGC 5995 | 0.025 | 1.9 | 170 | ||
| ESO 141-G55 | 0.036 | 1.0 | 240 | ||
| Mrk 509 | 0.034 | 1.5 | 225 | ||
| NGC 7172 | 0.009 | 2.0 | 60 | ||
| NGC 7213 | 0.006 | L | 40 | ||
| 3C 445 | 0.056 | 1.5 | 365 | ||
| NGC 7469 | 0.016 | 1.5 | 110 | ||
| NGC 7674 | 0.029 | 1h | 195 | ||
| NGC 7679 | 0.017 | 2.0 | 115 | ||
| ∗Refer to subsection 2.2 for details. | |||||
2.2 Peculiarities of individual objects
While for most AGN the type and distance have been unambiguously determined, a few objects show significant discrepancies in the literature. Therefore, in the following, we will discuss peculiarities of some individual objects.
NGC 4303: The nucleus of this object is at the borderline between being a Seyfert 2.0 AGN and a LINER galaxy (Filippenko & Sargent 1985). Since it is not evident – although very likely – that the nuclear X-ray source is an AGN, we adopt the classification as a LINER, in contrast to Véron-Cetty & Véron (2006).
NGC 4472: This object was erroneously included in our sample. An X-ray flux taken from the literature turned out to originate in a Ultraluminous X-ray source; the nucleus has not been unambigously detected in the X-rays (but see Maccarone et al. 2003).
Cen A: The redshift of Centaurus A is . In our cosmology this corresponds to a luminosity distance of 7.49 Mpc. However, the recessional movement of the galaxy is mostly peculiar and not due to the Hubble flow. The best available distance estimate toward Cen A is Mpc. It was derived by Rejkuba (2004), using two independent methods: The period-luminosity relation for Mira variables and the luminosity of the tip of the red giant branch. The uncertainty in Cen A’s distance together with – by now outdated – different cosmological parameters have led some authors to overestimate the luminosity of this object by more than one order of magnitude.
3C 445: This Broad Line Radio Galaxy is an interesting case: Sambruna et al. (1998) and Shinozaki et al. (2006) both invoked two different absorbing components to fit their respective X-ray spectra. Moreover, the ratio of optical reddening to hydrogen column density is more than one order of magnitude beneath the galactic value. This indicates an anomalous gas-to-dust ratio (Maiolino et al. 2001). The most recent X-ray observations by Grandi et al. (2007) and Sambruna et al. (2007), again, indicate the presence of multiple absorbing layers with differing covering factors.
NGC 7674: NGC 7674 appears to be a Compton-thick AGN of high luminosity (see Appendix A for details). Strictly speaking, it does not match our target selection criteria as its intrinsic hard X-ray luminosity cannot be inferred with good precision. It is, however an interesting test case in order to check whether the MIR – hard X-ray correlation holds for Compton-thick objects.
NGC 7679: Another interesting object; being of Seyfert type 1.9 (broad Hα line but no broad Hβ) one would expect the X-ray spectrum to show a low-energy cutoff typical for absorbed systems. However, in their analysis Della Ceca et al. (2001) found NGC 7679 to appear as a Seyfert 1 in X-rays. Moreover, they found evidence for a starburst in the nucleus of this object.
3 Observations and data analysis
Our first sample of objects was observed between April and August 2005; details on observing conditions can be found in Paper I. The second sample was observed one year later, between April and August 2006. We used the standard imaging template of VISIR, with parallel chopping and nodding and a chop throw of . In order to get the best possible angular resolution, the small field camera ( / pixel) was used. Bright AGN were observed in three filters in order to allow a reconstruction of their spectral energy distribution (SED) in the MIR. Due to time constraints, faint objects could only be observed in one filter. All observations were executed in service mode with required observing conditions of clear sky and seeing or less. The average airmass was 1.15, with no observation being executed at an airmass above 1.3. Science targets and photometric standards were all observed within 2 h of each other and with a maximum difference in airmass of 0.25. For most observations, however, differences in both time and airmass are much smaller than these values.
Some exposures had to be re-executed due to changing atmospheric conditions. In these cases, for each object only the data obtained under the best conditions were used for our subsequent analysis. A log of these observations is given in Table 3.
| Object | Obs. Date | Filter∗ | FWHM [] | Airmass | Flux | log | ||
| (MM-DD) | STD | Obj | STD | Obj | [mJy] | [erg s-1] | ||
| MCG-01-01-043 | 07-13 | NeII | 0.37 | – | 1.014 | 1.064 | ||
| Mrk 590 | 08-17 | SIV | 0.29 | 0.24 | 1.071 | 1.094 | – | |
| Mrk 590 | 08-17 | PAH2 | 0.30 | 0.27 | 1.073 | 1.094 | – | |
| Mrk 590 | 08-17 | NeII | 0.33 | 0.32 | 1.075 | 1.094 | ||
| NGC 1097 | 08-07 | NeIIref1 | 0.32 | 0.37 | 1.037 | 1.051 | ||
| NGC 4303 | 04-15 | NeIIref1 | 0.40 | – | 1.155 | 1.147 | ||
| NGC 4472 | 04-18 | NeIIref1 | 0.34 | – | 1.171 | 1.238 | ||
| NGC 4507 | 04-15 | SIV | 0.32 | 0.32 | 1.151 | 1.052 | – | |
| NGC 4507 | 04-15 | PAH2 | 0.33 | 0.32 | 1.147 | 1.049 | – | |
| NGC 4507 | 04-15 | NeIIref1 | 0.34 | 0.34 | 1.143 | 1.047 | ||
| NGC 4698 | 04-18 | NeIIref1 | 0.34 | – | 1.171 | 1.196 | ||
| NGC 4941 | 04-19 | NeIIref1 | 0.34 | 0.35 | 1.045 | 1.131 | ||
| IRAS 13197-1627 | 04-09 | SIV | 0.29 | 0.36 | 1.012 | 1.018 | – | |
| IRAS 13197-1627 | 04-09 | PAH2 | 0.32 | 0.38 | 1.012 | 1.021 | – | |
| IRAS 13197-1627 | 04-09 | NeIIref1 | 0.34 | 0.43 | 1.013 | 1.023 | ||
| Cen A | 04-09 | SIV | 0.29 | 0.32 | 1.012 | 1.054 | – | |
| Cen A | 04-09 | PAH2 | 0.32 | 0.36 | 1.012 | 1.055 | – | |
| Cen A | 04-09 | NeIIref1 | 0.34 | 0.35 | 1.013 | 1.056 | ||
| NGC 5135 | 04-09 | NeIIref1 | 0.34 | 0.35 | 1.013 | 1.021 | ||
| MCG-06-30-15 | 04-14 | SIV | 0.30 | 0.32 | 1.110 | 1.034 | – | |
| MCG-06-30-15 | 04-14 | PAH2 | 0.31 | 0.33 | 1.103 | 1.030 | – | |
| MCG-06-30-15 | 04-14 | NeIIref1 | 0.32 | 0.35 | 1.096 | 1.027 | ||
| NGC 5995 | 04-14 | SIV | 0.30 | 0.37 | 1.110 | 1.195 | – | |
| NGC 5995 | 04-14 | PAH2 | 0.33 | 0.37 | 1.022 | 1.181 | – | |
| NGC 5995 | 04-14 | NeII | 0.37 | 0.40 | 1.090 | 1.169 | ||
| ESO 141-G55 | 05-05 | SIV | 0.37 | 0.37 | 1.043 | 1.206 | – | |
| ESO 141-G55 | 05-05 | PAH2 | 0.37 | 0.36 | 1.045 | 1.206 | – | |
| ESO 141-G55 | 05-05 | NeIIref1 | 0.37 | 0.32 | 1.046 | 1.207 | ||
| Mrk 509 | 06-14 | SIV | 0.47 | 0.32 | 1.260 | 1.253 | – | |
| Mrk 509 | 06-14 | PAH2 | 0.39 | 0.33 | 1.282 | 1.270 | – | |
| Mrk 509 | 06-14 | NeII | 0.40 | 0.38 | 1.318 | 1.288 | ||
| PKS 2048-57 | 05-05 | SIV | 0.37 | 0.38 | 1.043 | 1.199 | – | |
| PKS 2048-57 | 05-05 | PAH2 | 0.37 | 0.38 | 1.045 | 1.196 | – | |
| PKS 2048-57 | 05-05 | NeIIref1 | 0.37 | 0.43 | 1.046 | 1.193 | ||
| NGC 7172 | 07-09 | NeIIref1 | 0.37 | 0.35 | 1.187 | 1.188 | ||
| NGC 7213 | 07-14 | SIV | 0.35 | 0.31 | 1.031 | 1.272 | – | |
| NGC 7213 | 07-14 | PAH2 | 0.34 | 0.35 | 1.034 | 1.284 | – | |
| NGC 7213 | 07-14 | NeIIref | 0.32 | 0.32 | 1.040 | 1.298 | ||
| 3C 445 | 07-10 | SIV | 0.29 | 0.31 | 1.147 | 1.129 | – | |
| 3C 445 | 07-10 | PAH2 | 0.30 | 0.32 | 1.147 | 1.135 | – | |
| 3C 445 | 07-10 | NeII | 0.33 | 0.37 | 1.148 | 1.143 | ||
| NGC 7469 | 07-12 | SIV | 0.31 | 0.38 | 1.324 | 1.250 | – | |
| NGC 7469 | 07-12 | PAH2 | 0.33 | 0.41 | 1.334 | 1.243 | – | |
| NGC 7469 | 07-12 | NeIIref1 | 0.34 | 0.37 | 1.344 | 1.237 | ||
| NGC 7674 | 07-13 | NeII | 0.38 | 0.44 | 1.150 | 1.199 | ||
| NGC 7679 | 07-10 | SIV | 0.28 | 0.24 | 1.147 | 1.140 | – | |
| NGC 7679 | 07-10 | PAH2 | 0.30 | 0.18 | 1.147 | 1.143 | – | |
| NGC 7679 | 07-10 | NeIIref1 | 0.32 | 0.41 | 1.147 | 1.146 | ||
| ∗The central wavelengths for the individual filters are m for SIVref1, m for SIV, m for PAH2, | ||||||||
| m for PAH2ref2, m for NeIIref1 and m for NeII. Their transmission curves are shown in the | ||||||||
| VISIR User Manual at http://www.eso.org/instruments/visir/. | ||||||||
We reduced science and standard star frames using the pipeline written by Eric Pantin (private communication) for the VISIR consortium. To eliminate glitches, the pipeline applies a bad pixel mask and removes detector stripes. Subsequently we removed background variations using a 2 dimensional polynomial fit. For objects observed in unstable conditions we treated each nodding cycle separately as the background pattern sometimes changed between two consecutive cycles. The count rate for one full exposure was calculated as the mean of all 3 beams from all nodding cycles of this exposure. As an error estimate we use the standard deviation of these. In order to minimise the effect of residual sky background we chose relatively small apertures ( pixels ) for the photometry and corrected the obtained count rates using the radial profiles of standard stars. Finally we calibrated our photometry using the same standard stars. The conversion factor counts/s / Jy proved to be very stable: for each individual filter, variations were less than 10 % over the whole observing period.
4 Results
4.1 Mid IR properties
Out of the 21 AGN observed with VISIR, 17 were detected. They are all point-like which means the torus remains unresolved. For the 4 non detected objects upper limits were derived by measuring the flux of the largest noise-induced signal and assuming the same PSF as measured for the standard stars. In Table 3 the flux or flux limit and size of the PSF is listed for each object. For sources observed in three filters, we were able to reconstruct their MIR SEDs. For a few objects we find indications for the presence of the m feature, either in emission or in absorption. Looking at our own data and comparing with archival Spitzer spectra, we find that in all cases, at wavelengths longer than m, the feature hardly affects the observed flux level. Possible contamination will be well below 10 %.
In addition to the central point source, in three sources – NGC 1097, NGC 5135, NGC 7469 – we observed clear extra-nuclear MIR emission. In all of these objects we find distinct blobs of star formation (SF), in addition NGC 5135 and NGC 7469 also exhibit a weak diffuse component. Typical distances between SF blobs and the AGN are ( pc) in NGC 1097, ( pc) in NGC 5135 and ( pc) in NGC 7469. In the latter two objects the proximity of the SF components to the AGN does not allow to rule out a significant contribution of SF to the measured flux of the central point source. By comparing the fluxes of individual SF blobs and of the AGN, we can estimate upper limits for such contamination. This yields 15 % for NGC 5135 and 10 % for NGC 7469. These uncertainties have been added to the photometric error and are accounted for in our subsequent statistical analysis.
Details on the morphologies and SEDs of all observed objects will be presented in a forthcoming paper. We should, however, point out that the chopping/nodding technique used for the observations would automatically cancel a contribution from a smooth and diffuse component extending over an area similar to the chopping/nodding throw.
4.2 The mid IR – hard X-ray correlation
In order to analyse the correlation between intrinsic hard X-ray and mid infrared luminosity, for each object we have taken the photometry done closest to our reference wavelength of m in rest frame and then converted to said wavelength by assuming the SED to be flat in this part of the spectrum. This wavelength was chosen as it is close to the peak of the MIR SED in AGN and, in addition, is only affected by emission or absorption in one of the silicate features at m and m if these are particularly strong. Fortunately, there is no indication for such strong silicate features in any observed SED.
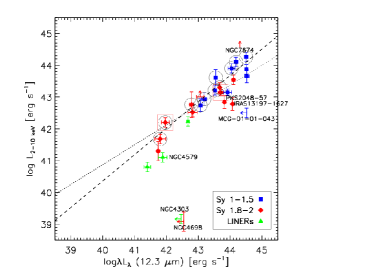
The resulting monochromatic luminosity is plotted versus the intrinsic 2-10 keV luminosity in Fig. 1. The correlation between these two quantities is of high statistical significance; after excluding non-detections and Compton-thick objects, the Spearman rank coefficient (Spearman 1904) is at a significance level of . We can, therefore, safely reject the null hypothesis of no intrinsic correlation. The best power-law fit to the whole sample, excluding NGC 526a and NGC 7314 because of the large inclination angles of their host galaxies and thus consisting of 10 type 1s, 11 type 2s and 4 LINERs, is . For all objects not detected with VISIR, the flux limits are compatible with this correlation, including the two low luminosity objects NGC 4303 and NGC 4698.
It is important to note, that while the extended sample further strengthens the statistical significance of the correlation we had found in our first sample (Paper I), the slope of the correlation has changed considerably. After excluding NGC 4579 due to its peculiar nature, our first sample yielded which is consistent with our new slope at the 3 level. The discrepancy in slope is caused by our first sample being small and containing some objects (i.e. PKS 2048-57) which are off the correlation we find for the enlarged sample. The latter agrees well with the results of the earlier studies by Krabbe et al. (2001) and Lutz et al. (2004).
One concern with correlations between luminosities is that they may be caused by a redshift bias in the data. We tested for this possibility in two ways. First of all, we analysed the formal correlation between MIR and hard X-ray fluxes. The resulting Spearman rank coefficient is at a significance level of 0.01. This means that the correlation is rather weak but, nevertheless, highly significant. Secondly, we tried to reproduce the observed correlation between luminosities with randomly generated mock data. For this, we assumed X-ray and MIR flux values to be uniformly distributed over the range of observed ones, for the distances we tried both a uniform and a normal distribution with no significant change in the result: After generating mock datasets, a rank coefficient of for the MIR – hard X-ray correlation was found with a frequency of less than 0.1 %, a significance level of less than with a frequency of less than 0.15 %. The combination of both results – the high significance of the flux – flux correlation and the low probability of reproducing the obserevd luminosity – luminosity correlation with non-correlated data – implies that we can safely assume the correlation to be real and not caused by a redshift bias in our data.
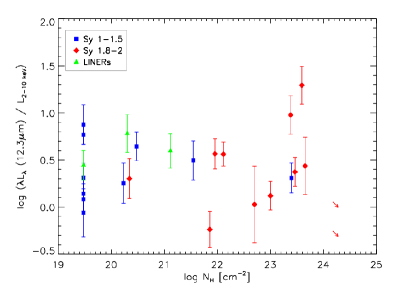
In Fig. 2 we show the luminosity ratio the intrinsic column density toward the AGN. There is no correlation discernible between the two displayed quantities. Neither do we find a significant dependence of the luminosity ratio on Seyfert type: is for type 1s, for type 2s and for the three detected LINERs in our sample. We tested for a possible dependence of luminosity ratio on column density by computing the Spearman rank coefficient for it. With a result of at a significance level of 0.54, we find no evidence for a correlation between the two quantities. Furthermore, we performed a Kolmogorov-Smirnov test for the luminosity ratios of type 1 and type 2 Seyferts. The maximum difference in the cumulative distribution function is 0.2 and the significance level 0.97 which means both samples very likely originate from the same parent distribution. These numbers confirm the result from our first study that type 1s and type 2s follow the same correlation and have the same average luminosity ratio.
5 Discussion
5.1 Contamination
A potential problem for our study is contamination by extra-nuclear emission. This is primarily important in the mid infrared. AGN of moderate to high luminosities should always dominate their hosts in the 2-10 keV band. In the mid infrared, on the other hand, star formation and also Narrow Line Region (NLR) clouds can significantly contribute to the total flux.
First of all, the high angular resolution (see Tables 1 and 2 for the physical scales we resolve) cuts away most of the star formation. The off-nuclear emission we find in three of our objects (see section 4.1) is at distances from the AGN that are resolved even in the most distant objects of our sample. Therefore, we are confident that emission from SF regions does not heavily affect our measurements.
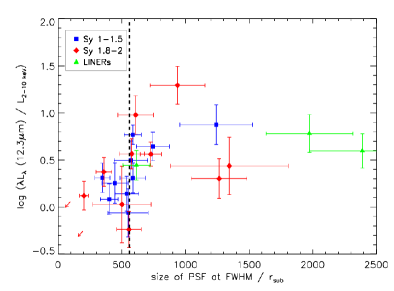
The NLR, however, remains unresolved in most of our sources. The case of NGC 1068 shows that this may be a problem, as very accurate MIR photometry of this object (Galliano et al. 2005) show the NLR clouds to contribute almost 50 % of the nuclear MIR emission. Fortunately, three of our detected sources, namely NGC 4579, NGC 1097 and, most importantly, Cen A, are at comparable or even smaller distances than NGC 1068 and do not show any additional nuclear components. In order to test whether less well resolved sources are affected by extra-nuclear emission, in Fig. 3 we have plotted the MIR / X-ray luminosity ratio over the resolved physical scale, expressed in units of the dust sublimation radius . We here assume the accretion disc’s bolometric luminosity to be which is a typical value for Seyfert galaxies (Vasudevan & Fabian 2007). Interestingly, for observations for which the size of the PSF at FWHM (in pc) is less than , there is no case with , while this is the case for all but two objects with FWHM (pc) . The mean luminosity ratios for the well resolved and the less well resolved sources are and , respectively. This rise indicates that some of our less well resolved sources are, indeed, affected by contamination, despite our high angular resolution.
We have, therefore, recalculated the mid IR – hard X-ray correlation, only using well resolved objects with FWHM (pc) / (encircled objects in Fig. 1). The resulting is in very good agreement with the correlation found for the whole sample. This method allows us to say with some confidence that objects situated close to this fit (dashed line in Fig. 1) are not affected by contamination. Interestingly, for the well resolved sources we find the correlation between the measured fluxes to be much stronger than for the complete sample. Its Spearman rank is and the significance level . This is another indication that these fluxes are mostly free of contamination.
The SF region we find in three of our objects and also Fig. 3 illustrate the need for high angular resolution MIR studies for testing AGN models. Even using 8m-class telescopes, a good sample selection is crucial to avoid contamination by non-AGN emission. Furthermore, this indicates that the high scatter in the mid IR – hard X-ray correlation found by Lutz et al. (2004) may, indeed, be caused by the poor angular resolution of their ISOPHOT data.
Despite the difference in slope we have found in Paper I, we again find NGC 4579 – the object we had excluded from the power-law fit in our first study – to lie off the correlation (see Fig. 1).
5.2 Is the torus clumpy or smooth?
There has been a long-going debate over whether the matter in the obscuring tori in AGN is distributed smoothly (Pier & Krolik 1992) or arranged in clumps (Krolik & Begelman 1988). In Paper I we argued that type 1 and type 2 nuclei having the same ratio, is a strong argument for the torus to be clumpy. This point is strengthened by our current study not only due to the improved number statistics but also due to the larger range of column densities we probe. As discussed in section 4.2, the ratio shows no dependence on – and so over 4 orders of magnitude in (see Fig. 2). Even the two Compton-thick objects in our sample, NGC 5135 and NGC 7674 seem to have roughly the same value of as the rest of our sample. For these objects, however, strong conclusions cannot be drawn, as their X-ray luminosities can only be estimated to an uncertainty of one order or magnitude.
For an optically thick smooth torus, a much higher is expected for Sy 1s than for Sy 2s. Pier & Krolik (1993) expect a difference of one order of magnitude for a change of from cm-2 to cm-2. The reason for this is that in Sy 2s the observer sees the emission from the cold dust in the outer part of the torus, while in Sy 1s one can see its hot inner part as well. This prediction is not compatible with our results.
It is important to note that the similarity between Sy types still holds if we only regard objects with FWHM (pc) / . For these we find to be for type 1s and for type 2s.
Models of clumpy tori (Nenkova et al. 2002; Dullemond & van Bemmel 2005; Hönig et al. 2006) do not predict a difference in between different Sy types. In particular, Hönig et al. (2006), using 3D radiative transfer modelling, showed that clumpy tori can appear as optically thin in the MIR with most of the radiation originating in the innermost part of the torus. In their model individual clouds are optically thick but their volume filling factor is small. Our observational results clearly prefer this kind of models to smooth ones.
Recently, Ramos Almeida et al. (2007) reported to have found a difference in between type 1 and type 2 objects. For their analysis, they use ISOCAM data first published by Clavel et al. (2000) and the X-ray data that was compiled by Lutz et al. (2004). Despite the brightness profile decomposition Ramos Almeida et al. (2007) performed their data may still be heavily contaminated by nuclear star formation. Among our own data, in the two cases of NGC 5135 and NGC 7469 we find that within from the nucleus, SF contributes at least 43 % and 45 % of the total flux at m, respectively. Also the fact that the luminosity ratios Ramos Almeida et al. (2007) derive are larger than what we find for our well resolved objects – and despite their shorter observing wavelength in the IR – indicates that they are probably affected by contamination and the MIR fluxes they report are likely not dominated by torus emission.
5.3 The slope of the correlation and the shape of the torus
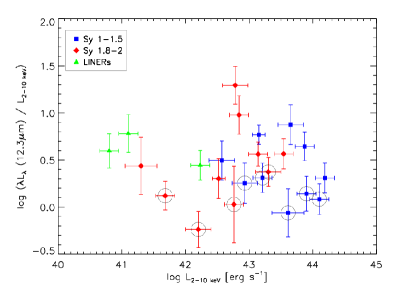
As the mid IR radiation is accretion disc emission reproduced by the dusty torus, and are directly linked to each other via the covering factor of the torus:
| (1) |
Thus, our best-fit result implies . This means that we do not find any dependence of on which is also illustrated by Fig. 4. This result does not match the expectations from the receding torus model (Lawrence 1991) for which Simpson (2005) found the fraction of type 2 AGN to depend on AGN luminosity as for erg s-1. The basic assumption of the unified scenario is that . The dependence derived by Simpson would, thus, yield a correlation which disagrees with the slope we find by more than . Note, however, that we do not probe the Quasar regime of luminosities, i.e. for a break luminosity erg s-1 the receding torus model would, again, agree with our results.
One possibility to reconcile our findings with the obvious dependence of the type 1 fraction on AGN luminosities (Simpson 2005, and references therein) would be that a significant number of Compton-thick AGN at moderate luminosities ( erg s-1) have been missed in hitherto existing X-ray surveys. The existence of a population of Compton-thick AGN has also been suggested by X-ray surveys (e.g. the COSMOS survey, Hasinger et al. 2007), X-ray background synthesis (e.g. Gilli et al. 2007; Gandhi et al. 2007) and IR surveys (Martínez-Sansigre et al. 2005). Very recently, Ueda et al. (2007) randomly selected two AGN out of those first detected by Swift to be observed with Suzaku and found both of them to be highly obscured. This is anoter indication for the existence of a large population of Compton-thick AGN at moderate luminosities.
5.4 Tori at low luminosities?
In paper I we found some indications that a different physical mechanism, other than re-radiation of the accretion disk emission, is dominating the MIR emission in AGN with erg s-1. This matches theoretical predictions that have been published subsequently. Interestingly, the very different models by Elitzur & Shlosman (2006) and Hönig & Beckert (2007) both predict the collapse of the torus below erg s-1. In our new sample, however, the indications for this effect are less pronounced. We do see a tendency for objects with low X-ray luminosities to depart from the MIR – hard X-ray correlation, but this without statistical significance. Thus, while in principle, our approach is well suited to test these predictions, our current sample is not sufficient for this task. Future observations are required to test down to what luminosities the classic picture of AGN can be applied.
6 Conclusions
We have presented new high resolution mid infrared photometry of 17 AGN, increasing our total sample to 25 detected and 4 non-detected objects. We have found angular resolution to be a crucial requirement for our study as poorly resolved sources can be heavily contaminated by non-AGN emission in the mid IR band.
The rest frame m luminosities of our well resolved sources strongly correlate with their rest frame 2-10 keV luminosities , matching the expectations from the unified scenario for AGN. With a probability of 97 %, type 1 and type 2 Seyferts have the same distribution of . This similarity is most probably intrinsic to the AGN and not caused by extra-nuclear emission contaminating the MIR flux. These results have two important implications:
-
•
As we do not find the offset in between type 1s and type 2s, predicted by smooth torus models, AGN tori are likely to be clumpy. The volume filling factor of these clumps has to be small in order to reproduce our results.
-
•
At a level, the slope of the correlation is not compatible with the predictions of the receding torus model by Simpson (2005). We suggest that the break luminosity for this model is higher than hitherto assumed. A population of Compton thick AGN at moderate luminosities being missed in current X-ray surveys could resolve this problem.
The question, whether AGN at low luminosities, with erg s-1 have a qualitatively different appearance than objects of higher luminosities, remains open. Fortunately, we have recently been awarded time to observe a sample of 14 heavily obscured ( cm-2), mostly low luminosity AGN with VISIR which may help to shed light on this issue.
Acknowledgements.
We thank Dr. Sebastian Hönig and Dr. Thomas Beckert for inspiring discussions on the topic of AGN tori. We also thank an anonymous referee for very helpful comments and suggestions. Furthermore, we thank Olivier Garcet for finding and pointing out two typos in our calculations. H.H. acknowledges support from DFG through SFB 439. P.G. is a Fellow of the Japan Society for the Promotion of Science (JSPS). This research made use of the NASA/IPAC Extragalactic Database (NED) which is operated by the Jet Propulsion Laboratory, California Institute of Technology, under contract with the National Aeronautics and Space Administration. This research has made use of the Tartarus (Version 3.2) database, created by Paul O’Neill and Kirpal Nandra at Imperial College London, and Jane Turner at NASA/GSFC. Tartarus is supported by funding from PPARC, and NASA grants NAG5-7385 and NAG5-7067. We acknowledge the usage of the HyperLeda database (http://leda.univ-lyon1.fr).References
- Alonso-Herrero et al. (2002) Alonso-Herrero, A., Ivanov, V. D., Jayawardhana, R., & Hosokawa, T. 2002, ApJ, 571, L1
- Antonucci (1993) Antonucci, R. 1993, ARA&A, 31, 473
- Awaki et al. (2006) Awaki, H., Murakami, H., Ogawa, Y., & Leighly, K. M. 2006, ApJ, 645, 928
- Barthel (1994) Barthel, P. D. 1994, in The First Stromlo Symposium: The Physics of Active Galaxies, ed. G. V. Bicknell, M. Dopita, & P. Quinn, Vol. 54, 175–186
- Bassani et al. (1999) Bassani, L., Dadina, M., Maiolino, R., et al. 1999, ApJS, 121, 473
- Beckert & Duschl (2004) Beckert, T. & Duschl, W. J. 2004, A&A, 426, 445
- Beckmann et al. (2006) Beckmann, V., Gehrels, N., & Shrader, C. R. 2006, ApJ, 638, 642
- Bianchi et al. (2004) Bianchi, S., Matt, G., Balestra, I., Guainazzi, M., & Perola, G. C. 2004, A&A, 422, 65
- Blustin et al. (2002) Blustin, A. J., Branduardi-Raymontand E. Behar, G., Kaastra, J. S., et al. 2002, A&A, 392, 453
- Cappi et al. (2006) Cappi, M., Panessa, F., Bassani, L., et al. 2006, A&A, 446, 459
- Clavel et al. (2000) Clavel, J., Schulz, B., Altieri, B., et al. 2000, A&A, 357, 839
- Dadina (2007) Dadina, M. 2007, A&A, 461, 1209
- Dahari & De Robertis (1988) Dahari, O. & De Robertis, M. M. 1988, ApJS, 67, 249
- Della Ceca et al. (2001) Della Ceca, R., Pellegrini, S., Bassani, L., et al. 2001, A&A, 375, 781
- Dewangan et al. (2004) Dewangan, G. C., Griffiths, R. E., Di Matteo, T., & Schurch, N. J. 2004, ApJ, 607, 788
- Dullemond & van Bemmel (2005) Dullemond, C. P. & van Bemmel, I. M. 2005, A&A, 436, 47
- Ebisawa et al. (2003) Ebisawa, K., Bourban, G., Bodaghee, A., Mowlavi, N., & Courvoisier, T. J. L. 2003, A&A, 411, L59
- Elitzur & Shlosman (2006) Elitzur, M. & Shlosman, I. 2006, ApJ, 648, L101
- Evans et al. (2004) Evans, D. A., Kraft, R. P., Worrall, D. M., et al. 2004, ApJ, 612, 786
- Fabian et al. (2003) Fabian, A. C., Vaughan, S., Nandra, K., et al. 2003, MNRAS, 335, L1
- Filippenko & Sargent (1985) Filippenko, A. V. & Sargent, W. L. W. 1985, ApJS, 57, 503
- Galliano et al. (2005) Galliano, E., Pantin, E., Alloin, D., & Lagage, P. O. 2005, MNRAS, 363, L1
- Gallo (2006) Gallo, L. C. 2006, MNRAS, 368, 479
- Gallo et al. (2006) Gallo, L. C., Lehmann, I., Pietsch, W., et al. 2006, MNRAS, 365, 688
- Gandhi et al. (2007) Gandhi, P., Fabian, A. C., Suebsuwong, T., et al. 2007, MNRAS, in press
- Georgantopoulos & Papadakis (2001) Georgantopoulos, I. & Papadakis, I. E. 2001, MNRAS, 322, 218
- Gilli et al. (2007) Gilli, R., Comastri, A., & Hasinger, G. 2007, A&A, 463, 79
- Gondoin et al. (2001) Gondoin, P., Lumb, D., Siddiqui, H., Guainazzi, M., & Schartel, N. 2001, A&A, 373, 805
- Gondoin et al. (2003) Gondoin, P., Orr, A., & Lumb, D. 2003, A&A, 398, 967
- González-Martín et al. (2006) González-Martín, O., Masegosa, J., Márquez, I., Guerrero, M. A., & Dultzin-Hacyan, D. 2006, A&A, 460, 45
- Grandi et al. (2003) Grandi, P., Fiocchi, M., Perola, C. G., et al. 2003, ApJ, 593, 160
- Grandi et al. (2007) Grandi, P., Guainazzi, M., Cappi, M., & Ponti, G. 2007, MNRAS, 381, L21
- Hasinger et al. (2007) Hasinger, G., Cappelluti, N., Brunner, H., et al. 2007, ApJS, 172, 29
- Heckman et al. (2005) Heckman, T. M., Ptak, A., Hornschemeier, A., & Kauffmann, G. 2005, ApJ, 634, 161
- Ho et al. (2001) Ho, L. C., Feigelson, E. D., Townsley, L. K., et al. 2001, ApJ, 549, L51
- Hönig & Beckert (2007) Hönig, S. F. & Beckert, T. 2007, MNRAS, 380, 1172
- Hönig et al. (2006) Hönig, S. F., Beckert, T., Ohnaka, K., & Weigelt, G. 2006, A&A, 452, 459
- Horst et al. (2006) Horst, H., Smette, A., Gandhi, P., & Duschl, W. J. 2006, A&A, 457, L17
- Iyomoto et al. (1996) Iyomoto, N., Makishima, K., Fukazawa, Y., et al. 1996, PASJ, 48, 231
- Jiang et al. (2006) Jiang, P., Wang, J. X., & Wang, T. G. 2006, ApJ, 644, 725
- Jiménez-Bailón et al. (2003) Jiménez-Bailón, E., Santos-Lleó, M., Mas-Hesse, J. M., et al. 2003, ApJ, 593, 127
- Krabbe et al. (2001) Krabbe, A., Böker, T., & Maiolino, R. 2001, ApJ, 557, 626
- Kraemer et al. (2004) Kraemer, S. B., George, I. M., Crenshaw, D. M., & Gabel, J. R. 2004, ApJ, 607, 794
- Krolik & Begelman (1988) Krolik, J. H. & Begelman, M. C. 1988, ApJ, 329, 702
- Landi et al. (2001) Landi, R., Bassani, L., Malaguti, G., et al. 2001, A&A, 379, 46
- Lawrence (1991) Lawrence, A. 1991, MNRAS, 252, 586
- Lawson & Turner (1997) Lawson, A. J. & Turner, M. J. L. 1997, MNRAS, 288, 920
- Lee et al. (2001) Lee, J. C., Ogle, P. M., Canizares, C. R., et al. 2001, ApJ, 554, L13
- Levenson et al. (2004) Levenson, N. A., A.Weaver, K., Heckman, T. M., Awaki, H., & Terashima, Y. 2004, ApJ, 602, 135
- Longinotti et al. (2007) Longinotti, A. L., Binachi, S., Santos-Lleó, M., et al. 2007, astro-ph, 0701180
- Lutz et al. (2004) Lutz, D., Maiolino, R., Spoon, H. W. W., & Moorwood, A. F. M. 2004, A&A, 418, 465
- Maccarone et al. (2003) Maccarone, T. J., Kundu, A., & Zepf, S. E. 2003, ApJ, 586, 814
- Maiolino et al. (2001) Maiolino, R., Marconi, A., Salvati, M., et al. 2001, A&A, 365, 28
- Maiolino et al. (1998) Maiolino, R., Salvati, M., Bassani, L., et al. 1998, A&A, 338, 781
- Malaguti et al. (1998) Malaguti, G., Palumbo, G. G. C., Cappi, M., et al. 1998, A&A, 331, 519
- Malizia et al. (1997) Malizia, A., Bassani, L., Stephen, J. B., Malaguti, G., & Palumbo, G. G. C. 1997, ApJS, 113, 311
- Martínez-Sansigre et al. (2005) Martínez-Sansigre, A., Rawlings, S., Lacy, M., et al. 2005, Nature, 436, 666
- Miniutti et al. (2007a) Miniutti, G., Fabian, A. C., Anabuki, N., et al. 2007a, PASJ, 59, 315
- Miniutti et al. (2007b) Miniutti, G., Ponti, G., Dadina, M., Cappi, M., & Malaguti, G. 2007b, MNRAS, 375, 227
- Nemmen et al. (2006) Nemmen, R. S., Storchi-Bergmann, T., Yuan, F., et al. 2006, ApJ, 643, 652
- Nenkova et al. (2002) Nenkova, M., Ivezic, Z., & Elitzur, M. 2002, ApJ, 570, L9
- Panessa & Bassani (2002) Panessa, F. & Bassani, L. 2002, A&A, 394, 435
- Panessa et al. (2006) Panessa, F., Bassani, L., Cappi, M., et al. 2006, A&A, 455, 173
- Paturel et al. (2003) Paturel, G., Petit, C., Prugniel, P., et al. 2003, A&A, 412, 45
- Pier & Krolik (1992) Pier, E. A. & Krolik, J. H. 1992, ApJ, 399, L23
- Pier & Krolik (1993) Pier, E. A. & Krolik, J. H. 1993, ApJ, 418, 673
- Ramos Almeida et al. (2007) Ramos Almeida, C., Pérez García, A. M., Acosta-Pulido, J. A., & Rodríguez Espinosa, J. M. 2007, AJ, 134, 2006
- Rejkuba (2004) Rejkuba, M. 2004, A&A, 413, 903
- Revnivtsev et al. (2004) Revnivtsev, M., Sazonov, S., Jahoda, K., & Gilfanov, M. 2004, A&A, 418, 927
- Reynolds et al. (2004) Reynolds, C. S., Brenneman, L. W., Wilms, J., & Kaiser, M. E. 2004, MNRAS, 352, 205
- Reynolds et al. (1997) Reynolds, C. S., Ward, M. J., Fabian, A. C., & Celotti, A. 1997, MNRAS, 291, 403
- Risaliti (2002) Risaliti, G. 2002, A&A, 386, 379
- Risaliti et al. (2002) Risaliti, G., Elvis, M., & Nicastro, F. 2002, ApJ, 571, 234
- Sambruna et al. (1998) Sambruna, R. M., George, I. M., Mushotzky, R. F., Nandra, K., & Turner, T. J. 1998, ApJ, 495, 749
- Sambruna et al. (2007) Sambruna, R. M., Reeves, J. N., & Braito, V. 2007, ApJ, 665, 1030
- Scott et al. (2005) Scott, J. E., Kriss, G. A., Lee, J. C., et al. 2005, ApJ, 634, 193
- Shinozaki et al. (2006) Shinozaki, K., Miyaji, T., Ishisaki, Y., Ueda, Y., & Ogasaka, Y. 2006, AJ, 131, 2843
- Simpson (2005) Simpson, C. 2005, MNRAS, 360, 565
- Soldatenkov et al. (2003) Soldatenkov, D. A., Vikhlinin, A. A., & Pavlinsky, M. N. 2003, AstL, 29, 298
- Spearman (1904) Spearman, C. 1904, AJP, 15, 72
- Spergel et al. (2006) Spergel, D. N., Bean, R., Doré, O., et al. 2006, astro-ph, 0603449
- Starling et al. (2005) Starling, R. L. C., Page, M. J., Branduardi-Raymont, G., et al. 2005, MNRAS, 356, 727
- Steenbrugge et al. (2003) Steenbrugge, K. C., Kaastra, J. S., Blustin, A. J., et al. 2003, A&A, 408, 921
- Tanaka et al. (1989) Tanaka, Y., Nandra, K., Fabian, A. C., et al. 1989, Nature, 375, 659
- Terashima et al. (2002) Terashima, Y., Iyomoto, N., Ho, L. C., & Ptak, A. F. 2002, ApJS, 139, 1
- Terashima et al. (1998) Terashima, Y., Kunieda, H., Misaki, K., et al. 1998, ApJ, 503, 212
- Tully (1988) Tully, R. B. 1988, Nearby Galaxies Catalog (Cambridge, UK: Cambridge University Press)
- Turner et al. (1997) Turner, T. J., George, I. M., Nandra, K., & Mushotzky, R. F. 1997, ApJ, 113, 23
- Ueda et al. (2007) Ueda, Y., Eguchi, S., Terashima, Y., et al. 2007, ApJ, 664, L79
- Urry & Padovani (1996) Urry, C. M. & Padovani, P. 1996, PASP, 107, 803
- Vasudevan & Fabian (2007) Vasudevan, R. V. & Fabian, A. C. 2007, MNRAS, accepted
- Véron-Cetty & Véron (2006) Véron-Cetty, M.-P. & Véron, P. 2006, A&A, 455, 773
- Yaqoob & Padmanabhan (2004) Yaqoob, T. & Padmanabhan, U. 2004, ApJ, 604, 63
- Zhou & Wang (2005) Zhou, X.-L. & Wang, J.-M. 2005, ApJ, 618, L83
Appendix A X-ray properties of individual objects
A.1 X-ray data for the P75 sample
Fairall 9: With XMM-Newton, Gondoin et al. (2001) measured a hard X-ray flux of erg s-1 cm-2. From the compilation of earlier measurements shown in their paper, we can estimate the peak-to-peak variability / uncertainty to be of the order of 2. Yaqoob & Padmanabhan (2004) report a flux of erg s-1 cm-2., obtained with Chandra. Within errors, this is still consistent with Gondoin et al.’s measurement. From these fluxes and the reported hydrogen column density of cm-2, we calculate a luminosity of erg s-1.
NGC 526A: For this object, unfortunately, no observations with Chandra or XMM-Newton have been published. Using BeppoSAX, Landi et al. (2001) measured erg s-1 cm-2, absorbed by cm-2. Another observation of NGC 526A with the RXTE satellite has been performed by Revnivtsev et al. (2004). Extrapolating their 2-9 keV count rate yields erg s-1 cm-2. Both observations are consistent with each other if we assume an uncertainty of 0.2 dex. The resulting luminosity is erg s-1.
NGC 3783: This object was observed with XMM-Newton by Blustin et al. (2002) who report an intrinsic flux of erg s-1 cm-2 which corresponds to erg s-1. The galactic absorption toward NGC 3783 is cm-2. The intrinsic warm absorption can be ignored for our purpose as it hardly affects the 2-10 keV band. Variability of this source is indicated by comparing the flux given above to the one reported by Malizia et al. (1997) ( erg s-1) which is about five times higher. Due to the higher quality of their data, we will use the results from Blustin et al. (2002) and allow for a variability / uncertainty of 0.3 dex.
NGC 4579: This object has been observed multiple times (Terashima et al. 1998; Ho et al. 2001; Dewangan et al. 2004; Cappi et al. 2006) with most of the results being in good agreement with each other. We here adopt the results of Cappi et al. – erg s-1, cm-2 – which were obtained with XMM-Newton. The luminosity stated by Dewangan et al. (2004) is lower by factor of 10. This, however, seems to be a typographical error as all measured fluxes are consistent. A statistical uncertainty of 0.3 dex is assumed to account for the different results on among the other authors.
NGC 4593: The two most reliable data sets for this object are from Reynolds et al. (2004) and Shinozaki et al. (2006), both obtained with XMM-Newton. They agree within errors. We adopt the values provided by Shinozaki et al.: cm-2 and erg s-1. Steenbrugge et al. (2003) observed NGC 4593 with both XMM-Newton and Chandra. While the Chandra result ( erg s-1) is in good agreement with the one cited above, the luminosity measured with XMM-Newton was higher ( erg s-1). This may be due to intrinsic variability of the source. We can account for this with an uncertainty of 0.4 dex.
PKS 2048-57: Risaliti et al. (2002), observing with ASCA, inferred cm-2 and erg s-1 cm-2, the latter yielding erg s-1. An independent analysis of archival ASCA data by Heckman et al. (2005) yields erg s-1, after conversion to our Cosmology. These results are consistent if we consider variability of the source: Georgantopoulos & Papadakis (2001) report a flux variation by a factor of almost two within one week of observation. For our study we use the results by Risaliti et al., allowing for a luminosity uncertainty of 0.4 dex.
PG 2130+099: Lawson & Turner (1997) find this object to be unabsorbed and emit erg s-1 cm-2 and thus erg s-1. More recently, Gallo (2006) observed PG 2130+099 with XMM-Newton and obtained erg s-1 cm-2. Using the luminosity value from Lawson & Turner and assume an uncertainty of 0.4 dex, this is in good agreement with Gallo’s result.
NGC 7314: This object was observed with XMM-Newton by Shinozaki et al. (2006). After converting their result to our Cosmology, we get erg s-1 and a column density of cm-2. Older observations by Malizia et al. (1997); Turner et al. (1997); Risaliti (2002); Risaliti et al. (2002) and Kraemer et al. (2004) are in good agreement with these numbers if one accounts for the different cosmological parameters used.
A.2 X-ray data for the P77 sample
MCG-01-01-43: This object was observed with ASCA by Turner et al. (1997). They report cm-2 and a luminosity that – corrected for the different Cosmologies used – translates to erg s-1. This measurement is backed up by INTEGRAL observations (Ebisawa et al. 2003) where JEM-X measures erg s-1 cm-2. This yields erg s-1.
Mrk 590: With XMM-Newton, Gallo et al. (2006) estimated a 2-10 keV luminosity which, in our Cosmology, yields erg s-1. This is in good agreement with the results of a combined Chandra and XMM-Newton programme by Longinotti et al. (2007) ( erg s-1). Shinozaki et al. (2006), on the other hand, having observed Mrk 590 with XMM-Newton as well, report a luminosity of erg s-1 (after conversion to our Cosmology). Here, we will use Longinnotti et al.’s result and allow for an uncertainty of 0.5 dex.
NGC 1097: Iyomoto et al. (1996) observed this object with ASCA and retrieved cm-2 and erg s-1 cm-2, the latter corresponding to erg s-1. Nemmen et al. (2006) observed NGC 1097 with Chandra and report cm-2 and erg s-1 cm-2. We will adopt these results for our analysis.
NGC 4303: This low-luminosity AGN was observed by Jiménez-Bailón et al. (2003), using the Chandra telescope. The nuclear source does not show intrinsic absorption, thus the galactic value of cm-2 is adopted. The unabsorbed flux is erg s-1 cm-2. This corresponds to a luminosity of erg s-1. Note, that Jiménez-Bailón et al. (2003) cannot exclude the possibility that the nuclear X-ray source of NGC 4303 is a binary system instead of an AGN. They come, however, to the conclusion that this is unlikely.
NGC 4472: This object, unfortunately, has not been detected in the hard X-ray band so far. The most stringent upper limit to its flux is from Panessa et al. (2006): erg s-1 cm-2. The corresponding luminosity limit is erg s-1. This is in agreement with the detection in the soft band by Soldatenkov et al. (2003) who measured erg s-1. Whether this source is dominated by a star-burst or suffers from Compton-thick absorption is still under investigation.
NGC 4507: For this object the estimates for the hydrogen column density vary significantly. An average value is the one estimated by Bassani et al. (1999): cm-2. The resulting absorption-corrected flux is erg s-1 cm-2. This yields erg s-1; we assume an uncertainty of 0.3 dex – this also matches the variability observed by Georgantopoulos & Papadakis (2001).
NGC 4698: Three Chandra observations of this object have been published, by Cappi et al. (2006); González-Martín et al. (2006) and Panessa et al. (2006). Cappi et al. report cm-2 and erg s-1. If we use the distance to NGC 4698 from Tully (1988) which was also used by Cappi et al. the flux measurements by Panessa et al. and González-Martín et al. yield erg s-1 and erg s-1, respectively. As all three observations seem to be of comparable quality we adopt a mean luminosity of erg s-1 and an uncertainty of 0.6 dex.
NGC 4941: Maiolino et al. (1998) present BeppoSAX observations of this object. Their best fit results are cm-2 and erg s-1. Risaliti (2002) complements the BeppoSAX data with ASCA observations. From these he draws the conclusion that the absorbing column is actually Compton-thick. Terashima et al. (2002) also find cm-2 and attribute the difference between their and Maiolino et al.’s result to variability of the absorbing column. We therefore consider the uncertainty of Maiolino et al.’s result to be large and assume 0.6 dex for the luminosity.
IRAS 13197-1627: The most recent X-ray observation, using XMM-Newton is by Miniutti et al. (2007b). They report a hydrogen column density of cm-2. If we convert the absorption-corrected luminosity they infer to our Cosmology we get erg s-1. Miniutti et al. also estimate the true intrinsic luminosity of the AGN by multiplying the reflection fraction. After correcting for the different Cosmologies it is erg s-1. The first value is also consistent with erg s-1 as resulting from the flux reported by Bassani et al. (1999) – even though these authors assumed a much higher column density of cm-2. For our further analysis we will adopt Miniutti et al.’s absorption-corrected luminosity and take the conservative assumption of an uncertainty of 0.4 dex.
Cen A: Observations with Chandra and XMM-Newton by Evans et al. (2004) yield an absorbing column of cm-2 and an intrinsic luminosity of erg s-1 with a peak-to-peak variability by a factor of . This is consistent with older estimates by Grandi et al. (2003) ( erg s-1 cm-2, yielding erg s-1) and Risaliti (2002) ( cm-2). We adopt the luminosity from Evans et al. and the absorbing column density from Risaliti.
NGC 5135: Levenson et al. (2004) observed NGC 5135 with Chandra. They find cm-2. From the flux of the Iron K line they estimate the intrinsic hard X-ray luminosity to be erg s-1. To account for the high uncertainty of the luminosity estimate, we will set it to 1.0 dex.
MCG-06-30-15: This source has been extensively studied due to its prominent, relativistically-broadened Iron K line (e.g. Tanaka et al. 1989; Fabian et al. 2003). A dusty warm absorber with an equivalent neutral column density of a few cm-2 is known to be present (Reynolds et al. 1997; Lee et al. 2001). Extrapolating the latest 3–45 keV Suzaku X-ray data (Miniutti et al. 2007a) to 2–10 keV results in an intrinsic power-law luminosity of erg s-1. The source is known to vary significantly; we have thus used time-averaged measurements for the above calculation, and also assign a variability / uncertainty of 0.4 dex. This is also consistent with an INTEGRAL/JEM-X measurement by Beckmann et al. (2006).
NGC 5995: This object was observed by Panessa & Bassani (2002), using the ASCA satellite. They find cm-2 and (after conversion to our Cosmology) erg s-1.
ESO 141-G55: This object was observed with XMM-Newton by Gondoin et al. (2003). They find the absorption to be Galactic with cm-2. After we correct the luminosity they determine for the slightly different redshift and cosmological parameters we use, we end up with erg s-1.
Mrk 509: Shinozaki et al. (2006) observed this AGN with XMM-Newton and find an intrinsic absorption of cm-2 and (after correcting for slightly different Cosmology and redshift) erg s-1. A Chandra observation by Yaqoob & Padmanabhan (2004) yields compatible results.
NGC 7172: Intrinsic luminosity and column density estimates for this source show a surprising range of variation. From BeppoSAX observations, Dadina (2007) infers cm-2 (although this seems to be underestimated by a factor of 100 due to a typographical error) and erg s-1 cm-2, yielding erg s-1. Awaki et al. (2006) on the other hand report cm-2 and erg s-1. Risaliti et al. (2002) compiled observations of NGC 7172 that had been executed between 1985 and 1997. Column densities range between cm-2 and absorption corrected fluxes between erg s-1 cm-2 with a weak trend toward lower fluxes with time. For our study we adopt the results of Awaki et al. as they are intermediate ones. A high variability of NGC 7172 in the hard X-ray band has been observed by Georgantopoulos & Papadakis (2001) who report a flux variation by a factor of within one week of observation. To account for this we set the uncertainty to 0.8 dex.
NGC 7213: This object has been observed repeatedly by X-ray satellites. The most recent results have been reported by Starling et al. (2005) from XMM-Newton observations (Galactic cm-2, erg s-1), Zhou & Wang (2005), reanalysing archival XMM-Newton data ( erg s-1 and Bianchi et al. (2004) who performed simultaneous observations with XMM-Newton and BeppoSAX ( cm-2, erg s-1). The agreement of these studies is very good. We will use the arithmetic mean of these three luminosity estimates.
3C 445: The three most recent observations of 3C 445 were all carried out with XMM-Newton; Shinozaki et al. (2006) measured cm-2 and – in our Cosmology – erg s-1. Grandi et al. (2007) find cm-2 and an unabsorbed flux of erg s-1 cm-2 which translates to erg s-1. The observations by Sambruna et al. (2007) yield cm-2 and, after conversion to our Cosmology, erg s-1. Given the complexity of the source, these numbers agree very well. We therefore use the mean values.
NGC 7469: From XMM-Newton observations Zhou & Wang (2005) derive a luminosity of erg s-1. NGC 7469 was also observed with Chandra by Jiang et al. (2006) who find a purely Galactic absorption of cm-2. After correcting for the different Cosmology we use as well as for a slightly different redshift, the luminosity they estimate, translates to erg s-1. This is in good agreement with the result of Zhou & Wang. Scott et al. (2005) observed this object simultaneously in the X-rays and UV domains with Chandra, FUSE and STIS. They do not state a 2-10 keV flux in their paper. However, using the power law model shown in their figure 1, we derive erg s-1 cm-2. This, in turn, yields erg s-1. As these three observations agree very well with each other, we will use the mean luminosity and set the uncertainty to 0.2 dex.
NGC 7674: This object appears to be Compton-thick. Malaguti et al. (1998) suggest an intrinsic luminosity of erg s-1. For their estimate they assume the electron scattering material to have the same geometry as in the prototypical Seyfert 2 galaxy NGC 1068. Correcting for the different Cosmology they use, decreases this number to erg s-1. Another way to estimate the intrinsic 2-10 keV luminosity is via the correlation between the [O III]λ5007 and 2-10 keV fluxes that was found by Panessa et al. (2006): . Dahari & De Robertis (1988) measured a flux of erg s-1 cm-2. Bassani et al. (1999) corrected this result for intrinsic absorption and obtained erg s-1 cm-2 with which, in turn, we obtain erg s-1. This result is in good agreement with the estimate by Malaguti et al., especially regarding the somewhat speculative nature of both methods. However, Bassani et al.’s absorption correction of the [O III]λ5007 flux may suffer from the large slit () Dahari & De Robertis (1988) used. If the Balmer decrement was affected by off-nuclear emission, the reddening could easily be underestimated. In a private communication to Malaguti et al. (1998), R. Maiolino reports erg s-1. In the cosmology used by Malaguti et al., this corresponds to a [O III]λ5007 line flux of erg s-1 cm-2. This, in turn, yields erg s-1, i.e. a source that is two orders of magnitude brighter than estimated by Malaguti et al. For our analysis we will use the more conservative luminosity estimate of Malaguti et al. and Bassani et al. by using the average of their estimates and allowing for an uncertainty of 1 order of magnitude. An even higher luminosity, however, can clearly not be ruled out.
NGC 7679: The only available recent hard X-ray data of this object seem to be the ones from Della Ceca et al. (2001) who use ASCA and BeppoSAX data. Their analysis yields cm-2 and erg s-1 cm-2, the latter corresponding to erg s-1.