Stages of Homogeneous Nucleation in Solid Isotopic Helium Mixtures
Abstract
We have made pressure and NMR measurements during the evolution of phase separation in solid helium isotopic mixtures. Our observations indicate clearly all three stages of the homogeneous nucleation – growth process: 1) creation of nucleation sites; 2) growth of the new-phase component at these nucleation sites; and 3) coarsening: the dissolution of sub-critical droplets with the consequent further late-stage growth of the super-critical droplets. The time exponent for the coarsening, , is consistent with the conserved order parameter Lifshitz-Slezov evaporation-condensation mechanism.
pacs:
67.80.Jd 68.35.RhNucleation and phase separation in binary mixtures are central to the understanding of phenomena ranging from the strength of metallic alloysMcKie and McKie (1974) to the properties of polymersCabral et al. (2002) and they provide examples of first-order phase transitions with a rich parameter space. While second-order transitions are relatively well-understood, with universality classes for both static and dynamical critical behaviourHohenberg and Halperin (1977), the situation is not so clear in the first-order case. The nature of the order parameter is of vital importance; in particular the kinetics will depend crucially on whether the order parameter is is conserved or notMazenko et al. (1985). It has been proposed that scaling concepts may be as useful in the study of first-order transitions as they have proved to be in the second-order caseMazenko et al. (1985). Universality in late-stage ‘coarsening’ and evidence for scaling of the structure factor have been demonstrated theoreticallyKatano and Iizumi (1984), but other questions remain openOnuki (2002).
Phase separation in solid helium mixtures is an example of a first-order transition with a conserved order parameter (COP). This system is attractive because the segregation process occurs on an accessible time scale: slower that that in fluids, but faster than that in conventional solids. This is a consequence of the unique nature of the atomic motion in solid helium where quantum exchange results in a temperature-independent diffusion coefficient, intermediate between that of a solid and a liquidBennemann and Ketterson (1976).
In a first-order phase transition, fluctuations provide the energy to surmount the barrier separating the initial and evolving phases. This is the nucleation-growth scenario of Cahn and HilliardCahn and Hilliard (1958), extended by othersLifshitz and Slezov (1959); Slezov and Schmelzer (1997). The barrier height is determined by a balance between surface and volume energies, and this gives a critical droplet size. Embryos larger than this critical size are stable and grow. This leads to the identification of three distinct stages of the nucleation-growth processSlezov and Schmelzer (1997): 1) creation of nucleation sites or embryos; 2) growth of the new-phase component at these sites at the expense of the background matrix; and 3)‘coarsening’ of the super-critical droplets at the expense of the dissolving sub-critical droplets when the background matrix is strongly depleted. In our system the timescales are such that all three stages may be identified distinctly.
Most experimental research on phase separation has been performed on metallic alloys and in polymer mixtures. The Al-Zn alloy has been studied by Mainville et al.Mainville et al. (1997) using small-angle x-ray scattering on critical mixtures. And the surface of polymer mixtures has been studied by the Higgins group using light scattering, neutron scattering and atomic force microscopyCabral et al. (2002). Late-stage coarsening of crystallizing biological macromolecules has been observed by Ng et al.Ng et al. (1996), with a time scale of three to four months.
Previous workPenzev et al. (2002); Smith et al. (2003) has demonstrated the initial stages of phase separation in high quality crystals of solid helium mixtures. In this Letter we report the first observation of all three stages of homogeneous nucleation and growth in this COP system. The three stages of the nucleation-growth process have been observed in the magnetic ordering of Cu3Au alloyNagler et al. (1988). However that is a non-conserved order parameter (NCOP) system with, correspondingly, different kinetics.
Our experimental approach involves the use of two powerful tools: NMR and high precision pressure measurements, both utilized during step-wise cooling through the transition allowing the observation of phase separation in real time. 3He NMR exploits the dependence of the spin-lattice and spin-spin relaxation times and on 3He concentrationGreenberg et al. (1972). The relaxation times depend on the strength of the inter-nuclear dipolar fields and on their time modulationCowan (1997).
The signature of two evolving phases, due to phase separation, is the appearance of two components in measurements of both and . Each relaxation profile is well-described by a double exponential form, allowing the proportions of the two evolving phases to be inferred. Further, in the presence of a magnetic field gradient, measurements of bounded diffusion within the concentrated phase allows determination of both the spin diffusion coefficient and the size of the droplets during the separation process. The minimum droplet size that may be determined in this way scales with , the numerical coefficient depending upon instrumentation details. In our experiments, for the liquid droplets discussed here , while for solid droplets with a smaller diffusion coefficient Smith et al. (2003).
Phase separation at constant volume results in a pressure increase, a consequence of the excess volumeMullin (1968) associated with nonlinearity of the mixture molar volume as a function of composition. The sample pressure is measured by a capacitative strain gauge, providing in principle a continuous record of the phase separation following a cooling step and a determination of the characteristic time constant of the process.
Studies of homogeneous nucleation were performed on 1%, 2%, 7% and 50% 3He mixtures. All stages of homogeneous nucleation were investigated at 2% and we concentrate on these results here. At this concentration there there is a large accessible meta-stable region of the phase diagram, allowing an appreciable temperature quench without entering the spinodal regionEdwards and Balibar (1989). (By contrast there is no meta-stable region at 50% concentration; there we have observed phase separation by spinodal decompositionPoole et al. (2006)). The crystal was grown at a pressure of 28 bar, corresponding to a molar volume of 20.9 cm3. At this pressure the temperature at which phase separation starts was found to be 295 mK and new-phase regions form as 3He-rich liquid droplets. In order to ensure good crystallographic quality the crystal was grown at constant pressure; x-ray measurements have shown this method to produce crystals of high qualityFraass and Simmons (1987). The procedure, together with other experimental details have been described previouslySmith et al. (2003). We studied this crystal in two separate cooling cycles. In the first we lowered the temperature from above the transition in small steps of 510mK; in the second we quenched in one step to 100mK.
Homogeneous nucleation in a uniform supersaturated mixture proceeds through the formation of clusters of the new phase at random sites. If the number of particles in a cluster is smaller than the critical value then it is unstable and it decays. When , however, it grows. For a spherical cluster is given bySmith et al. (2003); Slezov and Schmelzer (1997)
| (1) |
where is the initial 3He concentration of the mixture, is the concentration at the final temperature and
| (2) |
Here is the surface tension at the cluster boundary, is the inter-atomic distance and is Boltzmann’s constant. In our first step through the transition will be about 40, corresponding to , too small to observe by NMR methods.
The nucleation rate is a very rapid function of the degree of supersaturation. As a consequence the formation of new nuclei occurs only in the early part of the phase separation process. This results in a maximal cluster concentration (per site) during a cooling step given bySlezov and Schmelzer (1997)
| (3) |
The subsequent growth of new-phase droplets occurs by diffusion of 3He atoms, through the background matrix, to the droplets. The characteristic time for this growth process is
| (4) |
where is the diffusion coefficient of the 3He in the matrix.
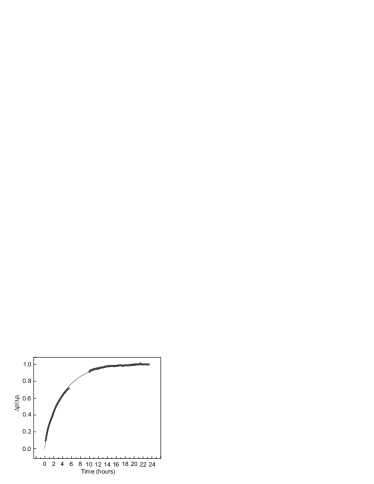
In the step-wise cooling experiment we lowered the temperature from above the transition in 510 mK steps: 295.0 mK, 290.0 mK, 285.3 mK, 280.4 mK, 275.8 mK, 270.2 mK,… down to 150.0 mK. We monitored the pressure increase following each step; an example is shown in Fig. 1. The line through the points is an exponential relaxation fit, from which the time constant for evolution may be found. From knowledge of , using Eq. (4), the density of nuclei produced during the step may be found. Here is determined from the phase diagram profileEdwards and Balibar (1989) and the diffusion coefficient of the 3He in the 4He background is known from Grigor’ev et al.Grigor’ev (1997); Ganshin et al. (1999). These calculations are similar to those in our work on solid dropletsSmith et al. (2003); further details are provided there.
The treatment is based upon the assumption that the total volume of the new-phase droplets is sufficiently small that it has negligible effect on the degree of supersatuation. This allows a ‘linear’ approach to the kinetics of the process where the growth of a droplet is independent of the state of the others.
We found that the majority of droplets were nucleated in steps 2 and 3; in the second step there were droplets per site produced, while in the third step there were produced. In each of the later steps there were less than produced. In this way we have identified the first stage of the separation process during these earlier steps.
During the latter steps the number of 3He atoms in the concentrated phase is observed by NMR to increase, as decreases in accordance with the phase diagram profile. However since we have established that there are negligible new droplets nucleating, we conclude that the existing droplets continue to grow. Thus we identified the second stage of the nucleation-growth process.
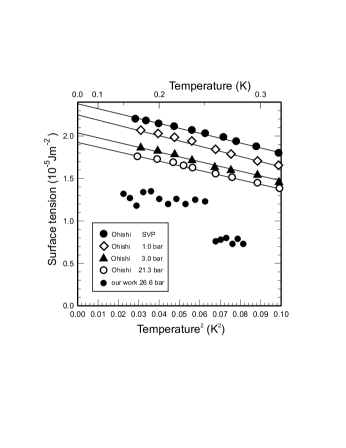
Once is known one may determine the droplet surface tension at each temperature by solving Eq. (3) for and then using Eq. (2) to find . The result is that the surface tension of the liquid droplets is found to be of order J m-2; values for different temperatures are shown in Fig. 2. These values are consistent with the inter-phase surface tension measurements in phase-separated bulk liquid helium solutions of Ohishi et al.Ohishi et al. (1998) (at lower pressures), also shown in the figure. At low temperatures the data tend towards the dependence, in accordance with Fermi Liquid theory. The jump in the points at 255 mK corresponds to a structural transition in the background matrixEdwards and Balibar (1989), from bcc at higher temperatures to hcp at lower temperatures. The larger value of is consistent with the greater number of surrounding atoms in the denser hcp phase.
An independent measure of droplet concentration is provided by the droplet size inferred by NMR. At low temperatures, when all the 3He resides in the droplets, the droplet diameter was determined to be m. Then for a 2% initial 3He concentration this would indicate a total droplet concentration of . Now the total droplet concentration determined by pressure measurements is the sum of those from each step, giving . This evaluation supports the inference that nucleation occurs in the first few steps. Precise numerical agreement is precluded by uncertainties about the shape of droplets. The inferred spin-diffusion coefficient of the 3He liquid droplets and its temperature dependence are in good agreement with those of the bulk liquid.
The size of the droplets depends on the depth of the cooling step through the transition. A small step gives a small degree of super-saturation – a lower nucleation rate and thus fewer nuclei. However the number of atoms in the new phase is determined, from the phase diagram, by the temperature. Thus a smaller cooling step will result in larger droplets. Droplet size also depends on crystal quality111The observation of homogeneous nucleation requires high crystal quality. Crystalline imperfections favor heterogeneous nucleation, resulting in more and therefore smaller droplets. Koster et al.Koster et al. (1995) find a droplet size of 25nm comparable with the crystallite size determined from x-ray scattering..
The linear approximation to the droplet growth, above, is not valid in the final stages of the separation process where the degree of supersaturation becomes small. In that case the critical droplet size becomes large. This has two consequences. Firstly there is no nucleation of new droplets: the probability of an adequate fluctuation for this to happen becomes vanishingly small. Secondly, as the critical droplet size becomes larger there is an increasing number of droplets that find themselves smaller than this critical size. They were stable; they are now unstable. These sub-critical droplets will dissolve, liberating 3He atoms into the background. And these atoms are then available to condense on the remaining super-critical droplets they encounter.
During this late-stage growth the droplet size is predicted to increase with a characteristic power law Mazenko et al. (1985), where the exponent depends on the ‘universality class’ of the transition. To investigate this ‘coarsening’ we quenched the crystal from above the separation down to 100 mK and followed the droplet size using NMR. The evolution of with time is shown in Fig. 3 where we have plotted against . The asymptotic late-stage behavior is indicated at the left hand side where the approach to linearity indicates the characteristic exponent , in accordance with the Lifshitz-Slezov lawLifshitz and Slezov (1959) for a COP process.
This asymptotic behavior follows from simple scaling argumentsJones (2002). The droplet curvature will lead to concentration gradients of magnitude . We assume that the transport of 3He atoms arises through diffusion, of coefficient . Then the diffusive flux is . And it is this flux of atoms that results in the final growth of the super-critical droplets, so that , which has solution . A full solution of the actual equations of motionLifshitz and Slezov (1959) leads to the expression
| (5) |
where is the atomic volume and is the equilibrium concentration of 3He in the dilute phase.
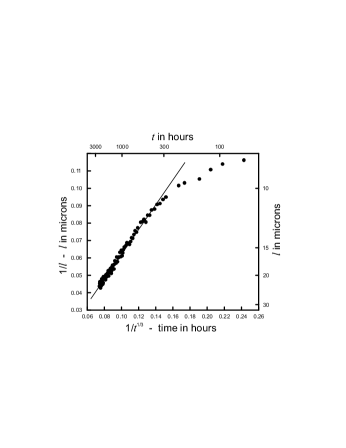
The slope of the asymptote of Fig. 3 is found to be s1/3 m-1. This may be compared with the value calculated from Eq. (5). The Edwards and Balibar phase diagram equationsEdwards and Balibar (1989) give at 100mK. At these low concentrations is givenGanshin et al. (1999) approximately by , where m2 s-1. And this leads to an asymptote slope of , within 20% of the experimental value. This is a reasonable agreement since the value of is approximate; there are uncertainties in its magnitude and pressure dependenceGanshin et al. (1999). Thus we have observed the final, coarsening, stage of the phase separation process.
In summary we have presented a detailed real-time investigation of homogeneous nucleation in solid helium mixtures, in which all three stages of the process have been identified. The time exponent for the coarsening stage, is in accord with the Lifshitz-Slezov COP evaporation-condensation mechanism in contrast to the behavior observed by Nagler et al.Nagler et al. (1988) for their NCOP transition. These observations lend support to the proposal of universal exponents for late-stage coarsening. Solid helium mixtures thus provide a model system for the study of nucleation and growth kinetics in first-order phase transitions.
Future work will include further investigation of early-stage kinetics and a determination of the critical droplet size using small-angle neutron scattering in high quality mixture crystals.
Acknowledgements.
The authors wish to thank Ján Nyéki and Tom Crane for experimental assistance. This work was supported by EPSRC grant EP/E023177/1.References
- McKie and McKie (1974) D. McKie and C. McKie, Crystalline Solids (Nelson, London, 1974).
- Cabral et al. (2002) J. T. Cabral, J. S. Higgins, N. A. Yerina, and S. N. E. Magonov, Macromolecules 35, 1941 (2002).
- Hohenberg and Halperin (1977) P. C. Hohenberg and B. I. Halperin, Rev. Mod. Phys. 49, 435 (1977).
- Mazenko et al. (1985) G. F. Mazenko, O. T. Valls, and F. C. Zhang, Phys. Rev. B 31, 4453 (1985).
- Katano and Iizumi (1984) S. Katano and M. Iizumi, Phys. Rev. Lett. 52, 835 (1984).
- Onuki (2002) A. Onuki, Phase Transition Dynamics (Cambridge University Press, 2002).
- Bennemann and Ketterson (1976) K. H. Bennemann and J. B. Ketterson, The Physics of Liquid and Solid Helium (Wiley, New York, 1976).
- Cahn and Hilliard (1958) J. W. Cahn and J. E. Hilliard, J. Chem. Phys. 28, 258 (1958).
- Lifshitz and Slezov (1959) I. M. Lifshitz and V. V. Slezov, Soviet Physics JETP 35, 331 (1959).
- Slezov and Schmelzer (1997) V. V. Slezov and J. Schmelzer, Phys. Solid State 39, 1971 (1997).
- Mainville et al. (1997) J. Mainville, Y. S. Yang, K. R. Elder, and M. Sutton, Phys. Rev. Lett. 78, 2787 (1997).
- Ng et al. (1996) J. D. Ng, B. Lorber, J. Witz, A. Théobald-Dietrich, D. Kern, and R. Giegé, J. Crystal Growth 168, 50 (1996).
- Smith et al. (2003) A. Smith, S. Kingsley, V. A. Maidanov, E. Y. Rudavskii, V. N. Grigorev, V. V. Slezov, M. Poole, J. Saunders, and B. Cowan, Phys. Rev. B 67, 245314 (2003).
- Penzev et al. (2002) A. Penzev, A. Ganshin, V. Grigor’ev, V. Maidanov, E. Rudavskii, A. Rybalko, V. Slezov, and Y. Syrnikov, J. Low Temp. Phys. 126, 151 (2002).
- Nagler et al. (1988) S. E. Nagler, J. R. F. Shannon, C. R. Harkless, M. A. Singh, and R. M. Nicklow, Phys. Rev. Lett. 61, 718 (1988).
- Greenberg et al. (1972) A. S. Greenberg, W. C. Thomlinson, and R. C. Richardson, J. Low Temp. Phys. 8, 3 (1972).
- Cowan (1997) B. Cowan, Nuclear Magnetic Resonance and Relaxation (Cambridge University Press, 1997).
- Mullin (1968) W. J. Mullin, Phys. Rev. Lett. 20, 254 (1968).
- Edwards and Balibar (1989) D. O. Edwards and S. Balibar, Phys. Rev. B 39, 4083 (1989).
- Poole et al. (2006) M. Poole, J. Saunders, and B. Cowan, Phys. Rev. Lett. 97, 125301 (2006).
- Fraass and Simmons (1987) B. A. Fraass and R. O. Simmons, Phys. Rev. B. 36, 97 (1987).
- Grigor’ev (1997) V. N. Grigor’ev, Low Temp. Phys. 23, 3 (1997).
- Ganshin et al. (1999) A. N. Ganshin, V. N. Grigor’ev, V. A. Maidanov, N. F. Omelaenko, A. A. Penzev, E. Rudavskii, A. S. Rybalko, and Y. A. Tokar, Fiz. Nizk. Temp. 25, 796 (1999).
- Ohishi et al. (1998) K. Ohishi, H. Yamamoto, and M. Suzuki, J. Low Temp. Phys. 112, 199 (1998).
- Jones (2002) R. A. L. Jones, Soft Condensed Matter (Oxford Master Series in Condensed Matter Physics, 2002).
- Koster et al. (1995) J. P. Koster, S. E. Nagler, E. D. Adams, and G. D. Wignall, Mat. Res. Soc. Proc. 376, 335 (1995).