Grain - A Java Analysis Framework for Total Data Readout
Abstract
Grain is a data analysis framework developed to be used with the novel Total Data Readout data acquisition system. In Total Data Readout all the electronics channels are read out asynchronously in singles mode and each data item is timestamped. Event building and analysis has to be done entirely in the software post-processing the data stream. A flexible and efficient event parser and the accompanying software framework have been written entirely in Java. The design and implementation of the software are discussed along with experiences gained in running real-life experiments.
keywords:
Data Analysis, Total Data Readout, Recoil Decay Tagging, JavaPACS:
29.85.+c , 07.05.Kf , 07.05.Rm1 Introduction
Nuclear physics experiments are usually instrumented using conventional, common dead time data acquisition systems, which are triggered by an event in a pre-defined detector. In decay spectroscopy and Recoil Decay Tagging (RDT) experiments (in which decay spectroscopy is combined with in-beam spectroscopy), these systems inherently suffer from dead time losses since rather wide common gates have to be used in order to collect all the required information. These problems grow worse if either the focal plane count rate or the common gate width is increased. The former condition often arises from the fact that the reaction channel under study may form only a minor fraction of the total counting rate of the implantation detector. In the latter case one is usually either studying isomeric decays with half-lives of the order of tens of microseconds or using them as a “tag” in Recoil Isomer Tagging (RIT) experiments. To overcome these problems a novel Total Data Readout (TDR) method [1] was developed by the GREAT collaboration as part of a project to build a highly sensitive tagging spectrometer [2] .
TDR is a triggerless data acquisition system in which all the electronics channels operate individually in free running singles mode. All the information is read out asyncronously by the front-end electronics consisting of gated ADCs and bit-pattern registers. Data items are time-stamped with 10ns precision using a 100 MHz clock signal, which is distributed throughout the whole system. The data are subsequently ordered in a so called collate and merge software layer, after which the data forms a single time-ordered stream. Unlike the data emerging from a conventional data acquisition system, the data from the TDR collate and merge layer is not structured or filtered in any way, excluding the time ordering. Temporal and spatial correlations required to form events out of the raw data stream and the filtering to remove unwanted or irrelevant data has to be done entirely in the software which processes the data stream.
Grain was developed to provide a complete, self-contained, cross platform software framework which could be used to analyse the raw TDR data stream. The main purpose of the software is to provide a tool for the online analysis at the RITU separator at the Accelerator Laboratory of the University of Jyväskylä (JYFL), where the TDR system along with the GREAT spectrometer are currently located, and to facilitate for the subsequent offline analysis of the experimental data. The GREAT TDR system also includes an event builder software, TDREB [3]. Grain can be used as a completely stand-alone system or either in parallel or in series with TDREB.
Grain has been implemented entirely in Java. The portability, clean object-oriented programming language and the incorporated, rich user interface and networking libraries were the main motives behind the decision. Java has had a reputation of being too slow for calculation intensive tasks, such as data analysis, but in the recent years the arrival of just-in-time (JIT) compilers have lifted the performance to the same level as native, compiled languages (see e.g. [4]). Previous reports on the usage of Java in similar tasks [5, 6] were also found to be mostly positive. The Grain executable is available for download at the development web page [7].
2 Stream filtering and event parsing
2.1 Stream filtering
Prior to building the events the TDR data stream must be filtered against unwanted data, which usually consists of vetoed and piled up signals. In traditional systems the vetoing and pile-up detection was incorporated into the front-end electronics and the data acquisition system normally would not ever see these data. In the TDR system the data analysis software is required to perform these tasks, though the TDR ADCs have a limited hardware-veto capability. For example, in the current JYFL TDR setup events from the Compton suppression shields of the target array are read out as bit-pattern data. Thus, the data from the target array germanium detectors and their BGO shields must be correlated pairwise in software in order to perform the suppression.
Pile-up rejection is based on the TDR ADCs capability to detect gates arriving at the ADC during the processing of the previous gate. These data are included in the stream as separate special data items and thus each channel needs to be self-correlated in time to find the piled-up data. Vetoed or pile-up data can be either discarded or marked and included in the events.
2.2 Event parsing
Two types of event parsers have been developed so far. Decay spectroscopy and tagging experiments require a parser which constructs events in which the trigger is any signal from the implantation detector. Stand-alone in-beam experiments require a trigger based on the multiplicity of hits in the detector array. In both cases time domain correlations were selected as the first stage of the event builder strategy. This was mainly done in order to ensure the maximum throughput of the system as the conditions used require only a single dynamic parameter, the time stamp and a static definition of which data acquisition channels constitute the triggering detector group.
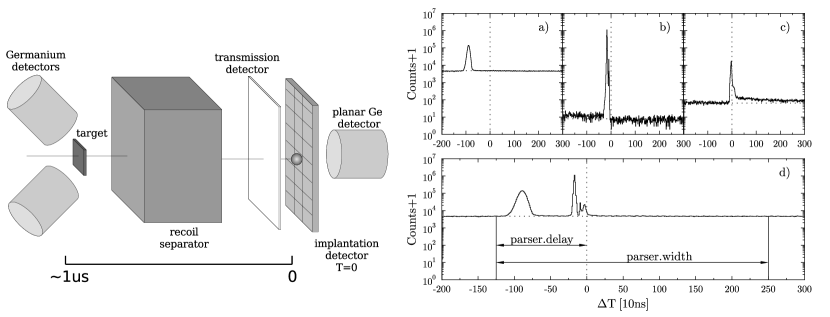
The decay/RDT event parser is almost entirely based on the time structure of the stream. A typical time structure of the stream, with respect to any signal in the implantation detector, taken from a tagging experiment at RITU is presented in figure 1. The individual components forming the structure can be roughly divided into three groups depending on the placement and role of the detector groups: a) preceding, b) prompt and c) delayed events. Typical examples of these are presented in the upper panels of figure 1.
In decay or RDT experiments events can be simply defined at the first stage as a time slice of the stream, which is triggered by any datum from a predefined group of ADC channels. As the data is buffered in time order, it is possible to easily extend the slice to cover also data in the past and in the future with respect to the triggering data. The parameters needed to construct the slice are the address of the triggering channel, offset of the slice (delay) and the extent of the slice (width). By varying these parameters the parser can be configured for different types of requirements of RDT, RIT or decay spectroscopy experiments.
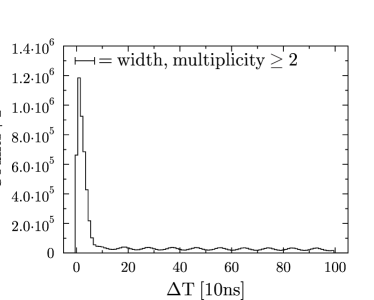
Pure in-beam experiments usually use a hit-multiplicity trigger; a certain number of coincident hits is required in a defined time window. In the case of TDR the event parsing is rather straight forward. As the data is already time ordered and filtered, and can be easily buffered in memory, one can simply count the number of hits over a given period after each individual hit. The input parameters required are the width of the coincidence window, the set of channels for which the multiplicity is calculated for and the minimum required multiplicity. Figure 2 shows a typical time structure of the TDR data stream in a stand-alone -ray experiment.
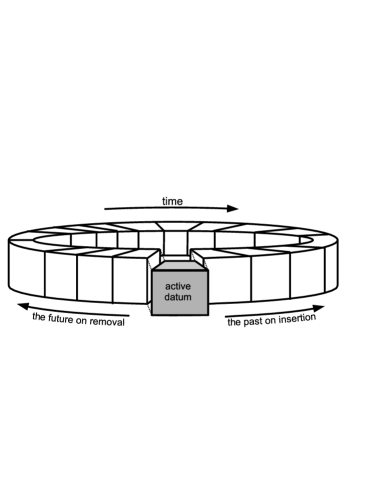
Both event parsers have been implemented around a ring-buffer, which holds the data objects. Access to the data preceding and following a certain data item can be done by iterations in the buffer. On insertion and removal the data item is checked whether it is a triggering item, a vetoing item or a piling-up item. In any of these cases corresponding data is searched in the buffer and flagged if found. All the data is checked on removal whether it is flagged triggered and if so, dispatched to the next level of event parser.
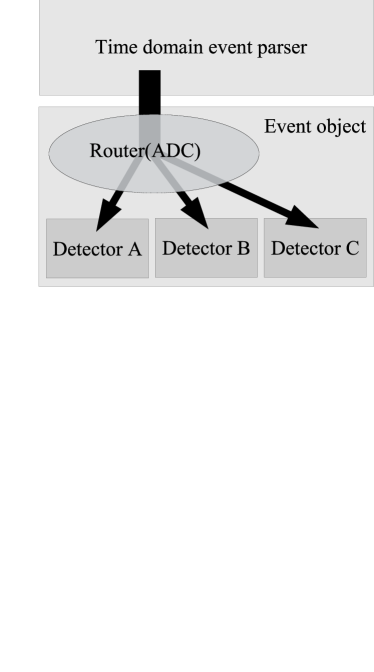
Once the group of data forming an event has been identified, the internal event structure needs to be assigned. At the second stage of event building the data forming the event slice are fed into an event object. The data items are routed into sub-objects describing different detectors according to the source of the data i.e. the ADC or bit-pattern unit channel number. The routing table is defined in the sub-detector objects at the implementation time. A schematic drawing of the routing is shown in figure 4. Several different event types have been predefined and users select the type which is appropriate for their analysis from the user interface.
3 Framework implementation
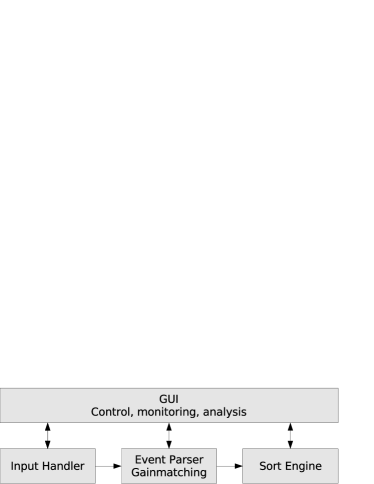
The general design of the analysis framework is shown in figure 5. In order to benefit from modern computer hardware with multiple processor cores available on most machines, the data processing framework was designed to be multithreaded. Users interact with the graphical user interface (GUI) running the master thread and providing interactive analysis functions as well as serving as the control thread for data sorting jobs. The GUI thread starts the other threads at the beginning of each data sorting job. The data is relayed from thread to thread using first-in, first-out buffers (FIFOs).
3.1 Sort Engine
The sort engine uses the Java dynamical class loading capability. Grain provides abstract (skeleton) sorter classes which the user needs to implement and which provide access to the event data. Users can thus write their own data reduction routines in Java using all the features of the language as long as this inheritance relationship is fulfilled. Compiled classes can be loaded into the Java Virtual Machine (JVM) dynamically at runtime. Histogramming and other basic analysis services are provided via JAIDA [8], the Java implementation of the AIDA (Abstract Interfaces for Data Analysis) definition [9]. A new binner had to be added to the JAIDA histogrammer since rather large multidimensional histograms are required in nuclear physics analysis. The histograms and n-tuples created in the sort engine are available through the GUI at runtime.
3.2 Correlation Framework
During the last decade the RDT technique [10, 11] has been widely used in the studies of the structure of neutron deficient nuclei and super-heavy nuclei (see e.g. review articles [12, 13]). The technique has usually been applied in set-ups where one detector system is used to observe prompt radiation at the target position of a recoil separator, while the other is located at the focal plane of the separator detecting the arrival of reaction residues (recoils) and their subsequent decays. In essence, RDT is a three step process. First a delayed coincidence is used to associate the prompt radiation with the recoils implanted in a position sensitive detector at the focal plane. In the second step a spatial and temporal correlation of the recoil and the subsequent, often discrete, decay is used to establish the identity of the recoil. Finally, this information can be combined to form the unambiguous identification of the source of the prompt radiation. Similar correlation tasks are used also in pure decay spectroscopy. A large amount of information per event needs to be stored often for several hours in order to perform these correlations.
The Grain correlation framework is based on the discrete position sensitivity provided by the double-sided silicon strip detectors used in GREAT and the fact that all the event information is already encapsulated in the event object. The framework consists of a container object which provides a time ordered, time constrained stack of event objects per implantation detector pixel and routines to insert an event into the container and to retrieve the history of any given pixel based on the current event. This framework simplifies correlation analysis greatly as the user does not need to implement book keeping and memory management and they are handled in a consistent manner for all the users.
3.3 User Interface and Analysis Functions
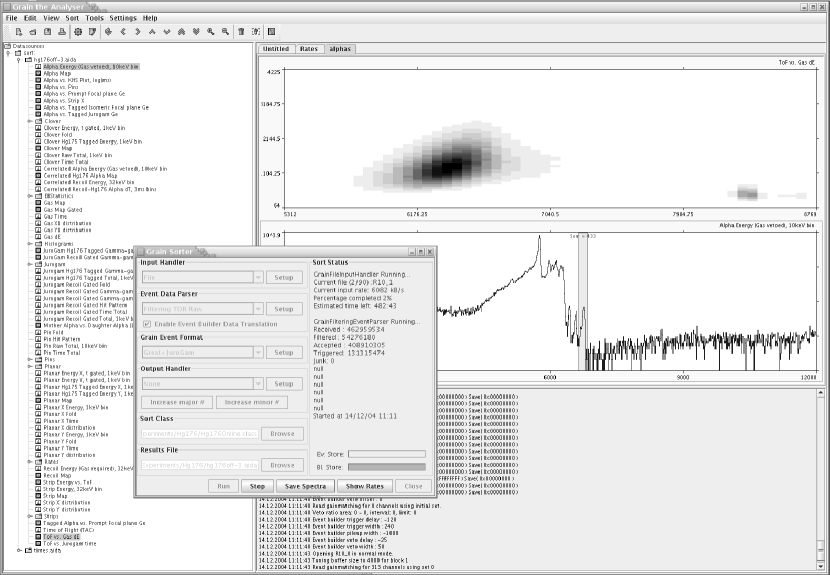
The Grain graphical user interface has been implemented using standard the Java Swing toolkit and Java2D graphics (see fig. 6). A standard GUI design, with menus and toolbars, was selected as it is already familiar to most users. Histograms can be browsed with a tree widget and displayed on the main panel, several at a time if required. Information about the progress of the analysis jobs and the results for the interactive analysis are displayed in the logger window. Standard zooming and scrolling functions are provided for both one- and two-dimensional histograms. Peak-area integration and fitting of gaussian peak-shapes and exponential decay-curves are provided for one-dimensional histograms. Two-dimensional histograms (matrices) can be sliced either on the standard GUI or on a separate widget geared towards coincidence analysis. N-tuples can also be used in the interactive analysis through AIDA evaluators and filters.
Histograms can be exported to ascii and Radware [14] formats. The ascii format can also be imported along with ROOT histograms through the hep.io.root package [15]. The spectrum view can be printed using the printing system provided by the operating system or exported to a variety of formats. The AIDA XML data format used by Grain through JAIDA libraries to store histograms and n-tuples is an open standard. Several other AIDA-compliant tools [6, 16, 17, 18] can be used to read, view and analyse the files instead of Grain if so required.
4 Performance
The sorting performance has been analysed in two ways. First, only simple through-put tests were run on a modern computer with a dual-core AMD processor running 64-bit linux operating system and 64-bit Java version 1.6 from Sun Microsystems. Later, the performance of different parts of the data sorting chain have been analysed using the Netbeans Java Profiler [19].
To demonstrate the performance of the sorting a typical RDT experiment was selected as a test case. A heavy ion fusion evaporation reaction 36Ar + 144Sm 180Hg∗ was used to produce light Hg isotopes. In optimum operating conditions the total counting rate of the detectors was about 400 kHz, mainly from the target array germanium detectors, corresponding to a data rate of about 3.2 MB/s from the TDR. Part of the data was written to disk without any prefiltering, and later analysed offline. The results are shown in Table 1. In early experiments the histogramming of raw data was noticed to have a serious impact on the sorting performance on-line. This is clearly reflected in the results. Histogramming of the raw data is also performed in the TDR DAQ, so it can be safely turned off if the performance degradation is too high. As can be seen, the throughput without raw histogramming is over an order of magnitude higher than a typical RDT experiment currently requires and close to that for stand-alone experiments. In decay experiments data rates are always much lower as the target area detectors are not used.
| Trigger | with raw | w.o. raw |
|---|---|---|
| histogramming | histogramming | |
| RDT | 19 MB/s | 44 MB/s |
| 13 MB/s | 22 MB/s | |
| 17 MB/s | 28 MB/s |
The event parser has been found to be the bottleneck in the sorting performance by using the Java profiler. About 65% of the execution time is spent in the event parser thread, out of which about a half is spent in the actual event search in the ring-buffer. This bottleneck is partly alleviated by the multithreading as the parser utilises a single processor core and the other parts of the framework run in the other available cores.
5 Conclusions
Analysis of the triggerless, TDR generated data has been implemented in a flexible, efficient manner. Grain has been used as an on-line analysis tool in over 50 experiments since 2002, catering for very different experiments ranging from decay spectroscopy of very heavy elements [20] to RDT studies in the A100 region [21]and the development of the novel -tagging technique [22]. In vast majority of cases Grain has also been the main tool in offline analysis.
The use of Java language and platform has been a major contributor to the success of the framework. Platform independence has granted simple installation and operation on the three current major personal computer operation systems, making it easy for users to deploy the software where required. Java language and the use of object oriented techniques has not only simplified development of the framework itself, but has simplified the users task of sort code writing, especially when complicated correlation schemes have to be used.
Acknowledgments
I would like to thank all the people who have used the software and contributed through bug reports and suggestions. This work has been supported by the EU 5th Framework Programme “Improving Human Potential - Access to Research Infrastructure”. Contract No. HPRI-CT-1999-00044 and the EU 6th Framework programme “Integrating Infrastructure Initiative - Transnational Access”, Contract Number: 506065 (EURONS) and by the Academy of Finland under the Finnish Centre of Excellence Programmes 2000-2005 (Nuclear and Condensed Matter Physics Programme at JYFL) and 2006-2011 (Nuclear and Accelerator Based Physics Programme at JYFL).
References
- [1] I. Lazarus, et al., IEEE Trans. Nucl. Sci. NS-48 (2001) 567.
- [2] R. D. Page, et al., Nucl. Instrum. Methods Phys. Res. B204 (2003) 634.
- [3] Great TDR software, http://ns.ph.liv.ac.uk/tdr_software.html
- [4] J. M. Bull, L. A. Smith, L. Pottage, R. Freeman, Benchmarking java against c and fortran for scientific applications, in: JGI ’01: Proceedings of the 2001 joint ACM-ISCOPE conference on Java Grande, ACM, New York, NY, USA, 2001, pp. 97–105.
- [5] K. B. Swartz, D. W. Visser, J. M. Baris, Nucl. Instrum. Methods Phys. Res. A 463 (2001) 354.
- [6] Jas3 software, http://jas.freehep.org/jas3
- [7] Grain software, http://trac.cc.jyu.fi/projects/grain
- [8] Jaida project, http://java.freehep.org/jaida
- [9] Aida project, http://aida.freehep.org
- [10] R. S. Simon, et al., Z.Phys. A325 (1986) 197.
- [11] E. S. Paul, et al., Phys.Rev. C51 (1995) 78.
- [12] R. Julin, K. Helariutta, M. Muikku, J.Phys.(London) G27 (2001) R109.
- [13] R. D. Herzberg, J.Phys.(London) G30 (2004) R123.
- [14] Radware software, http://radware.phy.ornl.gov
- [15] Rootio package, http://java.freehep.org/freehep-rootio
- [16] Openscientist software, http://openscientist.lal.in2p3.fr/
- [17] Physicist interface (pi) project, http://lcg-pi.web.cern.ch/lcg-pi/
- [18] Paida software, http://paida.sourceforge.net/
- [19] Netbeans profiler, http://www.netbeans.org/products/profiler/
- [20] R. D. Herzberg, et al., Nature(London) 442 (2006) 896.
- [21] M. Sandzelius, et al., Phys.Rev.Lett. 99 (2007) 022501.
- [22] A. N. Steer, et al., Nucl.Instrum.Methods Phys.Res. A565 (2006) 630.