Analyzing and Modeling Real-World Phenomena with Complex Networks: A Survey of Applications
Abstract
The success of new scientific areas can be assessed by their potential for contributing to new theoretical approaches and in applications to real-world problems. Complex networks have fared extremely well in both of these aspects, with their sound theoretical basis developed over the years and with a variety of applications. In this survey, we analyze the applications of complex networks to real-world problems and data, with emphasis in representation, analysis and modeling, after an introduction to the main concepts and models. A diversity of phenomena are surveyed, which may be classified into no less than 22 areas, providing a clear indication of the impact of the field of complex networks.
1 Introduction
The many achievements of physics over the last few centuries have been based on reductionist approaches, whereby the system of interest is reduced to a small, isolated portion of the world, with full control of the parameters involved (e.g., temperature, pressure, electric field). An interesting instance of reductionism, which is seldom realized, is the modeling of non-linear phenomena with linear models by restricting the parameters and variables in terms of a linear approximation. In establishing the structure of matter with the quantum theory in the first few decades of the 20th century, for example, reductionism was key to reaching quantitative treatment of the properties of atoms, molecules and then sophisticated structures such as crystalline solids. Indeed, deciphering the structure of matter was decisive for many developments – not only in physics but also in chemistry, materials science and more recently in biology [1]. Nevertheless, with reductionist approaches only limited classes of real-world systems may be treated, for the complexity inherent in naturally-occurring phenomena cannot be embedded in the theoretical analysis.
There is now a trend in science to extend the scientific method to become more integrationist and deal explicitly with non-linear approaches. The impressive evolution of the field of complex networks fits perfectly within such a scientific framework. Its origins can be traced back to Leonhard Euler’s solution of the Königsberg bridges problem (e.g., [2]), after which the theory of graphs has been useful for theoretical physics, economy, sociology and biology. However, most of such studies focused on static graphs, i.e. graphs whose structure remained fixed. Important developments on dynamic networks were addressed by Erdős and Rényi [3], among others, particularly for the so-called random networks, including the model now known as Erdős and Rényi — ER [4, 5, 6]. This type of network is characterized by the feature that in a network with initially isolated nodes, new connections are progressively established with uniform probability between any pair of nodes. Such networks are well described in terms of their average degree, implying they have a relatively simple structure. Despite the formalism and comprehensiveness of the theoretical results obtained by Erdős and collaborators, random networks ultimately proved not to be good models for natural structures and phenomena. Indeed, heterogeneous structuring, not the relative uniformity and simplicity of ER networks, is the rule in Nature. Therefore, it was mainly thanks to the efforts of sociologists along the last decades (e.g., [7, 8]) that graph theory started to be systematically applied to represent and model natural phenomena, more specifically social relations. These efforts were mainly related to the concept of the small-world phenomena in networks, which are characterized by small average shortest path lengths between pairs of nodes and relatively high clustering coefficients. Interestingly, the small-world property turned out to be ubiquitous. The next decisive development in graph applications took place quite recently, including Faloutsos et al. characterization of the Internet power law organization [9] and the identification of such a kind of connectivity in the WWW [10], giving rise to the scale-free paradigm [11]. Subsequent investigations showed that many natural and human-made networks also exhibited scale-free organization, including protein-protein interaction networks [12], domain interaction networks [13], metabolic networks [14], food webs [15], networks of collaborators [16], networks of airports [17] and roads [18].
The success of complex networks is therefore to a large extent a consequence of their natural suitability to represent virtually any discrete system. Moreover, the organization and evolution of such networks, as well as dynamical processes on them [19, 20], involve non-linear models and effects. The connectivity of networks is ultimately decisive in constraining and defining many aspects of systems dynamics. The key importance of this principle has been highlighted in many comprehensive surveys [21, 22, 23, 19, 24]. For instance, the behavior of biological neuronal networks, one of the greatest remaining scientific challenges, is largely defined by connectivity (e.g., [25, 26, 27]). Because of its virtually unlimited generality for representing connectivity in the most diverse real systems in an integrative way, complex networks are promising for integration and unification of several aspects of modern science, including the inter-relationships between structure and dynamics [28, 29]. Such a potential has been confirmed with a diversity of applications for complex networks, encompassing areas such as ecology, genetics, epidemiology, physics, the Internet and WWW, computing, etc. In fact, applications of complex networks are redefining the scientific method through incorporation of dynamic and multidisciplinary aspects of statistical physics and computer science.
This survey is aimed at a comprehensive review of the myriad of applications of complex networks, discussing how they have been applied to real data to obtain useful insights. In order to ensure a coherent, integrated presentation of the related works, the survey has been organized according to main areas and subareas. The survey starts with a section describing the basic concepts related to complex networks theory, such as measurements.
2 Basic Concepts
2.1 Network Representation
A graph or undirected graph is an ordered pair , formed by a set of vertices (or nodes, or points) and a set of edges (or lines, or links) that connect the vertices [30, 31, 32]. In the Physics literature, a graph has also been called a network [24].111Strictly speaking, in graph theory a network is a directed graph (digraph) with nonnegative capacities associated with each edge and distinguished source and sink vertices [32]. When the edges between pairs of vertices have direction, the graph is said to be a directed graph. In this case, the graph can be represented by , which is an ordered pair , where is the set of vertices and is the set of ordered pairs of arcs (or arrows). If an edge is a directed edge extending from the node to , is called the head and is referred to as the tail of the edge. Also, is a direct successor of , and is a direct predecessor of . A walk (of length ) is a non-empty alternating sequence of vertices and edges in such that for all . If , the walk is closed. A path between two nodes is a walk through the network nodes in which each node is visited only once. If a path leads from to , then is said to be a successor of , and is a predecessor of . A cycle is a closed walk, in which no edge is repeated. A graph is a subgraph of if , and the edges in connect nodes in . If it is possible to find a path between any pair of nodes, the network is referred to as connected; otherwise it is called disconnected.
The intensity of connections can also be represented in the graph by associating weights to edges. Thus, the weighted graph is formed by incorporating, in addition to the set of vertices and edges, the set of weights, i.e. real numbers attached to the edges. The weighted graph can also be directed. In this case, instead of edges, the nodes are linked by arcs. Therefore, the most general graph is the direct, weighted graph [24].
The special category of geographical networks is characterized by having nodes with well-defined coordinates in an embedding space. Then, the network incorporates additional information, given by the set , where is an dimensional vector which gives the position of the node , generally in the space.
Graphs can be represented by using adjacency lists or adjacency matrices. In the former case, the graph is stored in a list of edges (represented through head and tail). This data structure is frequently used to reduce the required storage space, allowing the use of sparse matrices. The list may also have a third element which represents the intensity of the connection. In the latter case, the graph is represented by an adjacency matrix whose elements are equal to whenever there is an edge connecting nodes and , and equal to otherwise. When the graph is undirected, the adjacency matrix is symmetric. In order to represent weighted networks, a generalization of the adjacency matrix is required. In this case, weighted networks are represented by the so-called weight matrix , where the matrix element represents the weight of the edge connecting the nodes and . From the weight matrix an adjacency matrix can be derived through a thresholding operation, , that associates for each element whose value is larger than a threshold the value ( is otherwise assigned) [24].
2.2 Network Measurements
In order to characterize and represent complex networks, many measurements have been developed [24]. The most traditional ones are the average node degree, the average clustering coefficient and the average shortest path length. The degree of a node is given by its number of connections. For undirected networks, using the adjacency matrix,
| (1) |
The average node degree is a global measurement of the connectivity of the network,
| (2) |
If the network is directed, it is possible to define, for each node , its in-degree, , and out-degree, , as well as the corresponding averages considering the whole network. The total degree of a vertex is given by .
Another measurement related to connectivity is the degree distribution , which gives the probability that a node chosen uniformly at random has degree . This has been found to follow a power law for many real world networks, as discussed later. For directed networks, there are two distributions, for incoming links, , and outgoing links, . The clustering coefficient is related to the presence of triangles (cycles of order three) in the network [33]. The clustering coefficient of a node (with degree ) is given by the ratio between the number of edges among the neighbors of , denoted by , and the maximum possible number of edges among these neighbors, given by . Thus,
| (3) |
The corresponding global measurement frequently used to characterize the graph is the average clustering coefficient, which is given as
| (4) |
The length of a path connecting the vertices and is given by the number of edges along that path. The shortest path (or geodesic path) between vertices and is any of the paths connecting these two nodes whose length is minimal [34]. For the whole network, it is possible to represent the geodesic distances by a distance matrix , in which the entry represents the length of the shortest paths between the nodes and . The average shortest path length is obtained from such a matrix,
| (5) |
where the sum considers and disregards pairs that are not in the same connected component.
All the measurements discussed above can be extended to weighted networks, in which case the node strength is defined with the weight matrix [35],
| (6) |
The average strength is defined considering the nodes in the whole network, i.e.
| (7) |
The weighted clustering coefficient of a vertex can be defined as [35],
| (8) |
where the normalizing factor ensures that . The average weighted clustering coefficient is given by,
| (9) |
The average shortest path length for weighted networks is determined similarly as in Equation (5), considering the weight of the edges. In this case, the weighted shortest path length, , is defined as the smallest sum of edges lengths throughout all the possible paths from to [19].
Another important structural aspect of complex network characterization is the analysis of how vertices with different degrees are connected. The degree correlation can be determined from the Pearson correlation coefficient of the degrees at both ends of the edges [36]:
| (10) |
where is the total number of edges and . If the network is assortative (vertices with similar degrees tend to be connected); if , the network is disassortative (highly connected vertices tend to connect to those with few connections); for there is no correlation between vertex degrees, and the network is called non-assortative.
The measurements above can be used for local analysis, in terms of node measurements, or global analysis, in terms of average measurements for the whole network. However, an intermediate analysis is possible by taking into account the modular structures in networks. Such structures, called communities, are common in many real networks, formed by sets of nodes densely connected among themselves while being sparsely connected to the remainder of the network [37, 38]. Communities play an important role in network structure, evolution and dynamics, defining modular topologies. Unfortunately, their identification is an NP-complete problem [39], so that many heuristic algorithms have been proposed for their identification [37, 39, 24].
Depending on the application, subgraphs can be essential to characterize network structures. For instance, modular structures in networks can be associated with different functions, such as scientific collaboration areas. In addition to communities, other types of subgraphs are found in complex networks, such as motifs [40], cycles [41] and chains [42]. Motifs are subgraphs that appear more frequently in real networks than could be statistically expected [40, 43] (see Figure 1, page 1). Other types of motifs include chain motifs (handles and tails) [42] or border trees [44].
A fundamental issue related to networks measurement is the sampling bias. If the data used to generate a particular network present a large quantity of noise or incompleteness, it becomes critical to consider measurements that are not much sensitive to perturbations. Such measurements must reflect the differences in distinct networks structures [45]. This analysis is crucial for the theory of complex networks and constitutes a promising research field.
Multivariate statistical and pattern recognition methods are useful for understanding the network structure. For instance, the ability of a given model to reproduce real-world networks can be evaluated by canonical variable analysis with Bayesian decision theory [24]. In addition, structures of networks can be classified with these methods, e.g. the simplicity of networks can be determined by searching for nodes with similar measurements [46].
2.3 Network Models
In addition to the characterization of networks in terms of informative sets of measurements, it is important to construct models capable of reproducing the evolution and function of real systems or some of their main features. Among the many network models, three important models are those of Erdős and Rényi, Watts and Strogatz, and Barabási and Albert. The random graph of Erdős and Rényi (ER) uses what is possibly the simplest way to construct a complex graph: starting with a set of disconnected vertices, edges are added for each pair of vertices with probability [4, 30]. Consequently, the degree distribution follows a Poisson distribution for large , with average degree and average clustering coefficient . Random graphs are simple but unsuitable to model real networks because the latter are characterized by heterogeneous connections and an abundance of cycles of order three [33].
The model developed by Watts and Strogatz, referred to as small-world networks, overcomes the lack of cycles of order three in random graphs, but does not provide non-uniform distribution of connectivity [33]. To construct a small-word network, one starts with a regular lattice of vertices in which each vertex is connected to nearest neighbors. Next, each edge is randomly rewired with probability . When there is an ordered lattice with high number of cycles of order three but large average shortest path length, and when the network becomes a random network.
In order to explain the uneven distribution of connectivity present in several real networks, Barabási and Albert developed the so-called scale-free network model, henceforth abbreviated as BA model, which is based on two rules: growth and preferential attachment [21]. The process starts with a set of vertices and, at each subsequent step, the network grows with the addition of new vertices. For each new vertex, new edges connecting it to previous vertices are inserted. The vertices receiving the new edges are chosen according to a linear preferential attachment rule, i.e. the probability of the new vertex to connect to an existing vertex is proportional to the degree of , i.e.
| (11) |
This evolution is related to the “the rich get richer” paradigm, i.e. the most connected vertices have greater probability to receive new vertices. Several networks are believed to be well-modeled by the Barabási and Albert approach, which means there is preferential attachment in these networks, as we shall discuss in the next sections.
Network models have been increasingly considered to investigate different types of dynamics. Indeed, the relation between the function and structure of networks may help understand many real-world phenomena, such as the association between biological networks and the products of such interaction or between society and epidemic spreading. Many dynamical processes have been studied by complex networks researchers, including synchronization [47, 48], spreading [49, 50], random walks dynamics [51, 52, 53], resilience [11, 54, 55], transportation [56] and avalanches [57]. A good review on dynamical processes in complex networks appeared in [19].
3 Social Networks
Since ancient times, the way individuals establish relations among themselves has been crucial to guide the cultural and economical evolution of society. Hidden and clear relationships have always defined different social, diplomatic, commercial and even cultural networks. In various of those ancient networks, it was possible to qualitatively identify relevant structural properties [58], such as the importance of strategic individuals to intermediate or decide negotiations, or experience the power of ideological/religious thoughts within groups of people.
Though the quantitative study of social systems dates back to the seventeenth century [59], the systematic study of social relations using mathematical methods possibly began in the first decades of the last century with the study of children friendship in a school in [60], later followed by Mayo [7] with an investigation into interactions among workers in a factory. The motivation for understanding “social networks” increased in the following years, especially with analysis of empirical data. We shall not review those early works, but they are important because the methods developed by social network researchers are now adopted by the so-called complex network community. In addition, some of the problems now treated with complex networks had already been addressed by social researchers. These included the phenomena described by Simon in his seminal paper on a model to generate highly skewed distribution functions [61], the study of citation networks by Price [62], which converged in a model of network growth able to generate power law degree distributions [63], Freeman’s measurement of centrality (betweenness), which quantified the amount of geodesic paths passing through a node [64, 65], and the small-world effect, which emerged in the famous Milgram social experiment [66, 67], to name but a few. Further information and results from the sociological point of view can be found in specialized books [8, 7, 68, 69, 70] and papers in journals such as “Social Networks” [71].
Although sociometric research has contributed to the understanding of society, the collected data are still subjected to criticism because of the difficulty to define and associate intensities to some types of relation between two persons. Personal relations based on feelings, thoughts, trust or friendship deeply depend on the cultural environment, the sex and/or age of the actors involved and even on the current political and economical context. As an example, if the Milgram classical experiment [66, 67] had been done in Brazil, it would be needed to be redesigned since in this country most people are called by the first name and relationships are less formal. In other words, the concept of acquaintance seems to vary according to the country. In addition, in sexual networks, Liljeros et al. [72] suggested that men may overtell their sexual partners because of social expectations. In music, the level of similarity between two bands may be divergent if assigned by musical experts or enthusiastic fans [73]. Complex networks theory has also been considered to model regional interaction patterns in archaeological contexts. This approach allows to treat the interactions between sites in geographical space in terms of a network which minimizes an associated Hamiltonian [74, 75].
Trying to overcome this bias, sociologists prepared extensive questionnaires and cross-compared the responses obtained to achieve reliable data. However, the interview process is time-consuming and expensive if one wants to get a significant sample size. On the other hand, researchers have also investigated systems, such as the collaboration and citation social networks, where the rules specifying the relation between the actors are quite clear, which guarantees some common ground for defining the network. Both types of approaches have benefited from the increase of World Wide Web popularity [76, 77]. The pleasure to be world visible, to contribute to global knowledge, to share thoughts, or only to make unusual friends or find partners have contributed to an increasing number of members in all types of virtual social environments. Tools like blogs, photoblogs, messengers, emails, social network services and even a complete social environment such as “Second Life” [78] are now widespread for all ages and genders [77, 79]. Although these virtual networks reflect only a piece of the world population and somehow specific types of relations, they usually provide a significant statistical sample and possibly unbiased features of the social relations they represent. In addition, there are extensive electronic databases about music, theater, sports, scientific papers and other fields which have contributed to construct reliable social networks faster and more accurately than ever [76, 79]. One needs nevertheless to be cautious when inferring behavioral and social conclusions from those specific networks, especially when dealing with dynamical variables.
In the following sections, we shall focus on describing the results on social networks by using mainly the methods adopted or developed by the complex network community in the last years [21, 23, 19, 24], considering real-world data. We present the most important and common structural properties in several types of social networks such as degree distributions, community structure and the evolution of topological measurements, reporting their relation with social features when available.
3.1 Personal Relations
Personal relations are possibly the most important and oldest network type from the sociological point of view. Since people can establish contact with other individuals in several ways, networks of this kind ultimately provide information about the structure of society. Personal relations can be divided into several classes ranging from friendship to professional relations, including sexual [72] and trust networks [80, 81], or email [82] and blogs [83, 84]. In a search for a universal behavior, the concept of personal relations was extended to other species such as wasps [85] and dolphins [86]. Since this topic includes the majority of social networks ever studied, we separate the various subjects into sub-sections for the sake of better organization.
3.1.1 Movie Actors
An important class of social acquaintances is related to professional actors participating in a movie. In terms of the artistic scene, such a network can provide a glimpse of the popularity of one actor along his career as well as individual fame. Despite the vast selection of movies in the Internet Movie Database (http://us.imdb.com), the film actors network is structurally small-world with high clustering coefficient. This means a well-defined tendency of actors to play with common partners [33]. Possibly because of the number of actors in a single movie and the number of movies an actor takes part along the career, the average degree is significantly large (). The popularity of some actors and the short life time of the majority could explain the power-law regime () observed for large in the distribution of actors partners [87]. Amaral and collaborators [88] pointed out that this distribution indeed is truncated by an exponential tail which could be an effect of aging, i.e., all actors naturally end their careers at some point. This conclusion is emphasized by the results of Zhang et al. [89] who argue that when considering multiple edges between actors, a stretched exponential distribution fits the data (the same functional form was used to obtain a good fit on a network of Chinese recipes [89]).
3.1.2 Acquaintances
Popular folklore is fascinated by the so-called “six degrees of separation” concept, resulting from the Milgram’s famous social experiment, which suggests that any two randomly chosen people are separated by six intermediate individuals on average. Since the experiment was done completely inside the USA, a question remained of whether the six degrees also applied to the whole world. Taking advantage of the email system, Dodds et al. organized a similar worldwide experiment involving any interested person [90] and found, in accordance with Milgram’s results, that the diameter of social acquaintances varied between and , whether only completed chains were considered or not (in the latter case, they estimated the value). The carefully organized experiment detected that successful chains depend on the type of relationship between senders and receivers, and not on the connectivity of the individuals. The most useful category of social tie was medium-strength friendships that originated in the workplace. Geography clearly dominated in the early stages of the chain, while occupation tended to dominate the final stages.
Although interesting, this kind of social experiment depends largely on peoples’ motivation to participate (being limited by lack of interest, time or incentive) [90]. To overcome this experimental bias, already-established ties of acquaintances are usually investigated. The “blog” services were used by Bachnik et al., who found power-law in out- and in-degree distributions (exponents ranging from nearly to ) and small-world property for providers with three different numbers of members [83]. The “blogs” databases are large, but are also considerably sparse, with most members isolated. On the other hand, Zakharov investigated the LiveJournal service and found a small-world network with a large giant component containing nearly users [84]. Possibly the biggest social network ever investigated, this structure took 14 days and 2 computers to be crawled. He found a power-law () for which corresponds to actively participating users, while not so active users with few connections led to a plateau in the distribution. The effect of opinion formation in a network like that would be particularly interesting to investigate since it has a high level of clustering () and connection reciprocity (nearly of the edges are bi-directional). However, this network has a limitation in the total number of friends per user () and only of them are listed on the users’ info page, which clearly affects the flow of information. Upon using a new diffusion method, Zakharov identified some communities considerably fast [84].
Using phone calls records within a period of 18 months, involving approximately 20 per cent of a country’s population, Onnela et al. [91, 92] constructed a network with nodes and edges. The nodes represent users and a connection is established when two users called and received calls from each other. Moreover, the weights represented the duration of calls between two users. The degree and strength distributions could be approximated by power-laws (respectively, and ). A careful analysis of degree and weight correlations was carried out [91], in which strong ties appeared between members of circles of friends, while most connections between different communities were weak. As a consequence, the removal of strong ties has basically local effects (within communities). In contrast, when weak connections are removed, communication between different communities may be disrupted, causing collapse of the whole network. It is worth noting that information diffusion was tested in such weighted network using an equivalent SI (Susceptible Infected) epidemiologic model. They found that the majority of the nodes were first infected through ties of intermediate strength with a peak at 100 seconds [92], which means that most of the nodes were infected after 100 seconds.
A student affiliation network was built by Holme and collaborators, from officially registered classmates during a period of 9 years in Ajou University [93]. Considering the weight of the network as inversely proportional to the number of students attending the course (which is related to the social proximity between the students) and assuming that old courses contribute less than new ones to this social strength, they found that students become more peripheral with time in the network, whose core comprises mainly freshman students. Interestingly, fellow students become strongly tied over time owing to a decrease in the number of classmates. Using questionnaires data from middle and high school students in the USA, Gonzalez et al. analyzed the resulting friendship network [94]. They found that when considering only mutual connections (bi-directional edges), the network results in a set of various connected components. The friendship networks were identified as assortative with a degree distribution with a sharp cutoff. However, the c-networks built with connections between communities identified with the k-clique percolation method were disassortative, with scale-free degree distribution. From a comparison of node pairs with given ethnicities in relation to the random network, they found that the common behavior for each ethnic group is to nominate friends of the same ethnicity than from any of the other ethnicities. Interestingly, an asymmetry with respect to the composition was observed in case of inter-ethnic nominations. For instance, both blacks and whites show increasing homophily as they get into minorities; however, minor black groups get more integrated than the white ones when involved in other ethnic majorities [94].
3.1.3 Email
The establishment of networks encouraged communication between individuals. Guimerà et al. obtained an email network for the University at Rovira i Virgili [82]. This intrinsically directional network was converted to an undirected version by assigning connections between two individuals whenever they sent and received messages from the same partner. As in the LiveJournal case, the network displayed small-world and high clustering () in the giant component, but with an exponential cumulative degree distribution ( with for ). On the other hand, the community structure was self-similar with heavily skewed community-size distribution in the range – and sharp subsequent decay [82, 95]. The self-similarity means that the organization is similar at different levels, i.e. individuals form teams, teams join to form departments, departments join to form colleges, and so on. Valverde et al. [85] constructed a network using data from the email traffic between members of Open Source Software Communities (OSS) and found that the weight distribution follows, on average, a power-law with two regimes ( and ) in the case of small communities and with one regime for a large community [85]. The latter community also presented a power-law in the strength distribution ().
3.1.4 Trust
From the hierarchical point of view, the network of trust can be viewed as a special sub-network of the acquaintances network, where the strongest connections in the latter could be related to connections of the former network. The lack of reliable data about trustful partnerships motivated the studies to concentrate on electronic trust ties. The PGP (Pretty Good Privacy) encryption algorithm lets one user certify another one by signing his public encryption key; in other words, the first user creates a directional connection to the second one if he trusts that the second is really what he says he is. By looking the in- and out-degree, Guardiola et al. found a power-law degree distribution with exponents, respectively, and [80]. Interestingly, the network is composed of many strongly connected components in which the clustering coefficients are independent of the component size. The network was found extremely fragile against attack while the strongly connected structure remained essentially unaffected. Boguñá et al. considered only bidirectional signatures in the PGP web of trust [81] which resulted in a stronger sense of trust since both sides must sign each other’s keys. The giant component presented a two regime power-law degree distribution with exponents (for ) and . The clustering is large and nearly constant as a function of the degree, but the network is assortative. Finally, using the Girvan and Newman community detection algorithm, a scale-free community distribution () was identified. The evolutionary Prisoner’s Dilemma has been investigated in a substrate of this network and in an e-mail network as well. It was found that the connectivity between communities and their internal structure affect the evolution of cooperation [96].
3.1.5 Sexual Relations
Even though sexual relations between individuals do not necessarily correspond to acquaintance relations, sexual partners can become social partners and vice-versa. Analyzing a random sample of individuals aged between and years old in Sweden, Liljeros et al. [72] found, in a study within a period of months, a cumulative power-law distribution of partners with exponents and , respectively, for women and men. These exponents are quite close, but the average number of partners is larger for men than for women, which is explained by the fact that men may inflate their number of partners because of social expectations. Interestingly, for the whole life-time another cumulative power-law distribution was found, but with smaller exponents, (women) and (men). The scale-free structure of such network was suggested to emerge from the increased skills in acquiring new partners as the number of previous partners also grows, in the same way of “the rich get richer” paradigm. The main result is that the core-group (i.e. groups of risk) concept may be arbitrary in such networks since there is no well-defined boundary between core groups and other individuals and therefore, safe-sex campaigns should be focused on highly connected individuals to prevent propagation of sexually transmitted diseases. However, by using statistical methods in the same and different data, Jones et al. [97] argued that the method used by Liljeros and collaborators to find the exponent of the number of partners distribution had statistical problems. They concluded that the preferential attachment process may not be the only cause generating real sexual networks as proposed. They explained that targeting at-risk core groups has a proven efficiency in reducing disease incidence although degree-based interventions have already been proposed in the past and could be also adopted to lower the reproductive rate of sexually transmitted diseases. Finally, they suggested that other structural properties such as concurrency and local clustering have significant impact on epidemic processes since infinite-variance networks have different internal structures, affecting the spreading processes.
In a review paper [98], Liljeros explores the complexity of the mechanisms contributing to spreading of sexually transmitted diseases, and concludes that one single solution for the problem is far from being found, even though the underlying structure of the sexual web contributes to this dynamics. Indeed, broad and targeted interventions have both been proven to be effective.
Other networks were constructed using smaller datasets [99, 100, 101, 102] which described populations of different countries and specific regions. The uncertain scale-free behavior of such a distribution of partners has motivated interesting discussions on the internal structure [103] and dynamics of sexual interactions [100]. For instance, González and collaborators suggested a model to capture structural features of a homo- and a heterosexual network. They found that the clustering coefficient, the number of triangles and squares are relatively small, which can be better explained with their model than with the BA model [100]. Analyzing different periods of time, Blasio et al. found evidences of nonrandom, sublinear preferential attachment for the growth in the number of partners for heterosexual Norwegians [101]. It is worth noting for epidemic spreading that sexual behavior is observed to be slightly different for men and women. For instance, men tend to have more sexual partners on average [72, 102] and, in a specific region [102], the number of sex contacts decreases with the number of partners for women while being kept constant for men. At the same time that individuals with many partners can potentially spread a disease to more people, the chance to transmit to a specific partner is lower because of less intense sexual activity.
Also worth analyzing is the network of romantic communication, though it is not necessarily related to sexual contacts. Holme and collaborators [104] observed that during the period considered in their study, both the number of members and the average degree grew with time but with decreasing growth rate. This is partly explained by the fact that old members log on for the first time during the sampling period. Reciprocity depends on the type of relationship established in the virtual community and is rather low. Furthermore, the number of triangles is smaller than the number of 4-circuits and the network apparently presents dissasortative mixing. The cumulative degree distributions were highly skewed, but not with pure power-law form [104].
3.1.6 Sports
The sports field is particularly interesting because of its dynamical nature, as teams constantly change players, there are dozens of collective sports involving interaction between people, championships range from local to world size scale, and so on. However, little attention has been given to such dynamical systems in terms of networks. As one of the tests of their community detection algorithm, Girvan and Newman investigated the community structure of the United States college football in the 2000 season [38]. The nodes represented teams connected by edges expressing regular-season games between those teams. Although teams are divided into conferences which imply more games between those members, interconference games are usual, which generates a complex structure involving all participants. With their algorithm, they were able to identify the conferences with high precision. The North American college football league was also a motivation for a ranking system based on a directed complex network where the direction represented wins or losses of a specific team (the nodes) [105]. The method was based on the idea that if a team A can beat a team B and B can beat a team C, then A most probably will beat C. The resulting ranking for a season was compared with the official method with good agreement.
A complex network study of Brazilian soccer players was carried out by Onody and Castro [106]. Initially, a bi-partite network was built where one type of node represented the teams while the other represented the players. They found an exponential law in the probability that a player has worked in a given number of clubs . To investigate the topological properties, they merged those nodes in such a way that two players became connected if they were in the same team at the same time. The final network exhibited an exponential degree distribution such that . The time evolution of that network showed that although its size became more than five times larger in the period from to , the network maintained the small-world characteristic. They suggested that the clustering coefficient had a small decrease because of the exodus of a considerable number of players in the last decades while the average degree became 20% higher, possibly because of the increase in the transfer rate and/or in the professional life-time. The network became more assortative with time, suggesting a growing segregationist pattern where teams with similar importance preferentially transfer players between themselves.
3.1.7 Comics
Differently from the actors network where the social ties are professional, the comics network are composed by characters whose connections can be constrained by other factors such as moral rules, as pointed out by Gleiser [107]. Therefore, though both networks are related in some level, they have fundamental differences which can be captured by structural measurements.
The social relation between Marvel characters was investigated in terms of a bi-partite network (characters and books) where two characters were connected through the appearance into the same comic book, with connections representing both “professional” and family ties. Although the Marvel universe tries to reproduce human relations, Alberich and collaborators concluded that the clustering coefficient and average degree showed a considerable smaller value than usual real social networks [108]. The resulting network has a small diameter. Perhaps as a result of personal fame, Captain America and Spider Man are examples of hubs which contribute to the power-law with cutoff observed in the distribution of the number of partners in this collection of stories [108]. Contrasts between this specific artificial network with real ones were suggested by the results of Gleiser [107]. The analysis of degree correlations indicated no correlation up to and disassortativity after this value. The clustering coefficient as a function of the degree clearly showed the existence of a hierarchy of nodes. In order to extract the intensity of relations between the characters, a weighted network counting the number of times two characters appeared together was adopted, leading to a power-law strength distribution with (). He also found that the hubs are basically heroes that connect different communities. The fact that villains appear only around hubs can be a result of the Comics Association rules, which state, for instance, that the good has always to succeed against the evil. These constraints imply that this artificial social network differs from a real social net.
A different network related to comics stories was built by considering the cross-talk or comic dialogue (Xiangsheng) folk art of China [109]. The network is small, but exhibits interesting features. Most of the comic dialogues involve two players and the number of dialogues an actor has played follows a power law (). The projection onto a non-bipartite network showed that the collaboration is highly clustered and could contain a hierarchical, modular structure. Moreover, the network has some disassortativity and is small-world. These results suggested that the main actors tend to repeat dialogues with the same collaborators.
3.1.8 Non-human relations
While investigating networks of wasps in which the weights were given by the number of dominances (hierarchy) of one wasp over the other, Valverde and collaborators found networks with weight distribution similar to the small OSS communities [85]. Another non-human social experiment was carried out by Lusseau [86], where social acquaintance of dolphins was defined as preferred companionship, i.e. individuals that were seen together more often than expected by chance. The data took years of observations and showed that the emerging network is small-world with high clustering coefficient. The data set is relatively small, but it is argued that the tail of the number of acquaintances distribution follows a power-law (). The dolphin network is resilient to random attacks, but targeted attacks increase the diameter of the network, although the random attacks are not enough to fragment the network into small connected components. This effect is possibly a consequence of the non-power-law interval for a small number of acquaintances. The hubs were identified to be mainly adult, old females [86].
3.2 Music
Professional music relations could be included in the section of personal relations, but we have singled music out because different types of networks have been studied. In terms of professional relations, Gleiser and Danon [110] proposed a network where two musicians were connected if they played in the same jazz band. This connection mechanism resulted in an assortative, small-world network with high clustering and degree distribution following . For the information collected dating back to the 1930’s and 1940’s, interesting social aspects were extracted from the network. Studying the community structure with the Girvan and Newman algorithm, they found a clear segregation pattern of black and white musicians in this collaboration network and that the cumulative distribution of community sizes presents a power-law with [110]. The network of collaboration between rappers was constructed by Smith [111] considering two rappers connected whenever they recorded together. The resulting network is also a small-world with high clustering and a partnership distribution following a power-law ().
No correlations were found between topological measurements such as betweenness and node degree, or between an index of record sales and starting release year, i.e. high level of collaboration is not related to commercial popularity. Differently from the jazz music network, the community analysis used a weighted network and then a “clearing algorithm” to convert the weighted network to a non-weighted version such that the most important edges were extracted [111]. Considering only the connections, the fast modularity community structure algorithm [112] was applied and could only identify small and peripheral rap groups. When the clique percolation method was applied [113], groups and geographical regions were identified correctly but the same did not apply to music labels. The level of communities (groups, music labels, regional/community affiliation) identified could be controlled by a parameter in the clearing algorithm and then applying the clique percolation method. Both jazz and hip-hop networks are relatively small, with considerable high average degree.
Another collaborative network was built by Park et al. [114] who used data extracted from the allmusic.com database. They constructed a network of similarity between artists using the same database and investigated the topological properties of both networks and the resulting networks obtained when intersecting them, i.e. the networks obtained from only common nodes in both networks. The method is interesting for comparison of the same dataset for different social ties. However, the overall properties did not change considerably, and the collaboration network before and after the intersection process presented power-law , while the similarity network had exponential degree distribution with (before) and (after intersection). The small-world and high clustering features were maintained after the intersection process. Interestingly, only 464 common edges (about of the total) were identified in the intersection of both networks which indicates that having worked together does not necessarily translate into being classified as musically similar. The similarity network was assortative while the collaboration was partly assortative. The cumulative fraction of betweenness displayed a power-law in all networks studied.
The similarity between artists was extensively investigated by Cano et al. [73] by using four online databases which differ in the way similarity is assigned (by user habits or musical knowledge and by musical experts). Those networks are larger than the musicians networks above, though preserving the small-world property with high clustering. They found that user rating networks resulted in power-law in-degree distributions , while experts classification mechanisms resulted in networks with exponential decay. The out-degree distributions follow the same shape with cut-offs due to clear limitations in the web-pages usability constraint (the recommendations should fit in one web-page). The power-law behavior for the degree distribution was confirmed in an experiment where users sent playlists such that two artists were connected if they appeared together. An exponential decay emerged in the case of a user selecting the most similar artist to a given one in a list of 10 possibilities [73].
Lambiotte and Ausloos analyzed a website dedicated to sharing musical habits [115, 116] using a percolation-based method to identify social groups and music genres according to personal habits. Non-trivial connections between the listeners and music groups were identified, with some empirical subdivisions obeying standard genre classification while others did not. By analysing the original bi-partite network, a power-law () was observed for the distribution in the number of listeners of a specific music group while an exponential () was fitted in the case of the number of music groups per user [115]. They further improved the methodology mapping music groups into genres using online listeners records. Analyzing different tags given by listeners to classify music groups, they observed that similar groups tend to be listened by the same people [116].
The Brazilian popular music network was constructed by connecting two song writers with a common singer [117]. The network presents small-world feature, high clustering and high average connectivity. The cumulative degree distribution is fitted by an exponentially truncated power-law with .
At the level of personal ties, a network of jazz bands was built with two bands being connected if they had a musician in common, from which another segregation was found between black and white musicians [110]. That network presented small-world, high clustering, with the degree distribution following an exponential function . Using the Girvan and Newman community detection algorithm, they found a polarization in two big communities representing the major records locations, namely, Chicago and New York. The New York community split up into two other communities corresponding to another segregation between black and white musicians [110]. In these networks, an example of errors in the acquired data is the inclusion of the same musician appearing with different names, as pointed out in the jazz network [110]. Similarly, errors occur in the Brazilian musician network, which includes anonymous musicians concentrating a large number of connections [117].
3.3 Collaborations
The topic of scientific collaboration can be understood as a sub-topic of personal relations, being linked to professional (academic) ties between scientists. It deserves special section for its relevance in terms of knowledge dissemination. From the several databases investigated, common features were identified, even though the sizes and some structural properties depend on the field of interest. Newman built networks from databases of sizes varying from to papers and compared the topological properties in a given time interval. The distribution of number of papers is well fitted by a power-law for two databases ( for Medline and for NCSTRL) and by an exponentially truncated power-law for the Los Alamos Archive [118, 16]. The evolutionary computation (EC) co-authorship network had a power-law () [119] as well. The distributions of number of authors displayed a power-law shape in all four databases investigated by Newman () and in the EC data (), with the largest collaboration project containing people. In case of arXiv (cond-mat) data restricted to network papers, this distribution is fitted by an exponential () [120]. Purely theoretical papers appear to be the work of two scientists on average, according to results for mathematics and sociology. The latter were also found to contain a small number of collaborations although suggesting an increase in the collaboration rate in the last decades [121, 122]. On the other hand, experimental and interdisciplinary subjects have higher average collaboration rate, reaching about authors per paper in high-energy physics. An intermediate collaboration rate () was identified in topic-specific fields (“networks” and “granular-media”) [123].
The histogram of the number of collaborators per author fits a power-law in many databases with exponents varying from to [119, 122, 121]. The only difference appears in some networks investigated by Newman, which exhibited two power law slopes ( and ). It is also not clear to fit a topic-specific database [123]. Interestingly, Cotta and collaborators pointed out that the most prolific authors are not necessarily the most connected, but in fact they have diverse interests which motivate collaborations. They also found that the number of collaborators strongly correlates with the number of papers [119].
Only the network of sociologists has been found not to be small-world, possibly because of the large number of research areas with little collaboration between them. The conclusion is reinforced by the small clustering observed [122]. The Medline database presents small clustering, as a result of the tree-like structure (“principal investigator” with several post-docs) akin to biomedical research [118, 16]. The other databases are characterized by a high degree of clustering [119]. The clustering coefficient decays and the degree of an author increases with time in the case of neuroscience and mathematics [121]. The growth of the giant component of these two latter subjects is consistent with the increasing collaboration rate over the last years. Newman verified that for most authors, the paths between them and other scientists go through just one or two of their collaborators (funneling effect). The average distance to all authors decreased with increasing number of collaborations [124, 16, 119]. In terms of knowledge diffusion, the average distance is important because it measures the centrality of an author in terms of its access to information. On the other hand, betweenness is a measure of author’s control over information flowing between other scientists [124, 16].
Girvan and Newman tested their algorithm to detect communities in a database of co-authorship of papers, books and technical reports of the Santa Fe Institute between 1999 and 2000 [38]. They found that scientists are grouped into two types of similarity, either of research topic or methodology. The same method was used by Arenas and collaborators to identify communities in two networks of co-authors [95]. Initially, they considered the panels contributions of Statistical Physics conferences in Spain over a period of years and took the final co-authorship network. They found that collaboration is more common within the same institution and that the emergent community size distribution follows a power-law (). The arXiv network has a two-slope power law in the same distribution with exponents (with strength ) and () [95]. The community in collaboration network was also addressed by considering hierarchical measurements in a scientific institutional collaboration network [125]. In this case, the authors identified different patterns of authorship emerging from different research areas. Using arXiv data (cond-mat only) restricted to papers whose abstract contain the word “network”, Lambiotte and Ausloos [120] found that the distribution of connected components roughly follows a power-law (). Analyzing the collaboration network of scientists restricted to two fields, they observed a transition in the largest connected component from one of the fields to the other along a period of time, i.e. most of the collaboration was dominated by one of the fields in each phase [123]. Moreover, other smaller drastic events were observed during the period of analysis.
Li et al. considered a different weight function while investigating the collaboration network between econophysics authors from 1992 to 2003/2004 [126]. The nodes represented scientists and the weights between two scientists were obtained by summing three functions, where each function represents one type of relation between them. The first counts the number of co-authorships, the second counts the number of citations and the last, the acknowledgements. Each function expresses a different contribution to the final weight value according to their relevance in the final report. They found that the degree and weight Zipf plots have an undefined shape and did not change when considering two snapshots (with one year of difference between them) of the collaboration database, though individual nodes changed considerably their importance in the network (measured by their betweenness) [127, 126]. The network has a small giant component (with about of the total nodes), small clustering and large average shortest paths when compared to other collaboration networks. They found that the weight affects slightly the edge and node betweenness distributions. By using only the amount of collaboration between co-authors, they investigated the community structure in the giant component of such a network. They used the Girvan and Newman algorithm and hierarchical clustering. The first algorithm provided the best results, classifying scientists belonging to the same university, institute or interested in similar research topics. The second one classified modules, but the result was not consistent with real data. They found that the members of each community changed considerably depending on whether the weights are taken into account [128].
Barabási and collaborators suggested that for the evolution of the collaboration network, the small and finite time interval might affect the results leading to incorrect conclusions because of incomplete data. Such a trend was identified by observing that the average shortest path decreased with time (and size of the network) while it was expected to increase [121]. Although important, proceedings editorship cannot be seen in the same level of peer-reviewed papers. Cotta and collaborators argued that proceedings collaborations should be removed since they bias considerably the shortest path distribution, as they include authors from different thematic subjects and create long-distance edges. They also suggested to analyze separately the distinct types of scientific reports since different types of collaboration are reflected in such reports [119]. Some care should be taken when considering the original data because two authors might appear with the same name or one author might identify himself in different ways on different papers. To overcome this problem, Newman ran the measurements twice, first considering the network obtained by the author’s surname and first initial only, and a second version considering the surname and all initials [118].
3.4 Religion
The importance of religion in the ancient and contemporary society is unquestionable; despite some fluctuations along the years, religion always played a central role in the history of humanity. Choi and Kim used a Greek and Roman mythology dictionary to analyze the relation between the mythological and fascinating characters of that time [129]. Using a directed network, they associated outgoing links with a specific entry of a character in the dictionary and the incoming links were related to characters appearing in the corresponding explanation field of that specific character. It means that Heracles, for instance, has the most number of outgoing links which reflects that he gave origin to many great events by himself. On the other hand, Zeus concentrates a high number of incoming links since he appeared as a supporting character in different myth tales. The degree distributions resulted in power-laws with exponents between and . The close relation between different characters is visible by looking the small-world feature and the high clustering of common neighbors. Furthermore, a hierarchical structure was observed, which had two main origins: genealogical tree and the native class to which a myth character belongs, e.g., gods, titans, heroes. The distribution of local cyclic coefficients displayed two peaks that correspond to tree-like and triangular patterns [129].
In the medieval church, there was a big concern about heresy, which is fundamentally an opinion at variance with established religious beliefs professed by a baptized church member. Since heresies were against the official beliefs of the church, their propagation was punished and avoided. The inquisitors recognized that they should target the most connected people, i.e. the people responsible of propagating those ideas, which resulted on much more effective results [58]. A qualitative analogy of historical facts and epidemic spreading on networks led Ormerod and Roach to suggest that the spreading of medieval heresy resembles a disease diffusion in a scale-free network [58].
3.5 Organizational Management
The growth of interdisciplinary research can be identified by data related to national or continental research funding proposals. Based on data from the National Natural Science Foundation of China (NSFC), Liu and collaborators constructed a network of related research areas [130]. Since each proposal to the foundation provides two fields to specify different areas, they took each research area as a node, with two nodes being connected if they appeared in the same proposal. The cumulative degree distribution followed the function for the period between and . The growth of interdisciplinarity could be identified by the increase in the average degree and clustering, and by the decrease in the average distance. The network tends to be disassortative with time.
At the level of organizations, Barber et al. [131] and Lozano et al. [132] built networks based on the European-Union Framework Programs (FP) for Research and Technological Development. They got a bi-partite network from the first four FPs, with one node-type representing the research projects and the other type representing the organizations. The connections were assigned by considering organizations which collaborate in common projects. Network properties were extracted from the intersection graph. The distributions of project (number of organizations taking part in one project) and organization (number of projects in which an organization takes part) sizes exhibited power-laws, respectively, with and for larger values, which remain stable over the three last periods considered. This indicates that the organizations participating in a particular number of programs in each FP were not altered in spite of changes in the research activities. The network is highly clustered, small-world, and the number of triangles increased linearly with the degree of the node [131]. Using data from the 6th FP, Lozano et al. obtained a different network where two organizations were connected whenever they had collaborated at least in two projects. The degree distribution had an undefined shape and the analysis focused on detecting communities by a new algorithm, which was able to classify communities according to their type (industries or research centers), nationality or services providers [132].
The network of the United States House of Representatives from the 101st to 108th Congresses was investigated by Porter and collaborators [133]. Initially, they built a network with two types of nodes which corresponded to Representatives and committees, with edges connecting each Representative to the committees. Then, another network was created whose nodes represent the committees while the edges indicate common membership between committees. They found evidence for several levels of hierarchy within the network of committees and identified some close connections between committees without incorporating any knowledge of political events or positions. They identified correlations between committee assignments and political positions of the Representatives. Finally, they verified that the network structure across different Congresses has changed, especially after the shift in the majority party from Democrats to Republicans in the 104th House.
The networks of product development for different industries were characterized by Braha and Bar-Yam [134, 135, 136]. In these networks, two tasks are connected by arcs if the first task feeds information to the second task. The resulting network was highly clustered with small average distance, which reflects the optimization of the networks and unavoidable iterative nature of the design process. They found that in-degree distributions always presented a scale-free behavior with cutoff, while out-degree distributions were scale-free with and without cutoff, which can be related to the fact that transmission of information is often less constrained than reception [134, 135, 136].
4 Communication
The study of the structure and function of social networks has always been constrained by practical difficulties of mapping the interactions of a large number of individuals. The construction of these networks is based on questionnaire data, which reaches only a few number of individuals and depends on the personal opinion about their ties. With the advent of the Internet and with the use of phone and mobiles, a large amount of data can be recorded for further analysis. These communication networks are useful not only for providing better data for the study of social networks but also for economical reasons. Here we discuss the email, call graph, and wireless networks.
4.1 Communication by email
Email has become one of the most important means of communication, being largely used in business, social, and technical relationships. Email exchanges therefore provide plentiful of data on personal communication in an electronic form, amenable to build social networks automatically. Email networks also provide one of the major means of computer virus spreading. Another important related aspect concerns email topic classification [137].
There are two ways to construct email networks: (i) vertices are email addresses and there is a directed arc from vertex to vertex if sends at least one email to (this network is obtained by the log files of email servers) [138, 139, 140]; (ii) vertices are also email addresses but there is a directed arc from vertex to vertex if is in the address book of vertex (this network is obtained from the email book of several users of a specific institution) [141, 140]. Ebel et al. [138], however, studied these networks by considering them as with undirected arcs where email addresses are connected if at least an email was exchanged between them.
All collected email networks studied were obtained from university email servers [138, 141, 82, 140] except the email network from the HP Labs mail server [139]. These networks can be very large, with the largest being the email network of the Kiel University [138] with 59,812 vertices, and the smallest, the email network of University at Rovira i Virgili in Tarragona, Spain [82], which contains only 1,667 vertices. All of these email networks have the small-world and the scale-free properties [138, 139, 140, 141, 82]. Tyler et al. [139] and Gimerà et al. [82] also found that email networks are composed of communities and proposed methodologies to find them. Braha and Bar-Yam [142] showed that vertex degree and betweenness of such kind of networks change dramatically from day to day, suggesting a reinterpretation of “hubs” in dynamical networks.
A model of an evolving email network was proposed by Wang and Wilde [140] and is based on addition and deletion of links between users, and on the user email checking time. Zou et al. [143] proposed a model for simulating the email spreading of virus and immunization, which is also based on the user email checking time and his/her probability of opening email attachments. They showed that viruses spread more quickly on scale-free networks than on small-world and random networks, and that the immunization defense is more effective on the first kind of network than on the other two.
The free software package EmailNet for email traffic mining generates the email network for further analysis, and provides an interface for visualization of the networks (available at http://ipresearch.net/emailnet [144]).
4.2 Telephone
Telephone call graphs are obtained from telephone calls completed during a specified time period. The vertices are the telephone numbers, and a connection from vertex to vertex is present if during the specified period there was a call from to ; the established arc has naturally a direction, with at the tail and at the head. Such graphs can be very large; for example, a one-day call graph used by Abello et al. has more than 50 million vertices and 170 million edges [145]. Aiello, Chung and Lu [146] found power laws for the in-degree and out-degree distributions, as well as for the distribution of components with a given size (excluding the giant component) in a telephone call graph. A similar study was done for mobile phones by Nanavati et al. [147]. They analyzed local calls in four different regions for two different periods (one week and one month); despite social differences in the regions and the different periods used, the results are similar. The average degree varies from to , with a clustering coefficient from to . The distribution of in-degrees and out-degrees is close to a power-law, with exponents and , respectively. There is a significant correlation between the in-degree and the out-degree of vertices, which means that people that receive many calls also generate many calls. With respect to nodes connected by a call, assortativity is present for the in-degree of the caller with in- and out-degree of the receiver; for the out-degree of the caller, weak disassortativity with in- and out-degree of the called was detected. That is to say, vertices that receive many calls tend to call vertices that also receive and generate many calls, and vertices that receive few calls tend to be connected with vertices that receive and generate few calls; on the other hand, the number of calls generated by the caller is not a good predictor for the connectivity of the receiver. A giant strongly connected component and a power law distribution of the remaining components were also detected.
Onnela et al. [92, 91] considered the call graph of a mobile operator, but included only reciprocal calls in the graph, i.e. an undirected edge is present between nodes and only if called and called during the considered time interval; calls for numbers of other operators were not included. The largest connected component of this network has a degree distribution with a tail of the form but with significantly larger exponent () than the networks discussed above. The number of calls made between two telephone number and the total duration of the calls were used as two different weighting criteria. The distribution of strengths shows that most users make few, brief calls, but some make a large number of calls, with some pairs of users chatting for hours. The network is assortative, confirming previous results for a social network. The authors also found that the overlap of the neighbors of two vertices is proportional to the weight of their connection, therefore corroborating experimentally the “weak ties hypothesis” of Granovetter [148].
Lambiotte et al. [149] analysed the call graph of a Belgian mobile phone company with 2.5 million customers and 810 million calls or text messages over a period of 6 months. In order to eliminate accidental calls, a link between customers and is considered only if there were at least six reciprocal calls between them during the time considered. The authors showed that this network has power-law degree distribution with and that the probability of two customers being connected is proportional to , where is the geographic distance between them. Blondel et al. [150] concluded that the same network also exhibits hierarchical communities.
In order to understand the telephone traffic, a model which represents the customer network behavior in real world has to be taken into account. Unlike classic traffic analysis where a fully connected customer network is considered, Xia et al. [151] employed a model for the customer network based on the scale-free property and showed that the structure of the customer network is more likely to cause call blockings than the limited capacity of the telephone network.
The data available of mobile phone companies can also be used to analyze the pattern behavior of the customers. González et al. [152] used the trajectory of 100,000 mobile phone users over a period of six months to understand their mobility pattern behavior and found that, despite the prediction of random trajectories in [153], the human trajectories have some regularities, like being characterized by small traveling length and a high probability of returning to few locations. These patterns are important for disease prevention, urban planning, and social modeling.
4.3 Wireless
In wireless networks, mobile stations (mobile nodes) connect through access points to the Internet. Each mobile node can connect at different access points at different times. Hsu and Helmy [154, 155] studied the patterns of connectivity of mobile nodes to access points, and constructed a network based on encounter between nodes. Two nodes are said to encounter each other if there is an overlap of their connections to the same access point. Each mobile node is a node in the network, and a link is created between two nodes if there is an encounter between them in a specified interval of time. The authors found that the network was sparse, with nodes having encounter with just a few neighbors in average (with a node connected to about 1.88% to 5.94% of all the nodes, depending on the data set considered), following a bi-Pareto distribution. The graph has short average distances and high clustering coefficient. The high clustering is attributed to the fact that nodes have a “home” access point, and all nodes with the same access point have a high probability of being connected, giving rise to cliques. The average distance is small due to the presence of some nodes in these cliques that connect to nodes in other access points, generating a “small-world” effect.
In conclusion, communication networks, besides being important means to represent social networks, also deserve special attention for economical reasons, since such kind of networks include everybody. Communication networks are generally huge, with millions of vertices, have the small-world property, degree distribution with power law tail, and community structure. The main results obtained for these networks are: (i) a definition of a hub has to reinterpreted in email networks, because the vertex degree and betweenness change dramatically from day to day; (ii) in the case of call graphs, the overlap of two neighbors is proportional of the weight of their connection; (iii) the probability of two vertices being connected in call graphs is inversely proportional to the square of their geographic distance; (iv) the mobility behavior of customers in mobile call graphs is not random; instead, it has some regularities. Further works could extend the analysis of such data and develop models to describe the features observed.
5 Economy
Trade, currency, industrial production, wealth distribution and tourism are important target studies of economy. These systems can be considered as formed by discrete parts that interact in a defined way [156]. For instance, trade/commerce is the voluntary exchange of goods, services, or both. In this way, a network can be generated by this activity associating nodes to countries and considering the in- and out-degree as representing, respectively, the imports and exports between these countries. In this section, we show how complex networks theory can be used to model economical relationship.
5.1 Trade networks
Economic relations are currently enlarged owing to the even increasing number of commercial partners due to globalization. Trades at a personal level have substantially increased with e-commerce, but the gross market between countries is still a business of companies. Trying to unveil this fascinating economical complex system of trades between countries, Serrano and Boguñá studied the so-called world trade web [157]. A network was built by assigning a node to each country and considering the in- and out-degree as representing, respectively, the imports and exports between countries. For the non-weighted directed network, they found the in- and out-degree correlation to be very high (), with of reciprocity. A power-law function emerged with exponent for in the number of commercial partners, regardless of whether the in-, out- or undirected degree distribution were considered. The intense trade activity between countries exhibits the small-world property, a high clustering coefficient, and large average degrees. A positive correlation between the number of trade channels and the country’s economical wealth was identified, with some exceptions for developing countries. The system seems to present a hierarchical architecture of highly interconnected countries belonging to influential areas, which in turn connect to other influential areas through hubs. This last property is suggested by the strong clustering coefficient dependence with the degree (power-law behavior with ) and the disassortative degree structure [157]. In another paper, Serrano and Boguñá [157] showed that the topology of the "World Trade Web" exhibited the scale-free, small-world effect and modular structure, similar to the Internet and WWW networks.
Ausloos and Lambiotte [158] studied the correlation between the G7 country Gross Domestic Product (GDP) evolution of the 23 most developed countries. The authors built a network from a correlation matrix and found subgraphs with high cluster coefficient as indicative of globalization effects. Miśkiewicz and Ausloos [159] studied the globalization process and Gligor and Ausloos [160] studied the structure of macroeconomics of the European Union (EU) countries using network concepts, with the correlation matrix of the GDP/capita annual rates of growth between 1990 and 2005 being used to establish the weight of the connections among the 25 countries (nodes) in EU. They introduced the overlapping index, , to find a hierarchy of countries in the network analyzed. In non-weighted networks, this quantity is proportional to the number of neighbors shared by and . The extension of the overlapping index for a weighted network was used to identify clusters and the hierarchy of EU countries.
5.2 Currency
In 2004 Li et al. [161] extended the studies of Serrano and Boguñá to “World Exchange Arrangements Web,” with a method to build a bipartite network where the nodes can represent countries or currencies. In the network, one country is linked to one currency if the currency circulates in the country. The authors showed that the network possesses a scale-free behavior with exponent . A non-bipartite network was also analyzed where the nodes were the currencies only. Two currencies were linked if there was one or more countries where these currencies circulate. This network also presented scale-free behavior with coefficient , small-world effect, disassortative and modular structure. The power law behavior of the degree distribution had also been observed by Gorski et al. [162] in the complex network built from FOREX database (the largest financial market in the world). The robustness of currency complex networks was investigated recently by Naylor et al., who used hierarchical methods to show that the currency network topology minimizes the effects caused by economic crises, such as the Asian crisis from 1 August 1997 to 31 October 1998.
5.3 Industry
Andrade et al. [163] showed that the topology of the oil refineries network is scale-free. In order to build the network, the authors took devices and unitary processes (e.g., valves, pumps, tanks) as nodes, which are linked by pipes. They observed a small-world effect and hierarchical organization on two networks, and argued that the network topology may provide a useful tool to design, characterize and evaluate refinery plants.
5.4 Wealth
The effects of network topology on the evolution of a dynamic process have been widely studied. For example, Souma et al. [164] built a model to investigate the wealth distribution with networks displaying the small-world effect. The authors considered a multiplicative stochastic process and studied the effect of deletion and rewiring of edges in the wealth distribution. Their results indicated two phases for the wealth distribution, depending on two parameters, viz. the probability of rewiring edges and fraction of rewiring edges. The distribution was log-normal for the first phase and power law for the second phase. It had an intermediate state characterized by log-normal distribution with a power law tail, which is also observed in real world economy. The break of the wealth clusters also occurred if the edges were rewired. A similar study was performed by Matteo et al. [165] using an additive stochastic process. The authors showed that the shape of the wealth distribution was defined by the degree distribution of the network used. The results were consistent with real data of income distribution in Australia.
5.5 Tourism
Tourism comprises a multitude of activities that form one of the world’s fastest growing economic industries. The sector is so strongly characterized by intense linkages through which informational exchanges occur, that it seems natural to apply network theoretical methods to its study [166, 167]. Nonetheless only quite recently quantitative techniques have been applied, mainly in analyzing tourism destinations, complex localized clusters of public and private companies and organizations [168]. The major characteristics of tourism destination networks have been measured both from a static and a dynamic point of view. The results showed that topological measurements can highlight their main structural features such as product clusters, structural divides and central organizations [169, 170]. For instance, Scott et al. [170] analyzed the tourism in Australia and showed that complex network theory can help define the weaknesses in destination structures, which can be improved by policy and management approaches. The underlying social and economic system evolutionary history has been also assessed by using network dynamical growth models [171]. In general the topology of the networks is comparable to the one exhibited by similar systems: a marked scale-free structure. However, some differences are found, mainly due to the relatively poor connectivity and cauterization. These results are interpreted by considering the formation mechanisms and the peculiarities of the economic sector and of the real cases examined. Clustering and assortativity coefficients were also proposed as quantitative estimations of the degree of collaboration and cooperation among the destination stakeholders [169]. Moreover, networks were used to perform numerical simulations to investigate possible scenarios of information and knowledge diffusion among the components of a tourism destination. It has been shown that the highest improvement in efficiency for this process is obtained by optimizing the network to increase the degree of local clustering [172].
Tourism networks have also been addressed by analyzing the relation between their structure and dynamics. Costa and Baggio [173] studied the Elba (Italy) tourism destination network using complex networks topological measurements and considered dynamical process over the network, i.e. the inward/outward activations and accessibilities, according to the superedges framework [29]. They showed that the type and size of companies has strong influence over their activations and accessibilities. On the other hand, the geographical position of companies tends not to affect dynamical features. With the characterization of the tourism networks structure, the authors concluded that Elba tourism network is fragmented and heterogeneous.
6 Financial market
A corporation, by definition, has a group of owners, called shareholders, that share its stocks. A stock representing part of the assets and profits of a company can be bought and sold in a stock exchange, and any person can in principle own part of a publicly traded company. Stock prices are constantly changing, following unstable market and political conditions all around the globe. Thus, the financial market is a highly complex, evolving system, difficult to grasp and predict, being sensitive to economical instabilities such as that of Black Monday (October 19, 1987), when the Dow Jones Industrial Average (DJIA) decreased sharply (this index measures the performance of companies in the USA stock market). The organization of the financial market may be well understood by representing it as a network. Given the high accuracy of financial data available, it is possible to build networks that reliably reflect the real market, in contrast to other fields that lack high quality data, such as the Internet and social networks. Financial networks can be constructed, for example, from stock prices or stock ownerships. In the first case, each pair of stocks is connected to each other by a weighted edge that encodes the distance between them. This distance can be computed as a function of the correlation coefficient, taken between the time series of stock prices. From this complete network (i.e. having all possible edges) a hierarchical structure is frequently obtained, which is usually a minimal spanning tree, also called in this context “asset tree”. A minimal spanning tree is a connected subnetwork with no cycles, which includes every node of the original network with minimal cost (i.e. minimal sum of edge weights). On the other hand, a network of stock ownership encodes the stockholders of a group of companies. It can be a directed network indicating who is the owner of a stock and who is the company that shares the stock, where the owner can be an individual or even another company. Examples of the characterization of these two types of networks are discussed in the following paragraphs.
Mantegna [174] studied the stocks traded in the New York Stock Exchange (NYSE) from 1989 to 1995, and obtained a taxonomy that organizes stocks according to economical activity. A network of stocks was computed, where each pair of nodes was connected by a weighted edge that encodes the distance between two stocks. This distance was calculated as a function of the correlation coefficient, taken between two daily time series of stock prices. The hierarchical structure was identified in terms of the minimal spanning tree of the network of stocks. Bonanno et al. [175] employed the same methodology to study stock prices in the NYSE, recorded from 1987 to 1998. The authors compared the topology of the minimal spanning tree resulting from real data with an analogous one obtained from simulated data using market models. A power-law for the real data was observed, with exponent , a feature that was not captured well in simulations, since high and low degrees differ significantly. This means that the hierarchical structure obtained from real data is not captured by stock price models.
Onnela et al. [176] obtained a similar exponent () to the one computed by Bonanno et al., although during crash periods the exponent changes, such as in the Black Monday, where . The authors used daily stock prices recorded from 1980 to 1999 in the NYSE. The asset tree underwent other particular changes in periods of crisis, such as the decreasing in its length. Onnela et al. [177] investigated another network obtained from correlations of stock prices. In this case, the network is not necessarily a tree, being obtained by selecting only the edges with lower weights of the complete network (note that a minimal spanning tree also has edges). This network, generally called “asset graph”, does not clearly exhibit a power-law degree distribution. Moreover, results indicate that the asset graph is more robust and stable than the asset tree, since the former changes less than the latter in consecutive periods and under extreme conditions. However, the asset graph does not necessarily have a hierarchical organization, thus preventing a taxonomic analysis of the financial market. Furthermore, Onnela et al. [178] focused on the details of the construction of the asset graph, and measured how the clustering coefficient changes in this process. The authors were interested in finding what portion of the edges in the asset graph represent information, and not noise. They found a different behavior of the clustering coefficient in the empirical graph, in comparison to a random graph, and this observation was applied to estimate that only 10% of the edges in the asset graph convey real information. The Indian financial market, referred to as National Stock Exchange (NSE), was analyzed by Pan and Sinha [179] using correlations between time series of stock prices (from 1996 to 2006). The network employed connects stocks correlated above a given threshold, while the threshold was chosen to generate the highest number of connected components, which were named clusters by the authors. It was observed that the majority of Indian stocks is not grouped according to business sectors, i.e. correlations inside sectors are in general much weaker than market-wide correlations. Nevertheless, when the whole data of stock prices were divided into two time intervals, it was found that the Indian market is evolving into clusters corresponding to business sectors.
Battiston et al. [180] considered a network of European firms where a directed edge exists if firm is a stockholder of firm , and its weight is the amount of investment from to . Another version of this network was taken by joining firms whose headquarters are in the same region. The firm network shows a power-law distribution of investments, close to the distribution of firm activities, thus showing a correlation between investment and activity. On the other hand, the regional network has a log-normal distribution of activity, investments and degree, though again investment and activity are correlated. Garlaschelli et al. [181] studied shareholders of stocks traded in the NYSE, in the Italian stock market and in NASDAQ (National Association of Securities Dealers). A network description of investors and assets was used, where companies were linked through a directed edge to investors that held some of their shares. Notice that this is not a bipartite network since a company can be a shareholder of another company. The three datasets showed power-law distributions for both node in-degree (called portfolio diversification) and node in-strength (sum of the weights of ingoing links, called portfolio volume). Souma et al. [182] characterized a similar directed network, this time considering only Japanese companies along with shareholding links. Six datasets were used, ranging from 1985 to 2003, and for all of them a scale-free distribution of out-degrees was observed, with varying exponents along the years considered.
Kumar and Sinha [183] investigated the stock price fluctuations in the National Sotck Exchange (NSE) of India. Here, the authors use the network concept to represent the intra-market structure, i.e the interactions within the market. To do that, they used the filtered correlation matrix to build the network, where the nodes are the stock types (Automobile & transport, Financial, Technology, Energy, Basic materials, Consumer goods, Consumer discretionary, Industrial, IT & Telecom, Services, Healthcare & Pharmaceutical and Miscellaneous). Two nodes were linked if the filtered correlation between they exceeded a threshold . The filtering of the correlation matrix removed the common market influence and random noise. As main conclusion, the authors noted that the stocks in emerging markets are more correlated than in developed markets.
Financial markets have a distinctive feature when considering the broad range of fields covered by this review: available financial data is accurate, being collected along several years. This means that researchers in this field can perform highly reliable analysis of the evolution of financial markets, thus helping comprehending its underlying mechanisms and also allowing the creation of new market models. As far as we know, the main approach to create stock networks is the correlation between time series of stock prices. This approach helps identifying the most correlated stocks, although a special care is needed to avoid spurious correlations. Efforts have been made to retrieve interesting structures from correlation matrices, such as the taxonomic organization in the asset tree. Other types of financial networks involving investors and companies have shown power-law degree distributions, a common feature of complex networks. Nevertheless, research on financial markets employing a networked representation is still in its infancy, if we compare with more traditional subjects in complex networks, such as the Internet and biological networks. In the context of networks research, a great challenge for financial studies is to create models of market evolution, thus helping the prediction of important market changes that could affect all the economy of a country or even of many countries.
7 Computer Science
Computer science is a relatively recent area, as the establishment of the first departments and award of the first degrees occurred in the 1960s [184, 185]. While its fundamental topics involve computer architecture, data storage and processing, and system control (programming and algorithm developing) [186], it has become essential for developments in a variety of areas. For computer science provides tools to help solving problems of physics, mathematics, chemistry, biology, medicine, economy, etc. For instance, the major problems in biology, e.g., protein folding, function prediction, phylogeny, and modeling of biological systems (see Section 13) can only be solved with computers and optimized algorithms.
7.1 Software Architecture
The importance of computers and software to our lives is unquestionable. Almost everything we do needs a computer and specific software. The cost of software development increases with its complexity, and may exceed a million dollars (e.g., computer games, compilers, and operating systems). The sub-area of software engineering is aimed at providing methodologies and tools for designing and building software efficiently, which can be achieved by decomposing a problem into many small, distinct but interlocking pieces, named software components [187, 188]. Deciding the size of the software components is difficult and must be planned carefully. Levels of granularity are defined for these components, e.g., subroutines, classes, source files, libraries, packages, etc. There are several ways to represent software as a complex network depending on the size of the software components. The topology of networks and the hierarchical relationships among the software components were studied by Valverde, Solé and Cancho in [187, 189], where the nodes were program classes and the edges were the inheritance and composition among the classes. Networks for various pieces of software were found to exhibit the same organization pattern, including eMule, Openvrml, GTK, VTK and the Linux Kernel. The networks studied displayed scale-free topology and small-world features. Furthermore, software architecture networks can be generated by a local optimization process, instead of preferential attachment or duplication-rewiring. Myers [190] found similar results for six software architecture networks VTK, CVS, abiWord, the Linux Kernel, MySQL and XMMS, where the distribution of incoming and outgoing links is scale-free.
The same applied to the Linux Kernel, Mozilla, XFree86 and the Gimp networks [188], in which the networks were built in a different way. These software packages were written in the C/C++ computer languages, which have two main types of files, “.c” (or “.cpp”) that are the source files and “.h” the headers files. The former contains the source code of the program and the header files contain the definition of variables and constants, and description of data structures. Each source file includes (through the "include" clause) a certain number of header files. The authors considered the header files as nodes of a network, with two nodes being connected if they were included in the same source file. The topology of these networks is scale-free and displays the small-world effect even when the hubs are deleted.
Challet and Lombardoni studied networks of software components [191] for Linux packages and found clear evidence of the asymmetry between the distribution of incoming and outgoing links . While the first presents a scale-free behavior, with exponent , the latter does not. The authors also studied bug propagation in these networks with a similar model to Susceptible, Infected and Resistant of epidemic spreading. In the case of one faulty node with propagation only to the next neighbors, it is easy to fix the problem with a debug process. In contrast, fixing the problem is much harder when non-local fault propagation occurs, as in an illegal memory access. In other papers on software networks, Shannon’s information entropy was used to measure structural complexity [192], and scale-free distribution and small-world effects were found for networks built from Internet- based repositories of open software [193]
7.2 Data Sharing
Iamnitchi et al. [194] considered a scientific file sharing network, where nodes are scientists and two scientists are connected if one of them is interested in the data of the other. Based on the small-world topology of scientific collaboration networks, where edges are created between researchers that are co-authors in a paper, the authors claimed that scientific file sharing networks may be also small-worlds, and thus they proposed a mechanism of data location that takes advantage of the presence of local clusters. Indeed, three data sharing networks (a physics data sharing community, WWW data sharing between Internet hosts and Kazaa traffic between users) have small-world properties [195, 196, 197]. Leibowitz et al. [197] studied Kazaa traffic in 2003, a period where Internet traffic was already dominated by peer-to-peer applications. Data of an Israeli Internet Service Provider (ISP) were employed, which showed that Kazaa traffic is much concentrated in the transport of a few popular files, suggesting that caching can be a solution to decrease redundant traffic. Moreover, some of these popular files lose their popularity in a few days, whereas other files remain constantly popular (at least in the time period considered by the authors).
Peer-to-peer (P2P) overlay networks (i.e. virtual networks at application level that use the Internet infrastructure) were characterized recently. A power-law degree distribution was identified in a snapshot of the connected hosts of Gnutella taken in late 2000, although a more recent snapshot of early 2001 deviates from a pure power-law [198]. The P2P network eDonkey also displayed a power-law for in- and out-degree distributions [199]. In this case, a directed edge exists if a host makes a query related to a file provided by . As a guide for the improvement of Gnutella, it was found that it does not use efficiently the underlying Internet: although 40% of its nodes are inside the top ten ASs, less than 5% of Gnutella’s connections join nodes inside the same AS [198].
7.3 Spam Filtering
A network of email contacts was used by Kong et al. [200] to create a spam filtering technique. It is a distributed collaborative system that relies on queries made between neighboring users (i.e. users that exchange emails) to decide whether a suspicious message is a spam. Thus, the system is based on a “trust” algorithm considering spams already identified by other users. Simulations showed a spam detection rate near 100% with almost no false positives.
7.4 Circuits
The small-world effect was observed by Ferrer i Cancho et al. [201] in networks of electronic circuits, where each node represented an electronic component (e.g., integrated circuits, resistors, capacitors) and edges were wires in a broad sense. The authors showed that the degree distribution of this network follows a power law and the most common degree is , corresponding to four neighbors in 2D plane.
Another example of circuit network was used in 2004 by Barabási et al. [202], with the network formed by a circuit of a microprocessor Simple12. They showed that the intensity of the electric current fluxes on the edges of the network varies strongly, up to four orders of magnitude. Furthermore, the standard deviation and the average value of the flux are related by the power law , a relation that appears in other real transportation networks, with different exponents.
In [203], a study was presented of nano self-assembled devices that showed random topology and small-world effects. These circuits have better performance in the synchronization process, small latency and density of classification task, in comparison to purely local circuits. The authors also discussed the marketing and technological viability of building self-assembled circuits with these features.
7.5 Image Processing and Analysis
Image processing, analysis, characterization and classification are intrinsically related [204]. Some of these steps are particularly difficult to be implemented. For instance, segmentation techniques require identification of objects in images and may involve complex algorithms, to the point that sometimes such an identification may become impossible. Since images are composed by adjacent pixels, complex networks theory can be applied for their processing and analysis. Such networks can be obtained by associating pixels to nodes and connecting them according to some criteria, such as image neighborhood and similarity of the local properties of the pixels (e.g., gray-level values). Costa [205] suggested an image segmentation approach where an image was mapped into a network, and a community identification method was applied to obtain the segmented objects. The rationale behind this approach is the fact that pixels belonging to the same object tend to be densely connected whereas pixels in different objects are sparsely connected, which then leads to a criterion for establishing communities [206].
Complex network theory has also been considered for boundary shape analysis [207]. The shape boundary characterization approach models a shape into a small-world network and use degree and joint degree measurements to extract the shape signature or descriptor which is able to characterize the shape boundary [207]. The methodology proved to be robust, noise tolerant, and invariant to scaling and rotations. Other image processing methods derive from complex networks methodologies and concepts, such as color segmentation, texture analysis [208] and image classification. In the latter case, an image would be represented by a network and the corresponding measurements are extracted. Then, images can be classified according to the network measurements. In addition to images, videos can be addressed in a similar fashion, where each video frame is characterized independently as an image, while interconnections are considered between successive frames.
8 Internet
The origins of the Internet can be traced back to 1969, when the military networking system ARPAnet was created [209]. It has since evolved into a worldwide computer network no longer restricted to academy, through which many services are provided, with email and the World Wide Web (WWW) being the most popular. Thus, since the Internet is such a multi-purpose integrated tool, it is important to understand how it globally works to keep it safe in case of failure or attack, or to improve its performance. A straightforward approach to study the Internet is to represent it as a graph, with hosts, routers and servers being the nodes and the physical links connecting them (optical fibers or copper cables, for example) being the edges.
Complex networks researchers have indeed employed a graph-based approach to model the Internet structure and simulate its traffic. Nevertheless, the complete mapping of the Internet is difficult to achieve, since it is not centrally administrated and changes constantly. Thus, researchers usually employ coarse-grained maps that contain only the links between Autonomous Systems (AS), which are subnetworks separately administrated, or use maps including only the connections at the router level. Nevertheless, such incomplete graphs have allowed important findings about the structure and dynamics of the Internet, as discussed in the following paragraphs.
Faloutsos et al. were possibly the first to study power-laws in the Internet [9]. Three snapshots of the Internet at the AS level, collected between 1997 and 1998, and one instance at the router level, collected in 1995, were examined. Power-laws were found for the degree distribution, the degree rank, the number of pairs of nodes within edges (called “hops”) and the graph eigenvalues. Faloutsos et al. employed AS maps from BGP (Border Gateway Protocol, an inter-domain router protocol) routing tables, an approach criticized by Chen et al. [210], which used instead BGP and IRR (Internet Routing Registry, a routing database). Siganos et al. [211] extended the study of [9] and found that those power-laws hold for more snapshots of the Internet, ranging from 1997 to 2002, as well as for the more complete data of [210]. BGP-based AS maps from a three year interval (1997-1999) were also verified to be scale-free [212, 213], and the same applied to a dataset with the routes traced from only one host to any other address in the network [214].
The correlation profile, i.e. the comparison of the degree correlations of a network with its null (randomized) version, was used by Maslov et al. [215] to identify differences in networks with the same degree distribution, such as the Internet at the AS level (in 2000) and molecular networks. A power-law degree correlation function, which gives the average degree of the neighbors of a node with a given degree , was found in another map of the Internet, which is probably a consequence of a hierarchical structure [212]. Bianconi [216] also used null versions of the Internet to gain more insights about its structure. The author considered approximations of randomized network ensembles that preserve the degree distribution, the degree correlation and the community structure of five AS maps (among other real-world networks). The entropy of an ensemble, which is proportional to the logarithm of its number of networks, was used to indicate how important to the Internet is a given feature, like its degree distribution or community structure. For the Internet maps employed, the lowest entropies were found in ensembles that preserved degree distributions. Therefore, the feature that carries more information about Internet, in the context of this analysis, is the degree distribution.
Furthermore, Bianconi [217] assessed the number of cycles of length 3, 4 and 5 in 13 snapshots of the Internet at the AS level, collected between 1997 and 2001, and found a scaling behavior of these quantities over time. Moreover, cycles of size 5, called pentagons, are more frequent in these AS maps than in random networks with the same degree distribution. Therefore, pentagons could be regarded as characteristic motifs of the Internet. The rich-club phenomenon was also identified in an AS network, which means that nodes with high degree are well connected with each other [218]. This property has been addressed not only considering the degree, but across hierarchical degrees [219]. Such a tendency to have a strong core in the Internet was reported in [220, 221], where the nucleus of the Internet, i.e. its innermost -core (a -core is the largest subgraph whose nodes have at least degree ), is a well connected cluster with approximately 100 nodes and diameter of 2. The authors used an extended data set, combining BGP-based AS data with the one obtained in the DIMES project [222], and divided the network into three parts: (i) the aforementioned nucleus, (ii) a fractal connected component that is not in the nucleus but encompasses the largest part of the Internet and (iii) dendrite-like components, which are connected only to the nucleus. The decomposition of the Internet was done with the -shell decomposition method. The -shell is a set of nodes that contains all the nodes with degree larger or equal to , which are recursively removed from the network, where decomposition is made by creating -shells starting with until . The modularity of the Internet was also investigated using spectral analysis of AS level networks. Eriksen et al. [223] found modules that approximately match single countries, and Rosato et al. [224] observed that the Internet has large and highly clustered regions joined by a few links.
One common analysis of the Internet involves the study of its vulnerability to failure or attacks. The vulnerability of complex networks, including the Internet at AS level, was analyzed in [11] with regard to random node removal (node failure) or hub removal (network under attack). In this case, the diameter and size of connected clusters were monitored while nodes were removed. Results showed that the scale-free networks (BA model, Internet and WWW) are extremely efficient against random failures, differently from the ER model. However, the hub-based attack rapidly breaks scale-free networks into small isolated groups. In [55] attacks were performed in complex networks (including the Internet at the AS level) removing nodes with high degree or high betweenness centrality, both calculated only at the beginning of the attack (i.e. in the original network) or at each step of attack. Similar strategies were employed for edge removal. At each node or edge removal, the average inverse geodesic length and the size of the largest connected subgraph were monitored. It was shown that attacks using the recalculated betweenness are the most harmful to the Internet considering edge-based attacks. For node-based attacks, the different strategies are equally harmful to the Internet. The average inverse geodesic length was also used in another study [225], where it was called “efficiency”. The drop in efficiency when a node is removed was calculated for every node of Internet backbone maps of USA and Europe. The authors identified the nodes with the highest efficiency reduction, which could explain the problems Internet users faced on September 11, 2001. Another interesting observation made by the authors is that these important nodes do not necessarily have high degrees.
A scaling behavior of the form between the mean flux per node and the flux dispersion per node in the Internet router topology was reported by Menezes and Barabási [226], where the flux is the transmission rate of data packets. To explain the observed scaling law the authors used diffusion of random walkers and transfer of packets along shortest paths. The results pointed to a scaling exponent of the Internet () reflecting an endogenous behavior. That is to say, Internet is rather more affected by internal decisions, like the origin and destination of a packet, than by external agents such as the variation of the number of Internet active hosts. In [227] a method was presented to separate internal from external dynamics. The processing capacity of nodes was also considered by Duch and Arenas [228] to study Internet traffic, using data similar to the one employed in [226]. The authors assumed a queue model with Poisson packet arrival and exponential processing time per node. Varying the parameter of this model and the time window for measuring data, they showed that can vary significantly for the Internet.
Centers of activity were identified in the French-side of the Internet, in a scientific network called Renater [229]. In this case, the exchange of data between all routers was considered, even if they were not physically connected, and the Random Matrix Theory (RMT) was applied in a matrix of correlations between edge flows (measured in bytes per 5 minutes) to identify the most correlated connections. The Internet has a high heterogeneity of connection quality between hosts separated by the same distance [230]. This result was measured using the Round-Trip-Time (RTT) and the geographical distance between pairs of hosts over the Internet. As for the network growth, it was discovered that in 2002 the overall Internet performance, measured in RTT per unit distance, was improved in comparison with the year 2000 [230]. In addition, new links were preferably placed among old nodes than between new nodes in the Internet, which indicates that redundancy plays an important role on its growth [212].
Rosato et al. [224] performed simulations of traffic flow in an Internet map, and noticed that congestion is reached for lower traffics in the Internet than in a random network. The authors argued that the hubs can be responsible for this behavior, since these nodes participate in a large number of transmissions between other nodes. Using a model of self-regulated packet generation with different levels of routing depth, Valverde and Solé [231] simulated Internet’s traffic and detected a critical path horizon that separates a low-efficiency from a highly-efficiency traffic. This transition happens when the size of the routing tables approaches the network diameter. Furthermore, the authors hypothesized that the Internet is working close to this critical path horizon. Nevertheless, Kim and Motter [232, 233] found that there is a large amount of capacity available (more than 94%) in a router-level Internet map, mainly a consequence of large fluctuations in traffic. They employed the router map of the ABILENE backbone, MIT and Princeton University networks, as well as the corresponding average traffic measured in June 2006.
When delivering data packets, routers in the Internet choose neighboring routers to obtain an estimation of the shortest path between origin and destination. However, this procedure does not take into account the load present in each router, which can lead to unexpected processing delays in routers or even congestion in extreme cases. Echenique et al. [234] showed in simulations with an AS map of 2001 that if the queue load of routers is taken into account, along with the cost of paths, the routing protocol of the Internet can be improved. Moreover, the authors noticed that an increased clustering coefficient can also lead to improved efficiency as congested nodes can be avoided when alternative routers in the neighborhood are available. In a related research, Krioukov et al. [235] studied the scaling properties of Internet routing. A good scaling happens when the size of routing tables grows slowly (e.g. logarithmically). However, the routing in the Internet is far from ideal, since for optimal routing it is necessary to maintain a global view of the evolving network in each router. In this case, good scaling of table sizes is, in principle, impossible. Although the Internet needs substantial routing modifications, simple solutions may arise, as Boguñá et al. [236] analytically proved: using only local information nodes can work efficiently, especially in networks with power-law degree distribution and high clustering coefficient, such as the Internet. Tadić et al. [56] also argue that it is not possible to substantially improve the efficiency of Internet traffic by considering global information. More specifically, the authors stated that neighborhoods at a maximum distance of two are sufficient. Local information was also highlighted by Thadakamalla et al. [237] as important parameters for transport strategies in geographical scale-free networks such as the Internet.
An accurate network model should contain the same characteristics of its real counterpart. Each Internet model usually reflects a few of these features, which leads to a variety of complementary models [238]. Yook et al. [239], for example, introduced a model based on empirical observations of the router and AS levels of the Internet. Their model includes incremental growth, where the probability of connecting a new node to an older node is linearly proportional to the degree and to the inverse of the distance between them. Moreover, positions of nodes form a scale-invariant fractal set, positively correlated with the population density. Park and Newman [240] analytically studied ensembles of networks with the restriction proposed in [215], i.e. that the maximum number of edges between a pair of nodes is one. This mechanism leads to the negative degree correlation (disassortative mixing) reported by Pastor-Satorras et al. [212], which inversely associates the average degree of the neighbors of a node with its degree . Nevertheless, Park and Newman argue that this approach is not responsible for all the degree correlations verified in the Internet.
Rosato and Tiriticco simulated the growth of the Internet at AS level [241] using a mechanism of triad formation introduced in [242]. This mechanism uses preferential attachment to create the first edge that connects a new node to an existing node . Moreover, node is sequentially connected to the neighbors of its first assigned neighbor , thus building a “triangle”, or to any other node following preferential attachment. This model leads to a scale-free network with adjustable clustering coefficient. The authors found that simulations of this model fits Internet data from 1998 to 2000, for quantities such as diameter, clustering coefficient, degree distribution and average geodesic length.
Zhou and Mondragón modeled the Internet at the AS level using an interactive growth mechanism and nonlinear preferential attachment [243, 244]. Their approach, called positive-feedback preference (PFP) model, is also based on data features such as the initially slow growth of node degree and the establishment of links between old nodes. Simulations of this model showed that it can reproduce many characteristics of the Internet, including the degree distribution, the rich-club phenomenon and the disassortative mixing.
Serrano et al. [245] considered in their model the number of users (hosts) in each AS and the capability of adaptation of ASs according to their size. The authors assumed exponential growth for the number of users, the number of ASs (the nodes) and the number of links between ASs (the edges of the network), all inspired by empirical observations of Internet data [35]. Another important feature of this model is that ASs can have connections strengthened by increasing their edge weights. Furthermore, the model can optionally include a distance constraint to avoid connections between distant ASs. The parameters used for the model led to a power-law degree distribution with exponent , which is in agreement with previous works [9, 212]. The model explains the average shortest path length, the clustering coefficient and the -core decomposition of the Internet.
Internet models have also been compared by considering multivariate statistical methods, as proposed by Rodrigues et al. [238]. The authors suggested the consideration of canonical variable analysis and Bayesian decision theory to determine which model is most suitable to reproduce the Internet structure. Such an approach allows one to consider a large set of measurements to obtain an accurate description of the network structure. Rodrigues et al. analyzed Internet models at the autonomous systems level and concluded that none of the models considered were able to reproduce accurately the Internet structure. The proposed approach is aimed at determining which model is more suitable to any type of complex network.
The Internet was one of the first and most studied subjects in the field of complex networks, for which various topological and dynamical features have been already observed. These include a power-law degree distribution, the rich club phenomenon, disassortative mixing, large unused bandwidth and far from optimal routing. Many models were proposed for the Internet, which at most reproduce some of its experimentally observed features. Despite the incompleteness of Internet maps, the results from analysis made with different data compiled at distinct time periods and using various methodologies for collection are consistent. Recurrent features in these analysis are the power-law degree distribution and the existence of a nucleus set of nodes. Nonetheless, a more accurate methodology for data collection is still necessary. Researchers and professionals interested in improving Internet’s performance and security may benefit a lot from these relatively recent discoveries made in the complex networks field. Although new insights about Internet’s structure and dynamics frequently appear, its distributed, centrally uncontrolled nature, and its constant evolution, still pose challenges for a complete understanding of its main governing rules.
9 World Wide Web
The World Wide Web (WWW, or just Web) is perhaps where Internet users spend most of their time, despite the existence of other highly popular Internet applications such as electronic mail. The WWW relies on the HyperText Transfer Protocol (HTTP), which allows a Web browser running on a client computer to communicate with Web servers distributed over the Internet. Web servers usually contain hundreds (sometimes many more) files that can be accessed by anyone with a Web browser connected to the Internet. These can be virtually any computer file, such as those containing text, image or video; the files, however, that give the WWW a networked structure are the pages, which may contain pointers (hyperlinks) to other pages available in the WWW. Thus, one can think of the WWW as a giant network of pages interconnected by hyperlinks. These files are the most important of the WWW because they are multimedia files that group rich text (i.e. with formatting options), images, videos and even computer programs (e.g. scripts and applets).
The WWW viewed as a network is an interesting subject for complex networks researchers and for those whose main concern is the Web itself [246]. It is huge, with billions of pages, despite its relatively recent birth (released in 1993 to public access), and it has an almost uncontrolled growth mechanism, where individuals or organizations create their interconnected pages depending solely on their will. Grasping the WWW organization and how users jump from page to page while navigating/surfing the Web is crucial to optimize search engines and facilitate access to information. Mainly because of its uncontrolled nature, the WWW is difficult to map completely, even for sophisticated search engines [247]. Usually a WWW map is constructed by a computer program called “crawler” that navigates through pages storing their hyperlinks, i.e. identifying source and target pages. Unfortunately, many pages are not considered by the crawler for reasons such as authorization requirements to obtain a page, dynamic pages that require filling a form, crawler limitations, broken links or unreachable Web servers. Usually, Web maps are viewed as directed networks, where each edge points from one node to another, i.e. the page that contains the hyperlink points to the referenced page. Sometimes the Web is not considered at the page level, but at the site level, where each site (roughly a group of pages under the same domain address) is considered as a node, and pairs of sites are connected whenever a hyperlink is found between some of its pages.
In a number of papers the WWW was reported as a scale-free network [10, 87, 248, 249, 250]. With a network of 325,729 pages taken from the nd.edu domain, Albert, Jeong and Barabási [10, 87, 248] verified that its out- and in-degree distributions follow a power-law of the form , with exponents and , respectively. Broder et al. [249] and Donato et al. [250] used a considerably bigger Web map, with 200 million pages, and obtained . Pennock et al. [251] divided the distribution of pages by category, such as the set of company websites or the set of newspaper websites. Although the in-degree distributions of these subnetworks displayed the heavy tail characteristic or power-laws, the frequency of nodes with low degree significantly deviates from a pure power-law. Other power-laws were found in the WWW for the distribution of the sizes of connected components [249] and for the distribution of the number of pages in a website [252]. Moreover, self-similarity at different scales was verified in the WWW using the nd.edu map [253]. In this case, the network was divided into boxes of nodes of size , where every pair of nodes in a box was separated by a distance . It was found that the number of boxes required to group the network and the size of the box also follow a power-law. Furthermore, the values given by PageRank, which is a webpage ranking method based on a random surfer model used by the Google search engine [254], follow a power-law distribution with exponent [250]. PageRank is not statistically correlated with the in-degree, which means that webpages with high in-degree (i.e. referenced by many other pages) do not necessarily appear at the top of a Google search. The small-world effect in the WWW was observed by Adamic [255] at the site level using approximately 250,000 sites. Hence, this WWW map presents high average clustering coefficient and low average distances between nodes. Bianconi et al. [256] developed a theory to assess if a directed network has more or less loops than a random network. Using the nd.edu map, the authors observed that the WWW has more short loops than its randomized version (including loops of length 3, which is considered in the computation of the clustering coefficient), thus pointing to the small-world effect. The authors also found that other directed networks, including food webs and the C. elegans’ neural network, have less short loops than their randomized counterparts, which means that the small-world effect vanishes when these networks have their directionality preserved. In another experiment, random versions of observed data that preserve the original degree distribution were used to estimate the average geodesic length of the entire WWW [10, 248]. The size of the WWW was thought at that time (late 1990s) to be , which gave , a relatively small value. The authors predicted a logarithmic growth of , indicating that the average distance between nodes in the Web grows slowly with . However, Broder et al. [249] verified that is very different in their Web map of 200 million pages, with . Moreover, they found that a path between randomly chosen pairs of nodes exists in only 24% of the times, thus confirming the absence of a small-world effect in their data. Even in the biggest strong connected component (a central group of pages) they obtained .
Before Bianconi et al. [256] studied cycles in the Web, Caldarelli et al. [257] performed a similar investigation in some WWW maps. The latter authors introduced the grid coefficient, a measurement that quantifies the level of cycles of length in a network. The authors also characterized cycles of length 4 (referred to as quadrilaterals) in some networks, including the WWW map of the nd.edu domain. This Web map has far more quadrilaterals than its randomized counterpart, which indicates that some order of regularity, represented by grid-like structures, is present (a similar behavior was found in the Yeast protein interaction network and in a scientific collaboration network). Moreover, the authors noticed that the grid coefficients follow a power-law distribution in these networks and in an AS map of the Internet. This observation leads to the claim that the WWW and the other networks have a hierarchical arrangement of cycles. Broder et al. [249] reported an intricate organization of a WWW map collected in 1999, which was divided into four groups of roughly similar size: (i) the largest strong connected component (SCC), where every page can be reached starting from any other page; (ii) the IN group, which contains pages that can lead to SCC (even indirectly), but cannot be reached from SCC; (iii) the OUT group, with pages that do not lead to SCC, but can be reached from SCC; and (iv) the TENDRILS, with pages separated from SCC that can only reach IN and OUT. Donato et al. [250] investigated the size of these components in a WWW map collected in 2001, and obtained different values to those reported by Broder et al. Other modular structures in the WWW were reported in the literature, regarding groups of pages about similar topic. In [258] communities of related topics were found based on the maximum-flow/min-cut theorem and in [259] groups of connected pages with high curvature (a geometrical interpretation of the clustering coefficient) were associated with specific topics.
Social networks based on the Web can be analyzed using networks of personal pages, such as the blogs where hyperlinks are frequently created between pages of friends or acquaintances. Some connectivity properties between 200,000 pages of a Chinese blogspace revealed a scale-free degree distribution and the small-world effect [260]. Indeed, Milo et al. [261] showed that the WWW and social networks are included in the same super family, based on the significance profile of motifs (this profile is defined in Section 17.2). This observation may be useful to help understanding the WWW using models of social organization.
Another network related to the Web, though not built using pages as nodes, was characterized by Shen and Wu [262]. This network, called folksonomy, uses semantic tags created to describe the content of a database of hyperlinks (bookmarks). A folksonomy represents the connectivity between tags, where two tags are linked if they are associated with the same content. The employed data of 9,804 tagged bookmarks also exhibit scale-free and small-world properties.
The dynamics in the WWW is usually associated with user surfing, i.e. the sequence of pages a user (or a group of them) visits when following hyperlinks in the WWW. Dezsö et al. [263], for example, divided the pages of a news portal into stable pages, i.e. the overall fixed structure of the portal, and news pages, which are pages frequently created. The rate of visits to stable pages is constant, while news pages receives a large number of visits after a few hours and decays as a power-law. Moreover, unlike Poisson processes, a power-law distribution also describes consecutive visits to the site performed by a single user. Huberman et al. [264] compared real user activity data with a model of user surfing that gives the probability distribution of the number of visits to a Web page. The model, which reproduced well real data, considers that there is a cost associated with a surfing activity, and that the user continues surfing while this cost remains below a threshold. Another surfer model, the aforementioned PageRank, is used by Google to sort its search results [254]. PageRank simulates the behavior of a user randomly surfing the Web, where the user goes from page to page following hyperlinks and sometimes performs random jumps with probability to any other page in the Web. The frequency of visits of the random surfer per page is the PageRank score. Menezes and Barabási [226] recorded the visits to a group of sites during 30 days, and the mean flux per node and the flux dispersion per node were estimated. Similarly to what happens with the Internet (see Section 8), a scaling behavior of the form was found in the WWW, with exponent . Results indicate that the fluctuations in the WWW are dominated by external driving forces, such as the variation in the number of surfers, rather than by internal choices made by surfers.
Kleinberg et al. [265] and Kumar et al. [266] modeled WWW growth applying intuitive ideas of user behavior, where a user tends to create links to pages related to some topic of interest. While the network grows, some pages appear about a topic and users interested in this topic start creating links to those pages. This makes it easier for other users to find those pages, thus also establishing other links to them. Ultimately, it allows the formation of groups of pages about similar topics. The model performs this procedure by using four stochastic processes, one for node creation and one for edge creation, along with two other processes for node/edge removal. Kumar et al. [267] created a model for generating an evolving WWW, where new nodes are continuously added, connecting to previous nodes with either uniform probability or with preference to older nodes. The latter case simulates a behavior where newly created nodes are likely to be unknown by most of page creators. Moreover, some nodes reproduce the neighborhood of a randomly picked node. All these models agreed with observed degree and bipartite core distributions.
Bornholdt and Ebel [268] employed the Simon model, created in 1955, to explain Zipf’s law. This model accurately predicts the in-degree exponent found in the WWW [87, 249], which is . The authors defined the following procedure, where a class contains the nodes with the same degree and is the number of nodes in the class : (i) with probability create a node and connect it to any other node, or (ii) with probability connect any node to a node of class with probability . Tadić [269] suggested two general rules to generate the WWW: (i) growth, where at each time a new node is added to the network, and (ii) rearrangements, where at each time a number of outlinks are created from to an old node and a number of links between old nodes are created or removed. This model agreed with empirical data regarding distributions of in- and out-degree and the distribution of the size of connected components. Pennock et al. [251] changed the BA model of preferential attachment by including a uniform attachment probability. Thus, the probability of connecting a new node to an old node is a combination of the usual preferential attachment with a uniform attachment rule. This model encompasses the rich-get-richer mechanism, along with the creation of hyperlinks that are more influenced by personal interests of the page owner than by the popularity of a page. Moreover, the model is especially able to capture degree distributions of specific subgraphs in the Web, such as the set of company websites. Menczer [270] expanded this model and included a parameter of lexical similarity between webpages, where the probability of connecting two nodes includes a power-law that depends on the lexical distance. Thus, this approach considers the content of the documents and their connectivity. Besides approximating the degree distribution of a snapshot of the Web with 100,000 documents, this model can also estimate the content similarity distribution of connected webpages.
In conclusion, as many real world complex networks, the WWW exhibits the scale-free property concerning in- and out-degree distributions. Interestingly, in-degree hubs are uncorrelated with the well known random surfer model named PageRank, meaning that highly cited pages are not necessarily highly visited. The presence of the small-world effect in the WWW is controversial, with results showing a fragmented Web lacking paths between the majority of node pairs. Modularity seems to play an important role in the Web, with the presence of general groups like SCC or specific communities related to some topic. Moreover, several models for WWW evolution have already been proposed, all of them reproducing some experimentally observed features. One of the main challenges of Web researchers is to learn to obtain a more complete, accurate set of WWW data, a problem faced by researchers of many other fields. Moreover, since more complete data means even bigger Web maps, some computational complexity issues may arise when carrying out experiments. Efficient search for information is now an important concern, thus a better understanding of the structure and dynamics of WWW is fundamental. Merging page interconnectivity and meta data (i.e. information about page content) is a promising approach because specific parts of the Web can be analyzed separately, hence allowing more detailed insights about WWW that could help the design of search engines and crawlers, and also guide webmasters to better place their pages in the cyberspace.
10 Citations
Although dynamically described by diffusion processes, information transfer can also be quantified from static structures such as citation networks. Any information contained in a paper or technical report contributes to the global knowledge of the reader. However, only the most relevant manuscripts tend to be remembered when one has limited time and space. Therefore, an information filtering process is already performed at this stage. By using data from citation databases, one can investigate the information flow through specific groups of people. The citation networks so far constructed derive from technical reports (especially scientific papers) represented as nodes and citations between those reports as directed edges. Those networks are constantly growing. As the in-degree represents the citations from other reports, this measurement carries information about the importance of the report, i.e. the number of times that report was found to be relevant to other works. However, once published, the report cannot aggregate new references and the out-degree is fixed over time. Because of this intrinsic network property, the out-degree distribution of scientific papers from the ISI database in the period from to is characterized by a maximum value with strong fluctuations at the left-hand side of the distribution. Most importantly, there is a universal behavior at the two rightmost classes, corresponding to journals of limited and unlimited number of pages per paper [271]. In contrast, patent-to-patent citations present a power-law with exponent [272]. Van Raan found a power law with exponent in the number of references per publication in [273]. This interesting unidirectional growth mechanism has curious properties: though the average number of citations increased over time [274, 271], the average number of citations for papers published in a given year has decreased slowly with time [274]. This suggests that the relevance of a paper might decrease over time. Analysing data from arXiv and PRL, Hajra et al. concluded that most papers are cited within a period of years after publication. It also indicates that trendy research topics are popular during this same period and afterwards, become less important [275]. Redner constructed two networks, one considering only the citation of papers published in and available at the ISI database, and another network covering Physical Review D papers published and cited in a period of nearly years [274]. By means of a Zipf plot (cumulative distribution), he found a power-law citation distribution with for large . Other power-law distributions with exponent were verified in the SPIRES database by Bilke and Peterson [276], now with exponent for papers published and cited in [273]. Such distributions, together with other evidence, led Redner to suggest that minimally and highly-cited papers obey different statistics where most part of papers are forgotten a short time after publication. In fact, nearly of the papers in the ISI database were not cited and were cited only 10 times or less. Conversely, about were cited over times [274]. On the other hand, Tsallis and Albuquerque [277] suggested that the entire distribution found by Redner might emerge from the same phenomenon since it could be well fitted by a single function derived from the non-extensive formalism. Power-law citation distributions were also found on an extensive US patents database granted between January and December . Chen and Hicks [272] showed that the patent-to-patent citation distribution had exponent , and when the data were restricted to a specific field related to both basic and applied research. Interestingly, while analyzing only citations of papers in US patents, they concluded that papers with explicit funding acknowledgements tended to be cited relatively more often () than papers without explicit acknowledgements (), possibly because those articles in the former category are more likely to have impact on inventions described by patents. Using a random walk procedure, Bilke and Albuquerque [276] found that the spectral dimension of the ISI citation network is about , having a tree-like structure with the small-world property.
The level of similarity between two reports can be inferred not only by keywords, but also by the number of common references. Since the references are supposed to be directly related to the subject of the report, similar reports should cite similar previous works. This property is obtained by the neighborhood of a specific node, but it could also be obtained from a network such as that of van Raan who used databases from several citation indexes in . He considered that two publications were connected if they had at least one reference in common [273]. Although the network was unweighted, the same data could now be used to quantify the level of similarity between two reports. The degree (named bibliographically coupled publication cluster size) distribution is also described by a power-law function and an exponential cut-off for values larger than . Analogously to other works, a memory effect was identified in the age of the references, the distribution function changed from a power-law to an exponential if the network was built only with older references. He suggested that reports with low degrees are related to very specific themes which are typically recent, and therefore cite recent articles. In contrast, old references are generally more general and connect more parent publications, giving rise to a more uniform distribution.
The self-citation issue was addressed by Hellsten et al. [278, 279] adopting the optimal percolation method [115, 116]. They proposed a methodology over the self-citation evolution patterns of a specific author and compared this pattern to the co-authors and keywords in the articles. The method was used to detect emerging research fields and to trace mobility of scientists through different fields and critical moments in the academic career. For one author, changing co-authorship drives the changing research interests and move to new research topics [278] while for another author, this inter-field movement is an effect of maintenance of the same collaborators [279].
The databases reviewed in this section are considerably large and reliable in terms of an interaction rule between their components. However, some inaccuracies are present since little standardization is adopted and individual entries are made by different people at different times. Redner suggested that inaccuracies as incorrect page numbering for citations, citations of specific pages and input errors in transferring citation data supplied by authors, have minor effects in the citation distribution [274].
11 Transportation
Transportation networks are important for the development of a country and may be seen as indicator of economic growth. The tourism industry and transport of goods and people are particularly dependent on transportation networks, which include airports, railways, highways, subways, and other forms of public transport. Studying this kind of network can help one to understand the movement of people around the world and predict how diseases can spread, in addition to design optimal networks for the flow of people. Ultimately, it may give insights on how to improve the economy of a country.
11.1 Airports
In airport networks, cities with airports are considered vertices, and flights between them are the arcs. This type of network is naturally directed and weighted because of the direction and number of passengers in flights. The arc weights are given by the number of passengers of flights or number of flights itself in a day or in a week. Guimerà et al. [17], however, argued that the connections for the network of all airports in the world are almost symmetrical, with minor asymmetries arising from a small number of flights following a “circular” path. Therefore, there is no need to consider the arc directions.
He et al. [280] studied the Chinese airport network in 2002 without considering either the directions or the number of passengers in a flight. They concluded that this network is small-world without the scale-free property, as the vertex degree distribution is exponential. They explained the topology of the network with a model based on the population and gross domestic product of the cities. Li and Cai [281] also analyzed the Chinese airport network using a connectivity matrix of size , where is the number of airports for the 7 days of the week. Besides the scale-free and small-world properties, they also observed for the Chinese airport network that (i) the daily and weekly cumulative vertex degree distribution of undirected and directed Chinese airport networks obey two regime power-laws with different exponents (the so-called Pareto law [282]); (ii) the cumulative distribution of flight weights has power-law tails; (iii) the diameter of a subcluster, consisting of an airport and all of its neighbors, is inversely proportional to its density of connectivity; and (iv) the transportation efficiency of the subclusters of the airport network increases with the density of connectivity.
The worldwide airport network [17, 283] is a scale-free, small-world network. Nevertheless, the most connected cities are not necessarily the most central, in contrast to other scale-free networks. This is a consequence of the community structure of this network [17], on which a global role of cities was developed. This measurement indicated that the vertices connecting different communities are hubs in their own community. Guimerà et al. [17] pointed out that the community structure cannot be fully explained only by geographical constraints, but geopolitical considerations have to be taken into account. A model to account for these findings was developed by Guimerà and Amaral [283], which explains why the most connected cities are not the most central. In the model, not all cities of a country can establish connection with cities of another country.
Bagler [284] studied the airport network of India considering edge weights, and found that this network is hierarchical with the small-world property, and characterized by a truncated power-law degree distribution. The network has disassortative mixing, in contrast to the worldwide network of airports. This difference can be related to the local and global scales of airport networks.
An analysis of the evolution of the Brazilian airport network [285] showed that its structure changed within a 12-year period. The number of airports and routes decreased while the betweeness centrality increased over time. The overall behavior suggests that companies focus on concentrating the operation in the most profitable routes, increasing the number of flights and removing the less profitable ones in a dynamic way such that airports gain and lose importance through the years. One of the consequences is the possible increase in the vulnerability of the network for both random failures and targeted attacks [285].
In addition to analyzing the networks, it is important to design optimal networks for this kind of transport. Kim and Motter [286, 287] analyzed networks with Regard to the resource allocation, i.e. the seat-occupation in the flights, and showed that airport networks have a very efficient capacity distribution, which is a consequence of the high cost of air transportation. A new route network to optimize the operational cost for the French airports network, based on graph coloring for the air traffic flow management, was proposed in [288].
Problems associated with airport networks are related to difficulties in the air traffic flows, e.g., caused by heavy fogs or snowstorms. In order to assess the performance of the network under such circumstances, Chi and Cai [54] analyzed the errors caused by an attack to the structure of the US airport network. Analogously to other scale-free networks, the US airport network is tolerant to errors and random attacks, but extreme vulnerable to a target attack to hubs. While topological properties, including average vertex degree, clustering coefficient, diameter, and efficiency are almost unaffected by the removal of a few airports with few connections, the same properties are drastically altered if a few hubs are removed.
11.2 Roads and urban streets
These networks deserve special attention in our daily life since they directly influence our travel times and transport costs. Over the last years, we have witnessed an increasing number of vehicles on the roads which resulted in slower traffics and more frequent jams. Although possible in the past, building new roads or streets is not feasible today because of spatial constraints imposed by the local buildings. The best solution is, therefore, to make better planning for the traffic or even to manage it in real-time so that time wasted on the roads is minimized.
In the context of complex network theory, many questions related to the representation of the metric distances of the roads arise. These include what kind of graph representation to use, which topological features to study, as well as the correlations between structural measurements and the dynamics of the traffic flows. The representation of road networks can be: primal or dual graph (e.g. [290, 291]). In the former case, while intersections are nodes, the roads are edges. This is a natural way of representing these networks since it captures the most important feature of geographical dimensions, i.e. the distance, and it was used in [292, 18]. A more detailed study of networks of this kind can be found in [292], where the authors analyze twenty samples of street patterns of several world cities.
There is a limitation, however, with the primal representation, since it does not express the difficulty to walk on them [293], which can be obtained by the dual representation, where roads are nodes and intersections are edges. Such a representation was defined in the seminal work of Hillier and Hanson [294], known as “axial mapping”. Although it does not give the geographical distance between two arbitrary points in the network, it expresses the information (i.e. the number of road changes) needed to travel between those points. Therefore, the smaller the number of road changes to reach a specific destination, the easier to find it.
Rosvall et al. [293] expressed the difficulty of navigation on these networks in terms of the “search information” [295]. The higher this measurement, the more difficult it is to find a destination. With this approach, the authors showed that new cities, as e.g., Manhattan, are better planned than old cities, as e.g., Stockholm, since the search information for the former is less than for the second city. Another conclusion of [293] is that it is preferable to replace a big number of streets with a few long, provided it reduces the number of road changes necessary to connect any two points of the network. The accessibility of places in towns and cities was also investigated with self-avoiding random walk dynamics [296], and Travençolo and Costa showed that the dynamics of transportation through towns and cities is strongly affected by the topology of the connections and routes.
Following the second definition for road networks, Kalapala et al. [291] found that this kind of network, besides the small-world property [290], has topological and geographic scale invariance. In other words, for sufficiently large geographical areas, the degree distribution is scale-free, with journeys having identical structures, regardless of their length. Indeed, the driver starts on small roads, moves to progressively larger, faster roads, until the fastest is reached, where he/she covers most of the trip before descending back to progressively smaller roads. The authors also proposed a simple fractal model to reproduce the above features. Other models (geographical scale-free networks) can be found in the review [289].
In [18], Gastner and Newman compared geographical networks such as an airline network, the US interstate highway network, and the Internet at the autonomous system level. They showed that networks, which are fundamentally two-dimensional such as the highways in the primal graph representation, have a close relation between their geographical and topological features, as e.g., the geographical and geodesic distance. A model to reproduce their findings was also proposed.
The dynamics on road networks has been studied for years, with many models proposed [297, 298, 299, 300, 301], ranging from macroscopic models based on the kinetic gas theory or fluid dynamics to microscopic approaches with equations for each car in the network. In [302], the authors analyzed the German highway network using cellular automata as a model for the traffic flow, and showed that the simulations are faster than real time making this model suitable for traffic forecasting. It was also possible to find the bottlenecks of the highway network.
11.3 Other transportation networks
There are many other transportation networks, but their properties are quite similar to the airport and road networks mentioned above. Therefore, we shall not discuss networks such as the railways [303, 304, 305], subway networks [306], and public transportation [307, 308, 309].
The analysis of transportation networks is important because it provides manners to investigate the economy of countries and can be used to improve their infrastructure. The majority of this kind of network are small, generally with less than 1,000 vertices, has the small-world phenomena with the scale-free degree distribution, and has hierarchies. The air transportation network is also modular. Because to this property, the most important vertices in the airport networks are the hubs inside each community, and not the global ones. In the case of the road networks, there are two ways to be represented, depending on how to represent roads and intersections. If roads are considered edges and the intersections are the vertices, the representation is known as primal graph. Otherwise, it is referred to as dual graph. In the first case, there is a close relation between the topological and the geographic features, while in the other case the representation is more related to the difficulty of traveling inside the network. If the primal graph representation is used, the corresponding networks does not have the small-world property and scale-free degree distribution.
The main results obtained for the airport networks were that they are very efficient in terms of resource allocation, due to the expensive cost of air transport, and tolerant to random attacks, while vulnerable to targeted ones, analogously to many scale-free networks. In the case of road networks, the best planned cities are those with low search information, i.e. it is not difficult to travel inside them.
The majority of the models developed for transportation networks are based on geographical and economic constraints, with the main aim of reaching optimal, robust networks. The development of better models is crucial for achieving such endeavors.
12 Electric power transmission systems
The electric power transmission system is one of the most complex human-made networks. It comprises transmission lines and several substations, that include generators – the electricity power source; transmission substations, which connect high-voltage transmission lines; and load centers, which delivery the electricity to consumers (e.g. [310]). Colloquially known as power grid, the electric power transmission system has a complex structure including redundant paths to route power from any generator to any load center. The main reason for this redundancy is to guarantee that every load center can be supplied by any generator. In other words, if one generator fails, the load centers will receive the necessary power from the other generators. In the same way, if one transmission substation fails, the others have to be able to handle the additional load and keep the whole network working. Nonetheless, even with the redundancy of lines, some cascading failures and blackouts happen and several load centers stop receiving power. One of the most serious was the Northeast Blackout that affected 50 million people in the U.S.A and Canada on August 14th, 2003, and resulted in a huge loss of money (at about 30 billion US dollars) [311]. Obviously, this kind of network is crucial for the economy of a country and deserves special attention in engineering and science.
The first studies in the power transmission systems relied on creating simple dynamical models which simulate each component of the network to understand the blackout dynamics of the whole system [312, 313, 314, 315, 316]. The networks were simple structures such as rings, trees or mathematical grids, and the blackouts were considered instantaneous events caused by cascading failures of the transmission lines. When one transmission line failed, all the power flow was redistributed to the other lines, but new failures may happen due to overflow, leading to a cascading effect. These dynamical processes were simulated in [312, 313, 314, 315, 316], from which it was inferred that the size of the blackouts follows a power-law tail, which means that big blackouts are not so uncommon.
Although useful for predicting blackouts and finding the critical components of the power transmission network, the approach above was limited to simple network topologies which do not correspond to those of the real power transmission networks. In fact, these networks have the small-world property, high clustering coefficient (e.g. [311]), degree distribution in an exponential form [310, 88], and the “bow-tie” configuration [317]. For a power network of 314,123 nodes, Chassin et al. [317] considered any vertex regardless of voltage (note that the size of the power networks used in the other studies did not take into account nodes of small voltages, see Table 2 for more power network data), and showed that the network has a radial form. The generators are in the center, with transmission substations in the middle and the load centers at the border, in the so-called “bow-tie” configuration [249]. The degree distribution was power law with a cutoff term.
| Network | Size | Reference |
|---|---|---|
| Western US power network | 4,941 | [33] |
| US power network | 14,099 | [310] |
| Complete US power network | 314,123 | [317] |
| Italian power network | 341 | [318] |
| Chinese power network | 8,092 | [319] |
In the analysis of the topology of these networks, it was shown that the removal of highly connected nodes (without distinguishing their types) can lead to blackouts of certain regions of the networks [320, 321, 322]. Each substation was assumed to have a transmission capacity that depends on the number of shortest paths passing through it. Albert et al. [310], however, showed that only the removal of highly connected transmission substations can provoke blackouts, since the other transmission substations can fail because of the additional overload. This is not the case of generator failures, because even the removal of the highly connected generator is unable to cause blackouts [310]. This is a consequence of the redundancy of these networks where all generators can be routed to all load centers. When one generator fails, the others provide the additional power to supply the whole network.
A more realistic and complex model was developed by Anghel et al. [323]. It describes an electric transmission network under random perturbations (e.g. line or substation failures and overloads) and the operator’s response to the contingency events (a system to repair the damaged lines or substations). In this model, each random event was stochastic and could be triggered at any time. The model was able not only to predict blackouts but also to find the optimal strategy for minimizing the impact of random component failures.
Overall, the power transmission systems represent very large networks, with hundreds of thousand vertices, and exhibit the small-world property, with high clustering coefficient and the degree distribution in an exponential form and bow-tie configuration. Blackouts are caused by removal of highly connected transmission substations as the other substations cannot take the additional overload. The first models developed for transmission power systems had simple topologies, aimed at simulating blackouts. Now, a more realistic model exists which includes more sophisticated topologies and is based on stochastic events.
13 Biomolecular Networks
In June 2000, the Human Genome Project and Celera Genomics decoded the human genome, providing the so-called “book of life”, after which the genetic code of many organisms has been discovered. The Genome project is only a starting point [324], as the post-genomic era should be concerned with modeling biological interactions instead of analyzing the genetic code by itself. As the behavior of living systems can seldom be reduced to their molecular components, in the post-genomic area of system biology [325] one has to assemble the parts unfolded by genome projects. For instance, Vogelstein, Lane and Levine [326] concluded that more significant results can be obtained by analyzing connections of the p53 gene (a tumor suppressor) than by studying this gene separately.
Processes in living organisms are basically divided and linked in three levels of complexity [327]: (i) metabolic and signaling pathways, which are determined by (ii) the network of interacting proteins, whose production is controlled by (iii) the genetic Regulatory network. Understanding life processes therefore requires one to: (a) analyze how energy is obtained from cell biochemical reactions by interactions among metabolites, products and enzymes; (b) understand how proteins take part in various processes, as in the formation of protein complexes; (c) understand how information is transmitted from a transcription factor to the gene that regulates this transcription [2].
Modeling these biological systems may be performed by considering complex network theory, because of its universality and ability to mimic systems of many interacting parts [328]. Biological networks comprise metabolites, enzymes, proteins, or genes as vertices, which are linked depending on their interaction. Using complex network theory, fundamental properties of biological networks have been discovered, including power law connectivity distributions, small-world properties and community structures [1]. Furthermore, the crucial concepts to understand biological systems, namely emergence, robustness and modularity, are also ingredients of complex networks theory [328, 325].
In the following, we shall discuss major developments in applying complex network theory to biological systems.
13.1 Protein-protein Interaction Networks
In modeling protein interactions, one considers a network comprising proteins (nodes) connected by physical interaction (undirected edges). This requires reliable databases, which have become available since the 1980s because of high throughput methods, and a set of measurements to characterize the network structure and dynamics. The connections are generally not weighted, but some databases provide indexes of reliability associated with each link as the confidence score [329].
The study of protein interactions using complex networks theory may be divided into four basic areas: (i) characterization of the network structure; (ii) prediction of protein functions; (iii) modeling of the interactome and (iv) modeling and characterization of protein-domain interactions.
The structure of protein interaction networks has been studied to determine the relative importance of vertices and their organization in modular structures or subgraphs. Some of these structures are conserved along the evolution of many organisms, which allows one to infer their importance for cellular maintenance. The structure of protein interactions was believed to be completely random. However, in 2001 Jeong et al. [12] discovered that these networks were far from uniform, upon analyzing the S. cerevisae protein interaction networks. In fact, a few proteins are able to physically attach to a huge number of other proteins, but most proteins play a very specific role, interacting with just one or two other proteins. The distribution of connections of Yeast follows a power-law with an exponential cutoff whose exponent is about [12]. Other systems, such as the simple bacterium H. pylori [330] and the insect D. melanogaster [331], also present a power-law dependence for the connectivity in the protein-protein interaction. Therefore, it seems that the scale-free nature of protein interaction networks is a general feature of all organisms.
The protein interaction networks have also been shown to be small-world, with a small average shortest path length, and to present many loops of order three [332]. Their structure is formed by modules of highly connected proteins [113, 333, 334]. The hubs possibly play a critical function in the network maintenance, being strongly related to lethality. They are believed to be the oldest proteins in the network. Jeong et al. [12] showed a correlation between lethality and connectivity. While among the proteins with five or fewer links, 93% are non-lethal, among the proteins with more than 15 links, 62% are lethal. The highly uneven structure of protein interaction networks imparts robustness against random failures [12]. When random failures occur in scale-free networks, there is only a small probability that the removed node is a hub, and the network structure is not affected severely [11]. In contrast, when highly connected proteins are removed, the network breaks up in several disconnected components, which reinforces the relation between lethality and connectivity. This explains why scale-free networks are very abundant in nature, being associated with the evolution of cellular processes and genes [334]. In spite of the fact that the loss of hub proteins can lead to death of the organism, some network-based strategies to restore cellular functions caused by specific mutations have been developed [335].
The importance of hubs was also addressed by Maslov and Sneppen [336] who showed that the functional modules inside the cell are organized around individual hubs. In addition, the proteins are uncorrelated according to their connectivity which indicates that the neighborhood of highly connected proteins tends to be sparser than the neighborhood of less connected proteins [336]. Schnell and Fortunato [337] investigated the relation between structural features of hubs and their number of connections. They concluded that the disorder of a protein (or of its neighbors) is independent of its number of protein-protein interactions. The presence of hubs and the local cohesiveness of networks are also related, as suggested by Ravasz et al. [332]. The latter authors showed that the relations between the scale-free architecture and the high degree of clustering in protein networks are consequences of a hierarchical organization, suggesting that small groups of nodes organize in a hierarchical manner to make large groups.
The functional importance of proteins can also be addressed in terms of network entropy [338] and betweenness centrality [339]. Joy et al. [339] observed that proteins with high betweenness, but low connectivity, are abundant in the Yeast interaction network, with a positive correlation between the fraction of lethal proteins and their betweenness centrality.
Some structural properties of protein interaction networks seem to be conserved during evolution. Wuchty et al. [340] observed that some types of subgraphs referred to as network motifs may be preserved during natural evolution. These motifs were found more frequently in real networks than in their random versions, generated by the rewiring method that maintains the network degree distribution [40]. Wuchty et al. analyzed the conservation of proteins of Yeast with an ortologus in five eukaryote species, namely Arabidopsis thalianam, Caenorhabditis elegans, Drosophila melanogaster, Mus musculus and Homo sapiens. They observed that some motifs are conserved from simple organisms to more complex ones [340]. Each of the motifs conserved was suggested to perform specific roles, e.g. in forming protein complexes, where smaller parts are represented by fully connected -node motifs. Because some biological functions emerge from modules of many connected proteins [341, 327], instead of single proteins, such structures are conserved throughout the natural selection. In fact, as the cell is organized in modules, the structures should be conserved along evolution, and not only the individual cellular components [341, 342]. The conservation of network motifs can be used to predict protein interactions. Using machine learning algorithms, Albert and Albert [343] showed that conserved properties of protein networks can be used to identify and validate protein interactions.
The Baker’s Yeast (Saccharomyces cerevisiae) has about 6,300 genes, which encode about the same number of proteins [344]. Therefore, the determination of interaction among such proteins requires checking about 6,300 times 6,300 pairs, which is close to forty million potential interactions. In 1989, Stanley Fields proposed a revolutionary technique to detect protein-protein interactions using the GAL4 transcriptional activator of Yeast Saccharomyces cerevisiae [345]. This “Yeast two-hybrid”(Y2H) method [346, 347] is based on the fact that a protein with DNA-binding domain may activate transcription when it simply binds to another protein containing an activation domain. Basically, Y2H detects interaction using two hybrid proteins referred to as the “bait” and the “prey”. The “bait” contains a query protein X fused to a DNA binding domain and the “prey” is a fusion of a second protein Y to a transcriptional activation domain. If the proteins X and Y interact, then their DNA-binding domain and activation domain will combine to form a functional transcriptional activator, which will proceed to transcribe the reporter gene that is paired with its promoter [348, 349]. Further information about this method and its extensions may be found in [349] and [350].
Y2H allowed the global analysis of protein-protein interactions and the birth of interactome (one of the next steps after the genome) [351, 352]. The success of this method lies on the identification of interactions without antibodies or the need to purify proteins [345]. However, the main drawback is that Y2H generates many false positives, i.e. interactions identified in the experiment but that never take place in the cell [353, 354]. This limitation has motivated the development of other methods, including biochemical techniques such as affinity [329] and molecular size-based chromatography, affinity blotting, immuno-precipitation and cross-linking [355, 356, 351, 357]. Also, computational methods are applied to identify protein-protein interactions [358], such as those based on the genome sequence [359]. Sprinzak et al. proposed a method to asses the quality of protein interaction databases using the cellular localization and cellular-role properties to provide an estimative of true positives in databases [360]. They suggested that the reliability of the high-throughput Y2H is about 50% and that the Yeast interactome should be composed of – interactions. Recently, Krogan et al. [329] made available a database of protein interactions based on tandem affinity purification which identified proteins and interactions of the Saccharomyces cerevisiae. This database offers greater coverage and accuracy than the previous high throughput studies related to Yeast protein-protein interaction. In Table 3 the main protein-protein interaction databases and their web addresses are presented.
| Database | URL |
|---|---|
| DIP | http://dip.doe-mbi.ucla.edu |
| IntAct | http://www.ebi.ac.uk/intact |
| HPID | http://wilab.inha.ac.kr/hpid |
| MIPS | http://mips.gsf.de/services/ppi |
| Biogrid | http://www.thebiogrid.org |
| BIND | http://bind.ca |
| CYGD | http://mips.gsf.de/proj/yeast/CYGD/interaction |
| iHOP | http://www.ihop-net.org/UniPub/iHOP |
| JCB | http://www.imb-jena.de/jcb/ppi |
| MINT | http://mint.bio.uniroma2.it/mint |
| PathCalling | http://curatools.curagen.com/pathcalling_portal |
| String | http://string.embl.de |
| InterDom | http://interdom.lit.org.sg |
Assigning functions to unknown proteins is one of the most important problems in the post-genomic era. This may be performed by genome analysis methods that exploit domain fusion [359] and phylogenic profiles [361]. In the first method one observes that pairs of interacting proteins have homologs in higher species fused in a single protein chain. The second, on the other hand, considers that proteins participating in structural processes or metabolic pathways are functionally linked, evolving in a correlated fashion. Other methods are based on interaction partners, because proteins with the same functions tend to share connections [362]. This property arises from the duplication and mutation mechanisms of protein evolution. When a protein is duplicated, the daughter protein has the same features as the mother protein. However, as the daughters suffer mutations, they tend to differ in structure, but preserve similar functions and connections. Another common approach for predicting protein function is the majority rule assignment, which takes into account the empirical finding that 70–80% of protein interaction partners share at least one function [363]. Hishigaki et al. [362] proposed a methodology based on analysis of -neighborhood proteins, i.e. for a given protein , the -neighborhood is composed by proteins distant edges from . With this methodology, one can predict with 72.2% accuracy the subcellular localization, with 63.6% accuracy the cellular role and with 52.7% accuracy the biochemical function of Yeast proteins. However, such methods do not consider the links between unknown proteins. Vazquez et al. [364] extended this method by minimizing the number of physical interactions among different functional categories and considering the connections between unknown proteins, thus achieving a more precise identification of protein function.
Despite the many approaches to determine protein function using the complex network of interactions, there are many limitations owing to the large number of false positives and negatives in the interactions. Thus, some connections between proteins may not occur in vivo and the function associated with such interactions may not be real. Another problem is related to multi-functional proteins. In this case, it may be hard to determine the function of the proteins when their neighbors have many functions.
Simple protein interaction models have been proposed using network measurements [365]. Eisenberg and Levanon [366] proposed that the BA model is relevant for protein interaction modeling. They applied a cross-genome comparison and observed a correlation between proteins age and their connectivity. Then, they suggested that the protein evolution is governed by the preferential attachment rule. Pržulj et al. [367], on the other hand, suggested that the protein evolution is governed by a geometrical model and the scale-free degree distribution may be caused by the high percentage of false negatives. The geometric model is obtained by distributing proteins randomly in a metric space and connecting two proteins according to the distance between them. These results were later confirmed by Costa et al. [24].
Even though these models reproduce some protein interaction properties, other biological processes must be considered in modeling. The modeling may be performed with addition and elimination of interactions between proteins, and gene duplication increasing the number of proteins and interactions [368]. Vázquez et al. [369] proposed a model in which each node in the network represents a protein that is expressed by a gene, and the network evolves following two steps: (i) duplication: a randomly selected node is duplicated as which is connected to according to a probability and has all connections of , (ii) divergence: a node connected to and loses the connection or according to a probability . Therefore, this mode has two parameters and , representing the creation of a connection by node duplication and the loss of interactions, respectively. Solé et al. proposed a similar model with the same concepts [370], which is given in detail in [371]. Solé and Fernández showed that the models by Vázquez et al. [369] and Solé et al. [370] reproduce the modular structure and the degree correlation observed in protein interaction networks [372]. In case of degree correlations, hubs tend to connect with poorly connected proteins. Also, the modular scale-free structure in protein networks emerge naturally from the duplication-divergence rule [372] or optimization principles [373].
The rate of duplication and deleting of interactions was estimated by Wagner [368] who concluded that every 300 million of years, around half of all existing protein interactions are replaced by new interactions. Wagner [374] also estimated the rate of link dynamics and gene duplication using empirical data, showing that the rate of link dynamics is at least one order of magnitude higher than gene duplication. With this observation, Berg et al. [375] proposed a model of protein interaction with link attachment and link detachment together with gene duplication. In this case, the link dynamics is guided by a preferential attachment rule supported by empirical data. Such a model reproduces the scale-free degree distribution and the correlation between interaction proteins, as observed experimentally [375].
As domains can recombine to form multi-domain proteins, the domain recombination may be the main mechanism to modify protein function and increase the proteome complexity [376]. Protein interactions can be validated by domain-domain interactions [377] and proteins with similar activities are likely to contain similar domains [378]. Therefore, the characterization of domain-domain interactions has many applications and is crucial to understand the evolution of protein interactions.
Domain-domain interaction networks are built from (i) protein complexes, (ii) Rosetta Stone sequences, and by using (iii) protein interaction networks [379, 380, 377]. With the first methodology, domain information is inferred from the intermolecular relationships in protein complexes. The second considers domain fusion in different organisms, i.e. domains that appear separately in one organism and together in another one are potentially interacting. Finally, the last approach considers the protein interaction to determine domain interaction. In this case, all domains belonging to two interacting proteins are also interacting. Ng et al. [377] suggested a measure to determine the potential of interaction between domains considering the protein interaction network.
Wuchty [379] studied domain interaction networks with methodologies (i) and (ii). In both cases, he showed that protein domain interactions follow a power law and exhibit the small-world property with a high average clustering coefficient. In a subsequent paper, Wuchty [380] also investigated which factors force domains to accumulate links to other domains. As the network of domain interactions consists of hubs responsible for network integrity, it is natural to investigate the importance of the most connected domains. Costa et al. [13] analyzed the structure of domain interactions and the relation between protein connectivity and essentiality. In this case, the essentiality of a domain is hypothesized in two ways: (i) domain lethality in a weak sense: a domain is lethal if it appears in a lethal protein and (ii) domain lethality in a strong sense: a domain is lethal if it only appears in a single-domain lethal protein. Costa et al. showed that correlations between domains degree and lethality in both the weak and strong senses are significantly higher than the correlation obtained for proteins, which shows the importance of domains in defining protein interaction and protein lethality [13].
Complex networks theory has also been used to analyze protein 3D structures resulting from linear chains of amino acids, which is a classical example of biological self-organization. Bagler and Sinha [381] studied the role of topological parameters in the kinetics of protein folding in two length scales – Protein Contact Networks (PCNs) and their corresponding Long-range Interaction Networks (LINs), which are constructed by ignoring the short-range interactions. They found that both PCNs and LINs exhibit assortative mixing, which have been absent in most biological networks, as discussed before. Besides, while the assortativity coefficient provides a positive correlation with the rate of protein folding at both short- and long-contact scale, the clustering coefficients of the LINs exhibit a negative correlation.
13.2 Metabolic Networks
Metabolism is the complete set of chemical reactions that occur in living cells, allowing cells to grow and reproduce, maintain their structures, and respond to their environments. The essential energy and substrates for the function of a cell are obtained by breaking large molecules into small ones. Hence, this process is the basis of life. Metabolic networks are related to the chemical reactions organized into metabolic pathways, in which one chemical compound is transformed into another by the action of a sequence of enzymes. Basically, the reaction networks can have three possible representations: (i) directed and weighted graphs, whose vertices can be of three types: metabolites, reactions and enzymes, while there are two types of edges representing mass flow (from reactants to reactions) and catalytic reactions (from enzymes to reactions), (ii) connecting all reactants that participate in a same reaction, (iii) connecting two reactions if they share a reactant. Major catalogues available on-line are the Kyoto Encyclopedia of Genes and Genomes (KEGG, http://www.genome.jp/kegg) and the EcoCyc (http://ecocyc.org/).
Jeong et al. [382] investigated metabolic networks of 43 organisms from all three domains of life, and found that metabolic organization is not random, but follows the power law degree distribution —the probability that a given substrate participates in reactions follows a power law, , with in all 43 organisms. Besides, metabolic networks are small-world (), where two metabolites can be connected by a small path. For instance, Fell and Wagner [383] showed that the center of E. coli metabolism map is glutamate and pyruvate, with a mean path length to other metabolites of 2.46 and 2.59, respectively. An important property discovered by Jeong et al. is that the diameter of metabolic networks is almost the same for all the 43 organisms. This property is quite different from that for other types of network, where the diameters increase logarithmically with the addition of new vertices. A possible explanation is that as complexity of organisms grows, individual substrates get more connections to maintain a relative constant network diameter. Since metabolic networks are scale-free, few hubs concentrate a high number of connections [383]. Such networks are thus tolerant to random failures, but vulnerable to attacks in which there is a sequential removal of nodes starting with the most connected one. This procedure increases the network diameter and quickly breaks the network into disconnected components. This expectation has been confirmed experimentally in Escherichia coli, where mutagenesis studies performed in-silico and in-vivo showed that the metabolic network is highly tolerant upon removal of a considerable number of enzymes [384]. Another feature of hubs is their preservation along evolution. Only 4% of all substrates encountered in the 43 organisms are present in all species, which can be considered generic as they are utilized by many species [382]. Such substrates are the hubs in metabolic networks.
The structures of a metabolic network are organized in a modular, hierarchical fashion [385]. The modules are discrete entities composed by several metabolic substrates densely connected by biochemical reactions. Ravasz et al. [386] showed that the average clustering coefficient of the metabolic networks of 43 organisms is independent of network size, being higher than for scale-free networks generated by the Barabási-Albert model of the same size. In addition, the clustering coefficient follows a scaling law with the number of links, , which indicates a hierarchical organization. Hence, metabolic networks are characterized by a scale-free degree distribution, average clustering coefficient independent of network size, and hierarchical, modular organization. Ravasz et al. suggested a model of metabolic organization that reproduces these properties. It is built starting with a small cluster of four densely connected nodes, followed by generation of three copies of this structure with the three external vertices being connected to the central vertices of the old clusters. This process is repeated until a network with the same size as the real network is obtained. The networks thus generated display the properties of metabolic networks discussed above.
Guimerà and Amaral [14] proposed a methodology to find functional modules in complex networks and classify vertices according to their patterns in intra- and inter-module connections. They found that 80% of substrates are only connected to substrates within their modules. Also, substrates with different roles are affected by different evolutionary constraints and pressures. In contrast to the result by Jeong et al. [382], Guimerà and Amaral showed that metabolites participating in a few reactions but connecting different modules are more conserved during evolution than the most connected substrates (hubs).
13.3 Genetic Networks
Living cells are governed by gene expression programs involving regulated transcription of thousands of genes. Cell signaling and differentiation can be investigated by pattern of gene expression, which can be represented by complex networks [387]. Transcription is controlled at many levels and the gene regulation network fits into a network of networks that represent not only interactions among transcription factors but also the factors that modulate these interactions biochemically [388]. High-throughput methods and computational approaches have allowed important discoveries in genetic networks. In order to analyze the topology and dynamics of genetic networks, approaches were developed to evaluate identification and expression level of interacting genes, how interactions change with time and the phenotypic impact when key genes are disrupted. The techniques aimed at elucidating transcriptional regulatory networks are mainly based on genome-wide expression profiling and the combination of chromatin immunoprecipitation (ChIP), which was discussed in [389, 390].
Transcriptional regulatory networks control gene expression in cells and are composed of regulators and targets (nodes) and regulatory interactions (edges). Edges are directed from a gene that encodes a transcription factor protein (TF) to a gene transcriptionally regulated by that transcriptional factor, referred to as target gene (TG) [43]. Such complex systems can be analyzed as a multilayered system divided into four basic levels [391]: (i) the first level encompasses the collection of transcriptional factors, its target genes with DNA recognition site and regulatory interaction between them; (ii) the second level involves regulatory motifs, which are patterns of interconnections that appear more frequently in real networks than in randomized networks [40]; (iii) the third level considers the modular organization, where modules are group of nodes that regulate distinct cellular processes; and (iv) the last level consists of the regulatory network composed by the whole set of modules.
Because network motifs appear at frequencies much higher than in random networks, they are expected to have special functions in information processing performed by the network [392]. The complexity of networks can be reduced by considering their motifs. Figure 1 presents the three main types of motifs found in regulatory networks in the Yeast of Saccharomyces cerevisiae and the bacteria Escherichia coli. In transcriptional regulatory networks, the feed-forward motifs are defined by a transcription factor that regulates a second one such that both, jointly, regulate a final target gene. On the other hand, the simple input module and the multiple input regulate their targets by a simple or multiple transcriptions factors, respectively. All these targets are controlled by the same sign (all positive or all negative) and have no additional transcriptional regulation [43]. Other important motifs are found in the transcriptional regulatory networks of Saccharomyces cerevisiae, for which a detailed discussion is presented in [393].
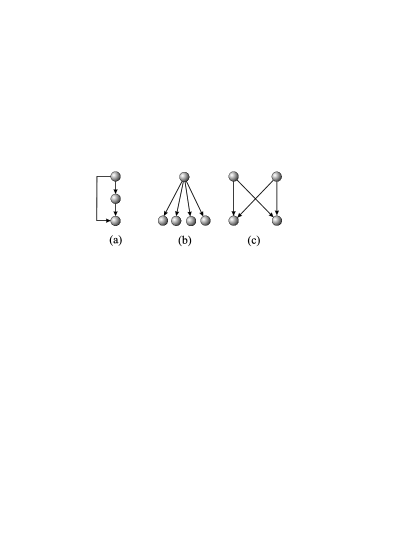
Modules are organized by interconnections of network motifs. In general, the modules refer to a group of physically or functionally linked genes. Distinct cellular processes are regulated by discrete, separable modules [394]. Ma et al. [395] identified 39 modules in transcriptional regulatory networks of E. coli, which showed well-defined functions. Also, Dobrin et al. [396] showed that in E. coli multiple input and feed-forward loops motifs do not exist in isolation, but share transcription factors or target genes. A review about the modular topology in transcriptional regulatory networks is presented in [391].
The structure of transcriptional regulatory networks exhibits two main properties: (i) the fraction of genes with a given incoming connectivity decreases exponentially, and (ii) the outgoing connectivity distribution follows a power law [394]. The exponential character of the incoming connectivity indicates that most target genes are regulated by a similar number of factors. On the other hand, the scale-free distribution of the outgoing connections points to a few transcription factors participating in regulation of a large number of target genes. In addition, such genes tend to be lethal if removed [397]. The structure of transcriptional regulatory networks changes with time or environmental conditions, because not all nodes are active at a given time. Dynamical processes can be analyzed in genetic networks, as in Li et al. [398] who observed that the cell-cycle of the regulatory network in Yeast was extremely stable and robust. Klemn and Bornholdt [399] investigated the reliability of gene regulatory networks and found a distinction between reliable and unreliable dynamical attractors, showing that biological signaling networks are shaped by selective advantage of the ability of robust signaling processing. Other dynamical processes investigated in genetic networks are discussed in [400].
The evolution of transcriptional regulatory networks occurs via three processes: (i) duplication of the transcription factor, which results in both copies regulating the same gene, (ii) duplication of the target gene with its regulatory region, where the target gene will be regulated by the same transcription factor, and (iii) duplication of both the factor and the target [391]. Such a mechanism of duplication and inheritance determines a large fraction of the interactions in regulatory networks. Furthermore, a large number of interactions are gained or lost after gene duplication. This process can result in network motifs and specific connectivity distribution in the network. Teichman and Babu showed that the evolution of regulatory networks is mainly defined by gene duplication [401] and that 45% of regulatory interactions in E. coli and S. cerevisiae arose from duplication with inheritance of interactions. Balcan et al. [392] proposed an information theoretical approach for modeling transcriptional regulatory networks based on statistics of the occurrence of binding sequences of given specificity in random promoter regions and a “sequence-matching” rule. They showed that the degree distributions, clustering coefficient, degree correlations, rich-club coefficient and the k-core structure obtained from the model agree with the measurements in the real network of S. cerevisiae.
Though the structure of biological networks has been extensively studied, the understanding of temporal activity of a cell is still embryonic. Databases with time evolution of gene expression activity are being developed [402, 403]. When data on cell network processing and intercommunication become available, new insights about the mechanisms of life will be possible.
14 Medicine
Complex networks have been useful in medicine, as networks representing biomolecular systems can be applied to understand disease principles and spreading [404]. Barabási [405] suggested the treatment of diseases by taking into account different levels of complex biological networks. The basic level considers a complex network connecting cellular components (e.g. metabolic, protein-protein interaction and genetic networks), the intermediate level represents the networks of diseases (two diseases are connected if they have a common genetic or functional origin), and the top level represents the society, composed by human interactions, such as friendship, geographical localization, and so on. In case of obesity, the analysis should consider biomolecular networks, because some genes or metabolic disfunctions may be of fundamental importance. At the network disease level, obesity is related to other diseases, such as diabetes, asthma and insulin resistance. Finally, at the top level, the social interactions contribute to spreading of eating habits and lack of physical activities.
In addition to disease origin, complex networks can be useful in epidemiology. Indeed, the spreading of infections caused by virus or bacteria has been studied by dynamical analysis in networks. Studies on spreading virus are discussed in Section 24.
Complex networks theory is potentially suitable to be applied in anatomy. For instance, the bone structure in mammals are composed by a complex network of channels (Havers and Volkmann channels), which are required to nourish the bone marrow cells. The vertices represent intersection of two or more channels and these interconnecting channels are expressed as edges [406]. Costa et al. [407] characterized a network from a cortical bone structure in terms of complex networks measurements. Three important findings were reported: (i) that the channel branching density resembles a power law implies the existence of distribution hubs; (ii) the conditional node degree density indicates a clear tendency of connection between nodes with degrees 2 and 4; and (iii) the application of the hierarchical clustering coefficient allows identification of typical scales of channel redistribution. The biological implications of such findings were also discussed.
15 Ecology
The characterization, modeling and simulation of ecological systems are major challenges of natural sciences today. In ecological communities, each species interacts in different ways, forming networks of interacting species. Important ecological relations are competition, parasitism, mutualism and predatory-prey relationships. Food webs are composed by trophic species connected directly by trophic links [408]. The links are represented by arrows from to if species is eaten by species . Such rows indicate the flow of resources. Trophic species is a collective designation for all species having a common set of predator and prey. Thus, species such as sponges and clams may belong to the same trophic species. The use of terms such as “detritus” and “dead organic material” indicates how hard it is to decide on what can be included or omitted in the food web chain. Before the 1990s, food webs were very small, with sizes varying from 5 to 48 [409]. The analysis of such networks suggested that the ratio was independent of and therefore this relation was scale-invariant. However, further works showed that this belief is not correct [410]. Food webs are small-world networks, obeying the two degree of separation rule [411]. This property implies that the loss of biodiversity and species invasions may affect ecosystems strongly. Garlaschelli et al. showed that differently from biomolecular networks, food webs are not scale-free and do not present high average clustering coefficient [412, 413]. The modeling of food webs can be divided into three basic levels: static models, dynamical models, and species assembly and evolutionary models, which are discussed in the review by Drossel and McKane [408]. Ecological relationships were also explored by considering dynamical processes, such as metapopulation dynamics [414, 415] and epidemic spreading [416]. In addition, food webs have been studied in terms of robustness [417] using concepts of scaling and universality. This particular dynamics is important to quantify species extinction in face of habitat modification and global warming [418]. Using the May-Wigner stability criterion [419],Sinha and Sinha [420] showed that increasing complexity in terms of size and connectivity results in great instability, leading to extinction of more species. Therefore, previously unconnected ecosystems that start to interact by anthropogenic or natural means are highly vulnerable to large losses in species.
In addition to predatory-prey relationships, species can interact according to mutualism — plants and animals establish beneficial interactions, where both individuals derive a fitness benefit [421]. A classical example of mutualism involves unicellular algae and corals, where the coral provides the algae with shelter and inorganic nutrients, while the pigmented algae provide photosynthesis. Mutualism is fundamental in ecology and evolutionary biology, driving the evolution of much of the biological diversity [422]. The structure of networks representing mutualistic relationship are different from those obtained for antagonistic interactions (predator-prey, herbivore-plant). While antagonistic networks are highly compartmentalized [423], mutualistic networks are often nested, characterized by species with many interactions forming a kernel, and species with few interactions, which interact just with the highly connected species. This kind of structure was observed in mutualistic relationship between animals and plants (e.g. flower and bees) [424] and cleaner and client species (cleaning networks) [425], as the cleaning networks are more asymmetric than plant-animal networks [425]. The nested structure of mutualistic networks is related to phylogenetic relationships [422]. Indeed, phylogenetic related species tend to have similar biological roles in mutualistic networks [422].
16 Neuroscience
Complex networks theory is a useful framework for the study of large scale brain networks. The network models, topological measurements, and the dynamical analysis (e.g. avalanches [57, 426]) can be considered for brain studies. Representing brain connections with networks is useful to study brain diseases, which are related to network attacks and failures, and brain functions, where it is possible to associated a particular brain architecture with specific brain functions.
Brain networks can be investigated at many scales, ranging from individual neurons to large brain areas [427, 428]. In the former case, neurons are connected by synapses. In the latter, regions are linked by pathways or functions. Brain networks are generally directed and unweighted, though the description of neuronal systems may be enhanced by incorporating weighted networks.
An important question in neuroscience regards the relationship between brain function and the structure of neural connectivity. The brain is composed of a complex interconnection system whose organization is aimed at optimizing resource allocation and minimizing constraints [429]. A limitation of studies in brain connectivity is the proper choice and integration of the spatial and temporal resolutions, because a given dataset may reflect individual neuron activities, neural assemblies dynamics and other macroscopic brain activities [430, 431]. The main types of connectivity are: (i) anatomical connectivity, related to the connections between two brain sites; (ii) functional connectivity, which is defined as the temporal correlation between spatially distant neurophysiological events; and (iii) effective connectivity, which is a more abstract approach defined as the influence that a neural system may have over another in a direct or indirect way.
Anatomical connectivity data can be obtained at different scales, from neurons to brain regions. This analysis can be considered static when the time of analysis varies from seconds to minutes, but can be dynamic for large time scales, such as hours and days, because of learning or development activities. At a more microscopic spatial scale, the connectivity of the brain is related to the geometry and spatial position of the individual neuronal cells (e.g. [432, 433, 428]). For instance, networks involving more intricate neurons are likely to imply enhanced connectivity, therefore affecting the corresponding dynamics (e.g. [26]). An interesting open question is to predict connectivity and dynamics of neuronal networks from the geometric features of specific types of neurons [26, 428], for the form of neurons is highly correlated to their functions [26]. One of the first studies using graph theory to represent brain connections was performed by Felleman and Van Essen [434] in 1991. They mapped the hierarchical organization of the cerebral cortex of primates, reporting 305 connections among 32 visual and visual-association areas. Watts and Strogatz in 1998 analyzed neuroanatomical networks for the nervous systems of C. elegans [33]. This network, formed by neurons and synaptic connections, revealed a small-world characteristic structure, but not a scale-free distribution of links. The topology of such network is suitably represented by the Watts-Strogatz small-world model. Similar results were obtained by Hilgetag [435], who studied compilations of corticocortical connections data from macaque – the whole cortex, the visual and the somatosensory – and cat. Other studies suggested that the large scale organizations of the brain cortex of rat [436], cat [437] and monkey [434] are neither regularly nor randomly connected. Most cortical networks have a multi-cluster structure, presenting the small-world property (e.g. in C. elegans and , in macaque visual cortex and , in macaque cortex and , and in cat cortex and ). Therefore, the neuronal and cortical connectivity obtained are small-world networks. This particular topology might be chosen by selection pressure to minimize wiring costs. The small-world structure allows the network to have a modular organization and connections between such modules by adding several long-distance connections [438, 439]. Costa and Sporns [440] characterized cortical networks with hierarchical measurements and identified principles for structural organization of networks. In addition, Costa et al. [441] proposed a computational reconstruction approach to the problem of network organization in cortical networks and showed that the organization of cortical networks is not entirely determined by spatial constraints. Cortical areas have also been analyzed dynamically. Costa and Sporns [442] applied Metropolis dynamics on four configurations of the cat thalamocortical systems, i.e. (i) only cortical regions and connections; (ii) the entire thalamocortical system; (iii) cortical regions and connections with the thalamic connections rewired so as to maintain the statistics of node degree and node degree correlations; and (iv) cortical regions and connections with attenuated weights of the connections between cortical and thalamic nodes. They identified substructures determined by correlations between the activity of adjacent regions when only cortical regions and connections were taken into account. In addition, two large groups of nearly homogenous opposite activation were observed in cases (ii) and (iii). The effects from uniform random walks on the dynamic interactions between cortical areas in the cat brain thalamocortical connections were investigated, from which such connections were found to be organized to guarantee strong correlation between the out-degree and occupancy rate [443].
The small-world topology has a direct influence in the dynamical complexity of the network. As discussed by Barahona and Pecora [47] and Hong and Choi [48], information propagates faster on many small-world networks of undirect uniformly coupled identical oscillators. Thus, the topology of neuroanatomical networks provides a better propagation of activities than regular or equivalent random networks. Also, Lago-Fernández et al. [444] showed that nonidentical Hodgkin-Huxley neurons coupled by excitatory synapses present coherent oscillations in regular networks, fast system response in random networks, and both advantages in small-world networks. On the other hand, Percha et al. [445] showed that small-world neural networks suffer a transition from local to global phase synchrony depending on the rewiring parameter for network construction ( [445]). Indeed, the authors suggest that neural systems may form networks whose structures lie in the critical regime between local and global synchrony. In this way, the appearance of connections in injured regions may lead to the onset of epileptic seizures. Sinha et al. [446] showed that the different ratios of long-range connections in small-world networks can result in strikingly different patterns. Indeed, recent studies suggest the functional role of neuronal-glia ratio in neuro-dynamical patterns, e.g., epilepsy [447]. Chatterjee and Sinha [448] analyzed the hierarchical structure of the C. elegans nervous system through k-core decomposition and showed evidence that the assortativity increases as one goes to the innermost core of the network. The authors suggested that such assortative nature of the inner core can help in increasing communication efficiency while turning the network more robust at the same time. Therefore, the topological organization of neuroanatomical networks is directly related to network function. A good review about dynamical modeling of brain functions is [449].
Other approaches of brain functional networks are based on the concept of functional or effective connectivity. The network is obtained by recordings of brain physiological functions instead of brain anatomy. Aertsen et al. [450] introduced graph theory in the study of brain functions. Three basic approaches are used to obtain the connection structures: (i) electroencephalographic (EEG), (ii) magnetoencephalographic (MEG), and (iii) functional magnetic resonance imaging (fMRI). The data from the two first methods are suitable for graph analysis because of the high spatial resolution. Stam [451] presented one of the first works considering MEG and networks. By performing MEG recordings of five healthy human subjects, the graph was formed by vertices and edges. For frequency bands smaller than Hz and larger than Hz, the synchronization patterns displayed the features of small-world networks. Bassett et al. [452] detected small-world properties in brain functional networks obtained from 22 subjects using wavelet decomposition of MEG time series. Dodel et al. [453] applied graph theoretical analysis to identify functional clusters of activated brain areas during a task.
Fallani et al. [454] investigated the cortical network dynamics during foot movements and showed that circular motor areas act as network hubs, presenting a large number of outgoing links. In another work, Fallani et al. investigated the cortical network structure of spinal cord injured patients (SCI), comparing with health subjects [455]. They analyzed the structure of cortical connectivity obtained by the Direct Transfer Function (DFT) applied to the cortical signals estimated from high resolution EEG recordings achieved during the attempt to move a paralyzed limb by a group of five SCI patients. The consideration of the DFT allows to determine the directional influences between each pair of channels in a multivariate data set, allowing to construct a directed network [455]. The analysis of network structure showed that spinal cord injuries do not affect the global efficiency. Nevertheless, the authors observed significant differences in the cortical functional connectivity between SCI and normal patients, which can be related to the internal organization of the network and its fault tolerance (these networks present hubs). In addition, SCI patients revealed a higher local efficiency than healthy subjects, which can be associated to more robustness of the cortical networks of these patients.
Eguíluz et al. [456] showed that the functional network obtained by fMRI for seven subjects follows a power law. The unweighted networks are obtained by correlation matrices, which are derived from functional correlations between brain sites (called “voxels”). Two voxels are connected if their temporal correlation exceeds a pre-defined threshold . The main drawback of this approach is related to the choice of the right . For , and , scale-free topologies were seen in the networks, regardless of the type of task. High clustering coefficient (), relative small-world ( for , for , and for ), well defined coefficient of the power law (), and hierarchical organization () were observed. Therefore, the functional networks were scale-free and small-world. Similar studies were performed by Salvador et al. [457] with five subjects, but using the frequency rather than the time domain. Achard et al. [458] concluded that the brain regions are so resilient to random failures as to target attacks (removal of the largest hubs), thus indicating that the brain networks are not scale-free as suggested by Eguíluz et al. [456].
MEG and EGG techniques were also used to study the relationship between brain networks topology and brain pathologies. The matrices obtained by pairs of synchronization likelihood values were converted in unweighted networks by taking a threshold. Stam [451] chose the threshold to keep the network with average degree equal to 15. Stam et al. [459] compared a group of 15 Alzheimer patients to a healthy control group of 13 patients and showed that the networks obtained for the first group have less pronounced small-world features than for the healthy patients. Bartolomei et al. [460] compared the networks of spatial patterns of functional connectivity of the brain measured at rest by MEG obtained for 17 patients with brain tumors to 15 healthy patients. They concluded that brain tumors alter the functional connectivity and the network topology of the brain. While pathological networks are closer to random networks, healthy networks are closer to small-world networks. Therefore, randomization in network structure can be potentially associated with brain damage.
In summary, the complex network theory is useful for neuroscience, opening up new opportunities and creating new challenges. For instance, one may try to understand how brain topology changes during animal growth or evolution. Also, the implications of the genetic and environmental factors for brain formation can be addressed by network representation. Studies related to brain structure and pathologies may help understand brain diseases.
17 Linguistics
The creation of language is one of the greatest accomplishments of the human beings. Understanding the evolution and organization of a specific language is useful because it sheds light into cognitive processes, as the way people think strongly affects the organization of a language. Conversely, the language influences how humans think. It is also important to compare the properties of various languages, to study their evolution. Moreover, the use of linguistic data is crucial for automated systems such as Web search engines and machine translators. Various linguistic structures can be treated as networks, including texts and thesauri [461]. The Natural Language Processing (NLP) [462] community has traditionally used such network representations to develop applications for automatic language understanding and generation. For instance, Graph Theory concepts have been applied to sentiment analysis [463] and tools from Spectral Graph Theory have been used in word sense disambiguation and text summarization [464]. More recently, linguistic networks were included in the context of complex networks research. Novel techniques frequently based on statistical physics are now used in language studies [465, 466], providing new approaches for NLP applications and linguistic theories. Indeed, there has been an increasing effort to join statistical physics and language research, as demonstrated by the workshop inside STATPHYS 23, the largest conference for statistical physics [467].
A linguistic network can be formed by, for example, a group of interconnected words or syllables. The many ways these elements can be linked in a network lead to a division of two main groups of linguistic networks: semantic and superficial. The former group comprises networks such as the ones constructed from dictionaries or lexicons, which usually contain information about semantic relationships between words, such as synonyms or antonyms. The latter group mainly uses the inner structure of words or the position of words in texts to build networks. For example, in a word-adjacency network, words are connected if they appear as neighbors in a text. These linguistic networks are frequently analyzed according to well-known criteria, such as the ones characteristic of small-world and scale-free networks. Consequently, the tools most often used to study linguistic networks are the measurements referred to as degree, clustering coefficient and length of the shortest paths. Examples of these investigations are presented and discussed in the next subsections.
17.1 Semantic Networks
Semantic networks usually encode relationships between a subset of words of a language, as in a thesaurus where each entry (frequently a word) is followed by a list of words that express concepts similar to the entry. An example of English thesaurus used to build semantic networks is the Roget’s Thesaurus, originally published in 1852. The Wordnet database is another common resource for semantic networks. This lexicon groups words into sets of synonyms and stores other semantic relationships between words, such as antonymy, hypernymy and hyponymy. A semantic network can also be obtained from word-association experiments, where someone sequentially and freely provides words that he/she thinks are semantically related.
Semantic networks frequently exhibit small-world, scale-free properties. As already mentioned, a small-world network presents high average clustering coefficient and low average shortest path, while a scale-free network is characterized by a power-law degree distribution. English [468, 469, 470] and Turkish [471] synonym networks are known as small-world and scale-free networks, and a Polish synonym network was verified to be scale-free [472]. A directed network was built for an English thesaurus in [470], and the and distributions were described by two power-law regions. It was even suggested that associative memory is originated in a process of efficiency maximization in the retrieval of information (also related to the fact that the neural network is a small-world network) [469]. Cycles of tourist walks were used to give complementary information to the clustering coefficient and the shortest path (a tourist walker goes to the nearest site that has not been visited in the last steps) [473]. The English Wordnet was scale-free, small-world [468, 474], with polysemic links (which indicate the different meanings of a word) being important for the small-world effect because they tend to shorten distances, and hubs typically represent abstract concepts. Word-association networks are also scale-free, small-world [468, 475, 476]. When the flow of sequentially induced associations is considered, other properties such as context biasing and edges asymmetry are present [475]. Evoked words from two economically distinct populations were used to build word-association networks that were scale-free an independent of the population’s economic level [476].
The process of lexical development for an individual was modeled in [468], using a preferential attachment strategy that produces both scale-free and small-world structures. The network obtained with this model encodes associations, which can be thought of as semantic, between words or concepts. Three main rules guide this model: (i) a process of differentiation, in which a new word/concept is defined as the variation of the meaning of an existing word/concept through the acquisition of part of the pattern of connectivity of an existing node; (ii) the probability to differentiate a node is proportional to its degree; and (iii) each node has a “utility” value which gives the probability that it will be connected to new nodes. As shown in [468], this model produces networks similar to those obtained from real-world data of word-associations.
17.2 Superficial Networks
The networks discussed in this subsection do not employ semantic information; instead, they use morphological properties of words or their position in sentences, or even syntactic structures. One of these networks is based on a list of consonants pertaining to specific natural languages. The set of syllables of a language may be used to build another type of superficial network, where the nodes are the syllables and the edges indicate that two syllables co-occur in the same word. Another network of interest encodes on its structure the proximity of words in texts. In such a network, referred to as a word-adjacency or co-occurrence network, words that appear in a text near to each other are connected, as word proximity frequently indicates a syntactic relationship [466]. Syntactic properties can be encoded in the network explicitly if a grammar formalism is employed, such as dependency grammars.
As for semantic networks, the concepts of degree distribution, clustering coefficient and length of the shortest paths are used to characterize superficial networks. A bipartite consonant network displayed a two regime power-law distribution for the occurrence of consonants over languages [477]. This network presents two sets of nodes, one for the 317 languages and one for the 541 consonants, where a consonant node is connected to a language node if the former is present in the latter. A Portuguese syllable network, built from the entire work of the eminent Brazilian writer Machado de Assis, also presents a power-law degree distribution, along with the small-world effect [478]. Although some superficial networks were studied regarding community structure (see [479] that employs a non-bipartite consonant network), the most investigated network properties are indeed the small-world effect and the scale-free degree distribution. Some word-adjacency networks obtained from the British National Corpus (BNC) were shown to be small-world and scale-free [466], where the authors also associated language disorders to hubs disconnection. Word-adjacency networks built from technical and literary texts in English and Portuguese were shown to be scale-free and small-world [480]. Moreover, the George Orwell’s novel “1984” was used to build a word-adjacency network [481], which exhibited a composite power-law behavior when the node degree was correlated to the average neighbor’s degree and to the average clustering coefficient. Word-adjacency networks from different languages (English, French, Spanish and Japanese) were found to belong to a super family of networks based on the significance profile of specific subgraphs (motifs) [261]. The significance profile compares the number of a given motif in a real network with its number in a random network with the same size and degree distribution. In another work, syntactic networks were obtained for Czech, German and Romanian texts using a dependency grammar formalism, where binary relations were defined between lexical nodes [482]. The authors showed that these networks present the small-world effect, a scale-free degree distribution and disassortative mixing. Using this syntactic dependence network for the Romanian language [483], it was also shown that spectral methods developed to detect community structure [484] can be useful to group words of the same class.
Word-adjacency networks have been applied to some natural language processing tasks. For instance, choosing the synonym most expected in a given context can be done using a word co-occurrence network [485]. An automatic assessment of text quality was implemented with network measurements, in which correlation was established between measurements (such as degree) and text quality scores assigned by humans to essays written by high-school students in Portuguese [486]. A more specific task of quality assessment was studied in [487, 488], where network measurements were associated to the evaluation of the quality of Portuguese summaries. A similar approach was adopted in [489] to assess the quality of machine translations, where the original and translated texts, or more specifically, their word adjacency networks, were compared. The degree of structural change from source to translation was measured and correlated with translation quality. Another NLP task studied with word-adjacency networks was the authorship characterization, where texts in English created by famous writers were related to network measurements [490]. In measurements taken from English, Bengali and Hindi, lexical networks were correlated with some issues related to the construction of spell checkers [491]. These networks were weighted, where each edge was associated with the orthographic distance between words (this distance consider the number of character substitutions, deletions or insertions necessary to transform one word into another). The authors found that the weighted clustering coefficient is correlated with the difficulty to correct non-word errors (i.e. spelling errors resulting in nonexistent words). Real word errors, which are misspelled words still valid in the given language, were found to be higher in words with higher weighted degree. In another applied research, a framework based on syntactical networks for the study of language acquisition was proposed [492]. The author defined a set of criteria to build syntactical networks from child utterances collected at successive time intervals. From these networks, measurements such as degree, clustering coefficient, length of shortest paths and assortativeness were proposed to assess language development in children.
A growth model for word-adjacency networks was reported in [480], which adds to a network full sentences instead of single words. Every word of a new sentence is represented by a node that is connected to the other nodes of the sentence (i.e. the sentence is represented by a complete subgraph – a clique). The ratio between new and old words in a sentence decreases over time according to a power-law, with the old words being the hubs. This model is in good agreement with real data, and presents both scale-free and small-world properties. A preferential attachment approach for building consonant networks was reported in [477]. The degree distribution fits well with the network obtained from a real consonant inventory. The models of language development created by Dorogovtsev and Mendes [465] and Markošová [493] also employ the degree-based preferential attachment rule to make connections between newly created words and words already inserted in the vocabulary. In these cases, the vocabulary is a web of words that interact in sentences, thus it is a positional (or co-occurrence) word web. Dorogovtsev and Mendes also defined that, as new nodes are created, new edges are created between old words, again using the preferential attachment rule. Markošová, instead, preferentially rewired some old edges, thus both models incorporate changes in vocabulary use. Their models fit the experimental data with a two- regime power-law distribution of degrees.
The papers reviewed in this section cover many of the possibilities to represent linguistic structures as networks, ranging from word-adjacency to synonym networks. Most exhibit small-world and scale-free features, despite being rather different from each other, like syllable networks and Wordnet. Many studies on linguistic networks focus on experimental global features of the structures, while some works are devoted to model the evolution of these networks, with results agreeing with experimental data. Another important issue is the application of linguistic networks to NLP, for helping develop spell checkers and automatically assess text quality. As far as we know, networks using more sophisticated resources such as argument structure have not been studied yet, perhaps mainly because of the difficulty in obtaining large amounts of related data. Modeling the development of language with specific individuals has also its drawbacks, since we do not know how language vocabulary or syntactical rules are stored in the brain. As for applied research, there is a great deal of possibilities unexplored, such as improving parsers and machine translation systems. The great challenge in this case is to choose the right type of network and analysis method to retrieve the desired information from interlinked structures.
18 Earthquakes
The study of earthquake occurrences and its spatial distribution may be done through complex networks. Abe and Suzuki [494, 495] proposed a method in which the Earth surface was divided into cells that were the nodes of the network. Two successive earthquakes (i.e without any other between them) establish a new link in the network between the cells where these shocks occurred. Upon analyzing seismic data from Japan and California, the authors showed that both earthquake networks have a scale-free topology with different scale coefficients. This difference may characterize the distinct tectonic plates analyzed. The hubs were found to be related to the place where a mainshock occurred (i.e earthquakes with large magnitude). In another paper [496], the earthquake network was shown to have a very small average path length and high clustering coefficients, in comparison to the random network version. These results suggest the presence of the small-world effect and a hierarchical organization, as indicated by the power-law behavior of the clustering coefficient with respect to the node degree [497]. The seismology network is therefore different from the Barabási-Albert networks, which also has a scale-free degree distribution but no hierarchical structure. Structured networks contain features that are linked to the physical properties of the earthquake dynamics. The mixing property was investigated using the concept of nearest-neighbor average connectivity, in which Abe et al. showed that highly connected nodes are linked to each other, for both seismology networks, namely from California and Japan. Abe and Suzuki [498] discovered that in the growth of a seismology network after the main shock the clustering coefficient remains constant during the time , which depends on how the network was built, typically of the order of hours. After , the clustering coefficient has a steep drop and then decays slowly according to a power law before it becomes steady again.
The seismology networks were also studied by Baiesi and Paczuski [499], who used correlation between events to classify them systematically as foreshocks, main shocks and aftershocks. The network was built with each earthquake (node) receiving one incoming link from its most correlated predecessor, while outgoing links referred to aftershocks. It displayed the scale-free behavior with exponent . The metrics used consider the magnitude and the spatial and temporal distances between events. Two spatially distant earthquakes can be related if the temporal distance is short, which is consistent with the self-organized nature of earthquake dynamics.
Networks built from the seismology data from different places in Earth have about and nodes, with scale-free topology. The results from network analysis may help us understand the collective behavior and perhaps predict these natural events.
19 Physics
Many phenomena in physics may be modeled as networks. For instance, in 2001, Bianconi and Barabási [500] discovered that a Bose-Einstein condensate was related to complex networks. The authors mapped the network in a Bose gas, where the nodes corresponded to energy levels and the links were particles. The condensation state was reached when a single node had a macroscopic fraction of the links. Burioni et al. [501] reported a complementary work with topological heterogeneities in the network.
19.1 Energy landscapes
In 2005 Doye and Massen [502] used networks to study the configurational space of the Lennard-Jones potential. To build the network, called reaction graph, the authors took each minimum of the potential function as a node, with the surrounding of each node defining its basin of attractions. The nodes were connected when there was a direct state transition between their corresponding minima, not considering auto-loops and multiple edges. The results indicated that the network topology is scale-free and small-world. The authors found an interesting negative correlation between the degree and the potential energy of the minima, indicating that the low energy minima act as hubs, the signature of scale-free networks. Interestingly, the scale-free nature of this network is not due to preferential attachment, but a direct consequence of the potential landscape topography, because the basins of attraction related to the low-energy minimum are larger in general and more likely to have surrounding transition states. The authors also suggested that the small-world effects can be useful to explain the Levinthal paradox (which states that the time of a protein to arrive at its native conformation is larger than the age of the universe) because it reduces dramatically the number of steps needed to find the native conformation. For example, in a typical problem with minima, algorithms based on global optimization converge, in average, after only 150 minima. Reaction graphs were already used in previous papers, such as [503], to investigate the isomers of water dimer, and [504] to study interconnection of the protein conformal space. Gfeller et al. [505] also studied energy landscapes through networks (weigthted in this case). Their findings include some analytical results for low-dimensional models and they discuss how the network approach is useful to study the isomerization problem. The landscape of spin-glasses mapped in networks by Seyed-allaei et al. [506] had a Weibull distribution for the degree, instead of the power-law found previously for the Lennard-Jones potential [502]. The authors concluded that the topology of the landscape networks is not universal because they depend on the physical properties of the model system.
19.2 Astrophysics
Magnetic effects were also explored through complex network concepts. In [507] the authors suggested that the solar corona can be thought of as a critical self-organized system. Hughes and Paczuski [508, 509] studied the spatial structure of a network generated from this critical system after the transient phase. To build this network, an approach similar to that of earthquakes studies was used, with the solar surface being a discrete mesh with each mesh cell being a node. Two nodes were connected when a magnetic arc (solar flare) emerged between the cells. The network obtained has scale-free topology with power law distributions of degree and strength.
19.3 Ising Model
With the increase of popularity of complex networks, systems that were only studied in regular networks started to be described in networks with arbitrary topologies. This is the case of the Ising, Potts and models. Gitterman [510] showed that a phase transition occurs when there is a minimum number of long range connections per node. Barrat and Weigt [511] found that at high temperatures the system behaves as in the conventional 1D case. At low, non-zero temperatures, a ferromagnetic phase transition was found in the small-world Ising model. Therefore, the phase transition in the small-world Ising model is of a mean-field nature. In 2001, Hong et al. [512] used Monte Carlo simulation to confirm the results of Gitterman [510], Barrat and Weigt [511], and found critical exponents , , and ( is the critical exponent for specific heat, is the critical exponent for magnetization. and are the critical exponent for the susceptibility). S. Roy and S. M. Bhattacharjee [513] also studied the Ising model under small-world topology.
The two and three dimensional cases of the small-world Ising model were studied by Herrero [514]. He noted that, in 2D and 3D, the small-world geometry changes the universality class of the phase transition. In 1D, the critical temperature is given by where is the probability of rewiring an edge. Herrero found that in 2D and 3D, the dependence between and is given by the power law , where is the critical temperature in the regular lattice and is the spatial dimension. The bidimensional Ising model was also studied by Cai and Li [515].
The Ising spin system under a scale-free topology was investigated by Aleksiejuk et al. in 2002 [516] and Bianconi [517]. A ferromagnetic-paramagnetic phase transition was observed, with the critical temperature depending on the network size as . The analytical solution for this model in a network with arbitrary degree distribution was found in [518, 519]. In 2004, a spin system under a directed version of the Barabási-Albert network was investigated by Sumour and Shabat [520], who used Monte Carlo simulation to show the existence of spontaneous magnetization of the system.
The p-Potts model was investigated by Dorogovtsev et al. in 2004 [521] for networks with degree distribution . The authors showed that when the second moment of this distribution diverges, the phase transition is continuous and of infinite order instead of the first-order phase transition.
20 Chemistry
While applying complex networks concepts in chemistry, Jiang et al. [522] showed how an ammonia plant can be mapped in a complex network with small-world properties. The ammonia plant network is weakly self-similar and possesses a modular structure, with each community representing a modular section in chemical plants. Another interesting result is that the ammonia complex network exhibits excellent allometric scaling, guaranteeing a better fluid flow. Amaral and Barthèlemy [523] showed that the small-world effect emerges on the phase space of polymer conformations. For this, each conformation was represented by a single node in a complex network and two nodes were connected if the Monte Carlo distance between them was unitary. Another work involving polymer analysis through complex networks was developed by Kabak ioglu and Stella [524]. Chemical reactions were studied as a complex network topology. For example, Lazaros and Argyrakis [525] investigated the classic model and under scale-free topology. Their results indicate that the speed of the reaction is rather faster than in lattice models. The authors also observed that the diffusion behavior on very sparse scale-free networks is the same as for regular lattices.
Another network built from chemical reactions can be found in [526], in which the UMIST Database for Astrochemistry was used to generate networks. The nodes were reactants and products of each relevant reaction found in the interstellar medium and in planetary atmospheres (including Earth, Mars, Titan, Venus). Among the results, two basic topologies were revealed and associated with the presence or absence of life. According to the authors, the Earth chemical network is the only one to present a scale-free topology, although all the others also displayed small-world properties. The community structure was investigated in the Earth chemical reaction network, with two main communities being identified. They are related to reactants and products of the reactions with OH and Cl, and one of the products is H2O. The authors suggest that the community structure in this network results from action of the most reactive free radicals of Earth atmosphere, namely Cl and OH.
The range of applications of complex networks in chemistry is particularly high. In this section we showed applications in unitary processes, polymers, chemical reactions and astrochemistry. We have seen how the networks theory can help one identify the main features in industrial plants, such as small-world topology, modular structure and allometric scaling. Also, the use of network concepts may allow the determination of the lowest energy state, in spite of the millions of possible polymer conformations, because the phase space can be mapped quickly owing to the small-world topology.
21 Mathematics
Complex networks have been used to represent sets of natural and prime numbers connected by some specific rules. Corso [527] used a theorem of number theory, which states that each natural number has a unique decomposition in prime factors, to build a network. Two natural numbers (nodes) were connected if they shared at least one prime factor. The networks were nonsparse and small-world (, ). The degree distribution was invariant with network size (number of natural numbers considered to build the network) and presented a plateaux related to families of prime numbers. Chandra and Dasgupta [528] used a similar method to connect two prime numbers according to a free parameter (). An even number can be written as a sum of two prime numbers p and q: . The probability of establishing a connection between p and q is . The authors observed a phase transition in the network topology by varying the free parameter. For , the network exhibits a scale-free topology and high clustering coefficient, characterizing a small-world effect. Outside this regime, the power law of the degree distribution was not observed, but the hubs still existed. The size of the network studied is nodes.
22 Climate networks
The extension of network theory to climate sciences was performed by Tsonis et al. [529, 530, 531], where the networks is constructed considering the climate system, represented by a grid of oscillators – each of them is a dynamical system varying in some complex way. The nodes in the network represent cells of a grid of 5o latitude 5o longitude that covers the globe. The connections between the nodes were defined through a threshold of correlation coefficient of a time series of each node. The connections are obtained by considering the database from global National Center for Environmental Prediction/ National Center for Atmospheric Research (NCEP/NCAR). Generally, data from 500 hPa value, which indicates the height of the 500 hPa pressure level and provides a good representation of the general circulation of the atmosphere, are used for network construction. If the correlation coefficient for 500-hPa time series of two nodes exceeds 0.5, these nodes are connected. The resulting network revealed to be scale-free with small-world behavior [529].
Climate networks can be considered to identify global change and for investigation and representation of climate dynamics [529]. For instance, Tsonis and Swanson [532] constructed the El Niño and El Niña networks by taking into account the global temperature. They show that El Niño network network is less communicative and less stable than El Niña network, because the former present fewer links and lower clustering coefficient and characteristic path length than the latter. Due to these applications, complex networks provide a new and useful tool in climate research.
23 Security and Surveillance
Latora and Marchiori [533] studied the consequence and prevention of terrorist attacks in a given network, and suggested a method to detect critical nodes (i.e. the most important nodes for efficient network functioning). The network efficiency is related to the shortest path between all nodes of the network. The importance of a particular node is given in terms of the change in network efficiency when this node is removed. The deletion of an important node leads to a large decrease in network efficiency. The authors illustrated this concept in the communication network Infonet, which is the US and European Internet backbones. After deactivating all nodes, one by one, the most important nodes detected were New Jersey and New York. The results indicated that the destruction of these nodes can reduce network efficiency by more than . Another important result indicated that the most connected nodes are not necessarily the most important. For example, deactivation of Chicago, with degree 15, only reduces network efficiency by , while New Jersey and New York, both with degree 9, reduces network efficiency by and , respectively.
In the same paper, the authors gave a second example in which they built a network where the nodes were the terrorists related directly or indirectly with hijackers of September 2001 attacks. The links are the knowledge interplay among the hijackers. The data were obtained from information taken from major newspapers. The most critical node had the largest number of direct connections with other terrorists. The second most critical node had degree of only half of the maximum. This shows that even nodes with low connectivity can play a crucial role for the network efficiency. In 2002, Krebs [534] also analyzed a network of hijackers linked to events of September 11th. According to the author, using network theory to prevent criminal activity is difficult, but it is an important tool for prosecution purposes. Maeno and Ohsawa [535] proposed a method to solve the node discovery problem in complex networks, which may be applied to identify an unobserved agent behind the perpetrators of terrorist attacks.
24 Epidemic spreading
Epidemics of computer viruses have been studied with the aid of graphs and random graphs for at least three decades. In 1991, Kephart and White [536] extended epidemiological models to investigate the spreading of computer viruses using a directed random graph. They showed that proliferation can be controlled if the infection rate does not exceed a critical epidemic threshold. Kleczkowski and Grenfell [537] applied a cellular automata model to the spreading of diseases in small-world networks, where the dynamics of the clusters was investigated as a function of the network order parameter (the fraction of the long range links). In the model, agents were placed in the nodes of a two-dimensional square lattice. The nodes were classified as infected, infectious and immune. At each time step ( ) each agent interacts with its nearest neighbors. Moreover, the authors included a mixing pattern in the model, i.e. they allowed two agents to swap their positions at any time, in order to reflect the rules of the social structure. The results showed that upon increasing the mixing the disease spreads faster. The problem of epidemic spreading in small-world networks was also explored in [538], where the authors found the exact values for the epidemic thresholds as a function of the infection and transmission probabilities. Also studying this system, Kuperman and Abramson [539] found an interesting oscillatory behavior of the size of the infected subpopulation. The authors showed that the number of infected agents changed from an irregular, low-amplitude state, to a spontaneous, high amplitude state, when the order parameter changed from 0 to 1. Recently, Small et al. [540] showed that only with the introduction of a small-world topology in the epidemiological model the random fluctuation of the real data could be explained.
Pastor-Satorras and Vespignani [541] showed that, in contrast to the pure small-world lattices, the uncorrelated scale-free networks with exponent do not have a critical threshold, thus indicating that in these networks diseases spread regardless of the infection rate of the agents. For the scale exponent in the range the critical threshold appeared but no critical fluctuations were observed. Only for has the traditional behavior been observed. For correlated scale-free networks with there is a non zero critical threshold for the spreading dynamics [50, 49]. This result was modified in subsequent papers [542, 543], where the authors used analytical arguments to show that in absence of higher order correlations, the epidemic threshold is null for scale-free networks with . The analytical solution of the SIR model (susceptible-infectious-recovered), including bipartite nodes and non-uniform transmission rate, was found by Newman [544]. The effects imposed by the finite size of the networks to epidemic threshold was studied by Pastor-Satorras and Vespiagnani in [545].
The lack of epidemic threshold in social networks with scale-free topology is worrying because for any transmission rate the disease can propagate to all nodes of the network [541, 546, 547, 548]. This is the case of the sexual contact network of Sweden, as shown by Liljeros et al. [547]. The solution to eradicate spreading of virus in these classes of network was proposed in [549, 550, 551], which is based on immunizing the hubs of the network (target immunization). Through computer simulation they showed that this approach is able to eradicate the disease, being more effective than a random immunization. Though efficient, this method requires a priori information about the whole network structure, such as the connectivity of all nodes. Instead of this global approach, Cohen et al. [552] suggested a local method referred to as acquaintance immunization, where a subset of nodes was randomly selected and, depending on the neighborhood of each node, immunization was performed. In [553], Gómez-Gardeñes et al. studied various immunization strategies for Internet maps at the Autonomous Systems (AS) and Routers networks. They suggested a new immunization method that is neither local nor global, in which each vertex looks at its neighborhood (at maximum distance ) and immunizes the highest connected neighbor. The results confirmed this to be the most efficient method.
Spreading on growing networks was investigated by Hayashi et al. [554] who studied the oscillatory pattern for the number of infected computers on scale-free networks as new users joined. The authors simulated the spreading dynamics on networks with exponent of degree distribution extracted from real data of received and sent emails. Random immunization was not able to eradicate the virus. The number of infected computers oscillated with a period depending on the fraction of vertices that receive immunization. It also occurs in the scale-free networks, but in this case, it is possible to find a set of parameters to stop the oscillatory pattern and eliminate the virus. For example, an immunization of of the hubs in a growing scale-free network prevents virus infection.
Real data of Mycoplasma pneumoniae infection was used in [555] to build a mathematical model and investigate the spread and control of this disease in closed communities. Other approaches, including percolation theory, have also been used to study epidemic spreading with complex networks [556, 557]. Small et al. [558] compared the data from the SARS cases in Hong Kong in 2002 with various models. While the classical SIR model is able to describe epidemic spreading at a large scale, the small-world network model is better to describe the local variability. The Hong Kong SARS data were also used in [559] where a new 4-state model was used to simulate the disease transmission under a small-world topology. The model included as agents those who were infected but not yet infectious, and as the main result the author found that outbreaks could be prevented if the patients with symptoms were isolated as soon as possible. Another model applied to SARS spreading of virus in Hong Kong can be found in [560]. In 2007, Small et al. [561] studied the distribution of Avian Influenza virus among wild and domestic birds, and obtained a network with scale-free topology with no epidemic threshold. Therefore, local methods could not be used to eradicate the disease, thus pointing to attacks to the hubs as a possible strategy.
Li and Wang [562] studied the SIR dynamics on small-world networks with a delay-time recovery. The results indicate that actions to recover the network should be executed as soon as possible to avoid spread of the infection. The recovery of geographic networks depended on the action radius (local region immunization), where a critical radius existed, above which the epidemic spreading vanished [563]. A particular type of scale-free network with self-similar structure, high clustering coefficient, "large-world" and dissortative behavior was used by Zhang et al. [564] to solve the SIR model. They used a renormalization approach, and found an epidemic threshold, with the degree distribution being insufficient to characterize the epidemic dynamics.
25 Collaboration Network of the Papers Cited in this Review
In order to have a more complete perspective of the works addressing applications of complex networks, we constructed a network of collaborations taking into account the references listed in the present survey. More specifically, each author in each reference entry was mapped into a node, while co-authorship was considered to implement the connections (i.e. an edge was used to interconnect each pair of co-authors). A program was especially implemented to filter and organize the Bibtex database. The network contains 1,028 nodes and 4,707 edges, and is illustrated in Figure 2 with the main areas covered being identified by red circles. Several features can be seen in this figure. First, the overall network is highly fragmented, except for two larger connected components. This high fragmentation indicates that application of complex networks is still performed by distinct communities of researchers, in a little integrated manner. As a consequence, the concepts and methods used by each of the communities are not likely known or applied by the other communities. It is felt that important and interesting advances could be achieved through a more integrated research and more intense collaboration between the several communities in Figure 2. Table 4 shows the main measurements of the topology of the collaboration network. The way in which the network was built naturally implies in a high clustering coefficient. The assortative mixing coefficient () is particularly high, implying that highly connected researchers tend to be co-authors with few connected collaborators..
Figure 3 presents the connections between the research areas covered by complex networks. The vertex sizes represent the number of researchers by area, and the strength of the links stand for the number of researchers shared by pair of areas. The numbers of authors appearing in two areas are shown in Table 6. The percentage of authors by area is shown in Table 5. The Biomolecular area concentrates many authors mainly due to the importance of complex networks theory to model biological interactions [327]. It is interesting to note that the strongest connections occur between the four pioneers areas in complex networks, i.e. Social, Internet, Biomolecular and WWW (these areas also include a larger number of authors). Other strong connections occur between affine areas, such as Social sciences and Epidemiology, Social sciences and Communication, Social sciences and Transportation, Social sciences and WWW, Internet and Computer Science, Internet and WWW, Internet and Transportation. Distinct areas, such as Power Grid and Economy or Linguistics and Epidemiology, have only a few or even no links. The Social sciences, Internet and Biomolecular areas act as hubs in the network, sharing many authors with other areas. The large percentage of researchers of these areas (see Table 5) suggests that the studies related to society, Internet and cellular process has been particularly relevant in complex networks investigations.
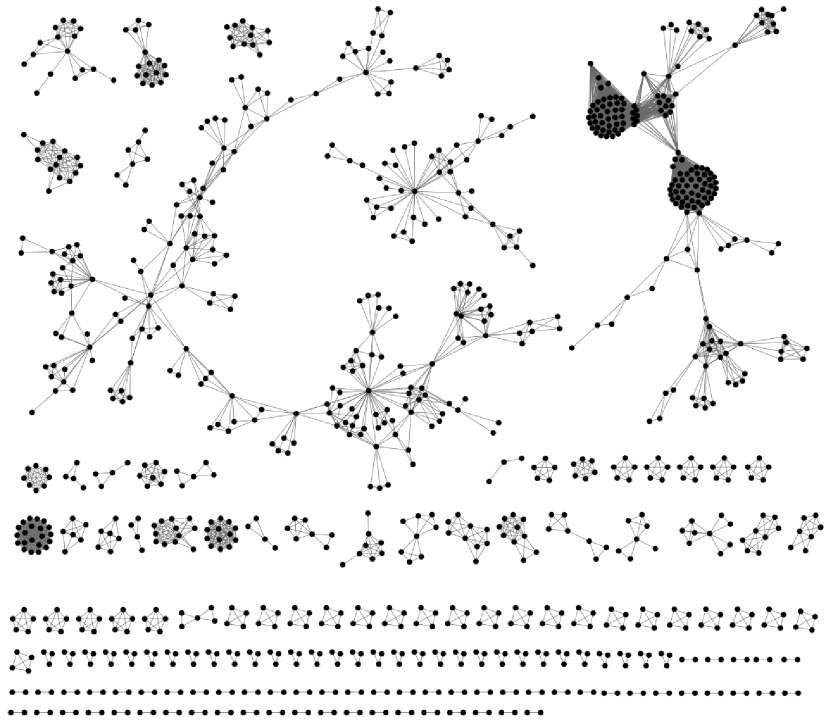
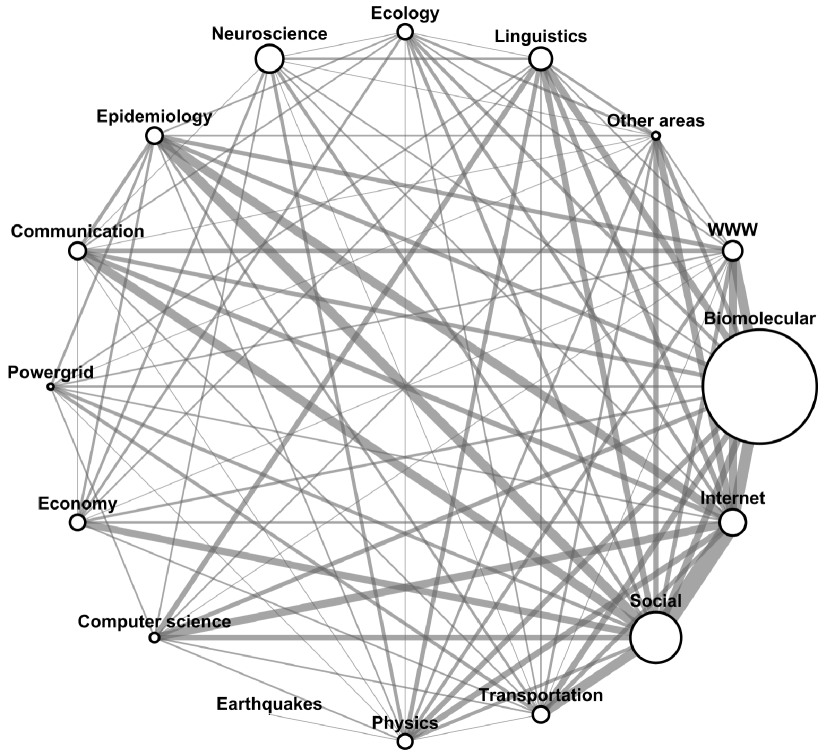
| Measurement | Value |
| Number of nodes | 1028 |
| Number of edges | 4707 |
| Average degree | 9.16 |
| Maximum degree | 70 |
| Average clustering coefficient | 0.78 |
| Assortative mixing coefficient | 0.92 |
| Size of the giant component | 209 |
| Average shortest path length∗ | 4.89 |
* Inside the giant component.
| Area | Size |
|---|---|
| Biomolecular | 32.88% |
| Social | 15.08% |
| Neuroscience | 8.56% |
| Internet | 8.17% |
| Linguistics | 7.10% |
| WWW | 6.23% |
| Communication | 5.45% |
| Epidemiology | 5.35% |
| Transportation | 5.35% |
| Economy | 5.06% |
| Physics | 4.86% |
| Ecology | 4.47% |
| Computer science | 3.40% |
| Other areas | 2.92% |
| Powergrid | 2.43% |
| Earthquakes | 0.39% |
| Area 1 | Area 2 | Number of authors in common |
|---|---|---|
| Biomolecular | Internet | 13 |
| Biomolecular | WWW | 11 |
| Biomolecular | Social | 8 |
| Biomolecular | Linguistics | 8 |
| Biomolecular | Transportation | 7 |
| Biomolecular | Physics | 6 |
| Biomolecular | Computer science | 5 |
| Biomolecular | Communication | 5 |
| Biomolecular | Epidemiology | 5 |
| Biomolecular | Ecology | 4 |
| Communication | Social | 10 |
| Communication | Internet | 6 |
| Communication | WWW | 5 |
| Communication | Epidemiology | 4 |
| Computer science | Internet | 9 |
| Computer science | Social | 6 |
| Computer science | Linguistics | 6 |
| Ecology | Social | 4 |
| Ecology | Internet | 4 |
| Economy | Social | 8 |
| Epidemiology | Social | 11 |
| Epidemiology | Internet | 10 |
| Epidemiology | WWW | 5 |
| Internet | Social | 20 |
| Internet | WWW | 9 |
| Internet | Physics | 7 |
| Internet | Linguistics | 6 |
| Internet | Transportation | 5 |
| Linguistics | Social | 7 |
| Linguistics | Physics | 5 |
| Neuroscience | Social | 4 |
| Neuroscience | Physics | 4 |
| Physics | WWW | 4 |
| Physics | Social | 4 |
| powergrid | Social | 4 |
| powergrid | Transportation | 4 |
| Social | Transportation | 11 |
| Social | WWW | 5 |
26 Conclusions and perspectives
Frequently, the success of new areas of physics are judged not only from their theoretical contributions, but also from their potential for applications to real-world data and problems. Despite its relatively young age, the area of complex network research has already established itself, especially through its close relationship with formal theoretical fields such as statistical mechanics and graph theory, as a general and powerful theoretical framework for representing and modeling complex systems. It has been capable of taking into account not only the connectivity structure of those systems, but also intricate dynamics (see, for instance, the surveys by Newman [23] and Boccaletti et al. [19]).
Judging by the large number of areas and articles reviewed in the present survey, complex networks have performed equally well (if not better) with respect to their application potential. Indeed, the generality and flexibility of complex networks extends to virtually every real-world problems, from neuroscience to earthquakes, encompassing at least the 22 areas considered in the present work. In addition, most of the studies report detailed, comprehensive investigations where not only complex systems are represented as networks, but their topological properties are also quantified with respect to a number of measurements. Also, frequently real-world networks are compared with some of the existing theoretical models such as scale-free and small-world. While the application potential of complex networks is clearly substantiated, it is important to conclude the present survey by conducting a global analysis of the reported applications.
Table 7 lists the 27 application areas considered here and the corresponding number of reviewed papers, the size of the networks, the number of applied measurements, as well as the number of theoretical models adopted for comparative purposes. Despite the bias implied by the choice of articles to be reviewed, this table still provides a representative snapshot of the state of the art in complex networks applications. The first remarkable feature in this table is the fact that protein applications is the area where complex networks have been more intensively applied (50 applications), while the applications in Internet (one of the important initial motivations for complex networks research) is limited to 42 articles. Other areas that received particular interest from complex network research include World Wide Web, transportation, neuroscience, and linguistics, all with at least 30 reviewed articles. The areas with the smallest number of applications (less than 10 revised articles) include actors, acquaintances, trust, sexual contacts, sports, financial market, metabolic, chemistry, mathematics, and earthquake. It is an interesting, difficult issue to identify which of these areas will remain little investigated, while others may become the focus of increasing attention.
Interestingly, the measurements to characterize quantitatively the connectivity of the networks vary considerably from one area to the other, reaching as many as 20 different measurements in the case of organizational management. Most applications, however, involve only 4 or 5 distinct measurements such as node degree and clustering coefficient. Surprising trends can also be identified in Table 7 regarding the number of theoretical models considered or proposed as part of the investigation of the real-world structures. Reinforcing the major motivation and importance the Internet has had in complex networks, a total of 12 models appeared in the application articles. This seems to corroborate the fact that a definitive model of the Internet has not been reached yet. Several papers with applications have considered 8 or more models, including linguistics, WWW, transportation and computer science.
The results contained in the revised works, as well as the several measurements and models adopted, provide unquestionable evidence about the importance and dynamics of the complex network field. Because of their intrinsic potential for representing, characterizing and modeling real-world complex systems, complex networks are poised to play a key role in an ever-increasing number of areas. The developments which may characterize the future application of complex networks include the use of additional measurements, required for a more comprehensive characterization of investigated structures, as well as additional theoretical models that may be created.
| Research field | Papers | Network size | Measurements | Models |
|---|---|---|---|---|
| Actors | 4 | 225,000 | 3 | 1 |
| Citation | 11 | 1,000– | 18 | 0 |
| Acquaintance | 7 | 1,500–375,000 | 12 | 0 |
| Trust | 2 | 60,000 | 5 | 0 |
| Sexual contacts | 9 | 1,500–3,000 | 2 | 1 |
| Sports | 3 | 100–13,500 | 4 | 0 |
| Music | 11 | 200–51,000 | 12 | 0 |
| Collaboration | 11 | 300– | 18 | 0 |
| Communication | 22 | 15,000– | 5 | 5 |
| Economy | 17 | 180 | 3 | 0 |
| Financial market | 8 | 200–30,000 | 10 | 1 |
| Computer science | 18 | 20–50,000 | 9 | 8 |
| World Wide Web | 30 | 1,000– | 7 | 9 |
| Internet | 42 | 30– | 12 | 12 |
| Transportation | 30 | 100–7,000 | 8 | 8 |
| Transcription | 20 | 500-2,000 | 5 | 2 |
| Power grid | 15 | 500–15,000 | 4 | 2 |
| Protein interaction | 50 | 2,000-20,000 | 5 | 3 |
| Metabolic | 9 | 500-1,000 | 6 | 0 |
| Ecology | 14 | 50–300 | 5 | 2 |
| Neuroscience | 31 | 100-1,000 | 5 | 0 |
| Linguistics | 35 | 100–500,000 | 13 | 8 |
| Physics | 27 | 210,000 | 2 | 2 |
| Chemistry | 3 | 400–3,200 | 5 | 2 |
| Mathematics | 2 | 100–5,000 | 5 | 1 |
| Earthquake | 6 | 1,200–60,000 | 6 | 2 |
| Epidemic spreading | 19 | 1,000– | 2 | 5 |
Acknowledgments
L. da F. Costa is grateful to FAPESP (proc. 05/00587-5), CNPq (proc. 301303/06-1) for financial support. F. A. Rodrigues acknowledges FAPESP financial support (proc. 07/50633-9). P. R. Villas Boas is grateful to CNPq sponsorship (141390/2004-2). L. E. C. Rocha is grateful to CNPq and to the Swedish Research Council (grant 621-2002-4135) for financial support. L. Antiqueira acknowledges FAPESP sponsorship (proc. 06/61743-7). M. P. Viana is grateful to FAPESP sponsorship (proc. 07/50882-9 ). We are also grateful to S. Abe , M. Ausloos, R. Baggio, Y. Bar-Yam, G. Bianconi, V. Blondel, D. Braha, R. Criado, F. D. Fallani, S. Dos Reis, B. Kahng, J. Kertész, R. Lambiotte, B. Li, F. Liljeros, D. Lusseau, M. M. Babu, Y. Maeno, G. Michailidis, A. Motter, C. Oosawa, A. Penn, S. Roy, A. Sánchez, S. Sinhá, M. Small, F. Sorrentino, D. Stauffer, F. Tamarit, M. Tugrul, D. Volchenkov, Y. Xiao, and T. Zhou for comments and suggestions.
References
- [1] A.-L. Barabási and Z. N. Oltvai. Network biology: understanding the cell’s functional organization. Nature Reviews Genetics, 5(2):101–113, 2004.
- [2] A.-L. Barabási. Linked: how everything is connected to everything else and what it means for business, science, and everyday life. Plume, 2003.
- [3] P. Erdős and A. Rényi. On the evolution of random graphs. Bulletin of the International Statistical Institute, 38(4):343–347, 1960.
- [4] P. Erdős and A. Rényi. On random graphs, 1959.
- [5] B. Bollobás. Random graphs. Cambridge studies in advanced mathematics ; 73. Cambridge University Press, Cambridge ; New York, 2001.
- [6] B. Bollobás. Graph theory : An introductory course. Graduate texts in mathematics ; 63. Springer Verlag, New York, 1990.
- [7] J. P. Scott. Social Network Analysis: A Handbook. Sage Publications, London, 2nd edition edition, 2000.
- [8] S. Wasserman and K. Faust. Social Network Analysis. Cambridge University Press, Cambridge, 1994.
- [9] M. Faloutsos, P. Faloutsos, and C. Faloutsos. On power-law relationships of the internet topology. Computer Communication Review, 29(4):251–262, 1999.
- [10] R. Albert, H. Jeong, and A.-L. Barabási. Diameter of the World Wide Web. Nature, 401:130–131, 1999.
- [11] R. Albert, H. Jeong, and A.-L. Barabási. Error and attack tolerance of complex networks. Nature, 406:378–382, 2000.
- [12] H. Jeong, S. P. Mason, A.-L. Barabási, and Z. N. Oltvai. Lethality and centrality in protein networks. Nature, 411(6833):41–42, 2001.
- [13] L. da F. Costa, F. A. Rodrigues, and G. Travieso. Protein domain connectivity and essentiality. Applied physics letters, 89(17), 2006.
- [14] R. Guimerà and L. A. Nunes Amaral. Functional cartography of complex metabolic networks. Nature, 433(7028):895–900, 2005.
- [15] A. Krause, K. A. Frank, D. M. Mason, R. E. Ulanowicz, and W. M. Taylor. Compartments exposed in food-web structure. Nature, 426:282–285, 2003.
- [16] M. E. J. Newman. The structure of scientific collaboration networks. Proceedings of the National Academy of Sciences, 98(2):404 – 409, 2001.
- [17] R. Guimerà, S. Mossa, A. Turtschi, and L. A. N. Amaral. The worldwide air transportation network: Anomalous centrality, community structure, and cities’ global roles. Proceedings of the National Academy of Science USA, 102:7794–7799, 2005.
- [18] M. T. Gastner and M. E. J. Newman. The spatial structure of networks. The European Physical Journal B, 49:247, 2006.
- [19] S. Boccaletti, V. Latora, Y. Moreno, M. Chaves, and D.-U. Hwang. Complex networks: structure and dynamics. Physics Reports, 424:175–308, 2006.
- [20] L. da F. Costa, F.A. Rodrigues, and G. Travieso. Analyzing trails in complex networks. Physical Review E, 76(4):46106, 2007.
- [21] R. Albert and A.-L. Barabási. Statistical mechanics of complex networks. Reviews of Modern Physics, 74:48–98, 2002.
- [22] S. N. Dorogovtsev and J. F. F. Mendes. Evolution of networks. Advances in Physics, 51:1079–1187, 2002.
- [23] M. E. J. Newman. Structure and function of complex networks. SIAM Review, 45(2):167–256, 2003.
- [24] L. da F. Costa, F. A. Rodrigues, G. Travieso, and P. R. Villas Boas. Characterization of complex networks: A survey of measurements. Advances in Physics, 56(1):167 – 242, 2007.
- [25] S. Strogatz. Sync: The Emerging Science of Spontaneous Order. Hyperion, 2003.
- [26] L. da F. Costa and M. S. Barbosa. An analytical approach to connectivity in regular neuronal networks. European Physical Journal B, 42:573–580, 2004.
- [27] O. Sporns, D. R. Chialvo, M. Kaiser, and C. C. Hilgetag. Organization, development and function of complex brain networks. Trends Cogn Sci, 8(9):418–25, 2004.
- [28] L. da F. Costa, O. Sporns, L. Antiqueira, M. G. V. Nunes, and O. N. Oliveira Jr. Correlations between structure and random walk dynamics in directed complex networks. Applied Physics Letters, 91:054107, 2007.
- [29] L. da F. Costa and F. A. Rodrigues. Superedges: Connecting Structure and Dynamics in Complex Networks. Arxiv preprint arXiv:0801.4068, 2008.
- [30] B. Bollobás. Random graphs. Academic Press, Inc., 1985.
- [31] R. Diestel. Graph Theory. Springer, 2000.
- [32] D. B. West. Introduction to Graph Theory. Prentice Hall, 2001.
- [33] D. J. Watts and S. H. Strogatz. Collective dynamics of small-world networks. Nature, 393(6684):440–442, 1998.
- [34] D. J. Watts. Small Worlds: The Dynamics of Networks between Order and Randomness. Princeton University Press, 2003.
- [35] A. Barrat, M. Barthèlemy, R. Pastor-Satorras, and A. Vespignani. The architecture of complex weighted networks. Proceedings of the National Academy of Science USA, 101(11):3747–52, 2004.
- [36] M. E. J. Newman. Assortative mixing in networks. Physical Review Letters, 89(20):208701, 2002.
- [37] M. E. J. Newman. Detecting community structure in networks. The European Physical Journal B, 38:321–330, 2004.
- [38] M. Girvan and M. E. J. Newman. Community structure in social and biological networks. Proceedings of the National Academy of Science USA, 99(12):7821–7826, 2002.
- [39] L. Danon, J. Duch, A. Arenas, and A. A. Díaz-Guilera. Comparing community structure identification. Journal of Statistical Mechanics: Theory and Experiment, page P09008, 2005.
- [40] R. Milo, S. Shen-Orr, S. Itzkovitz, N. Kashtan, D. Chklovskii, and U. Alon. Network Motifs: Simple Building Blocks of Complex Networks. Science, 298(5594):824, 2002.
- [41] J. Bagrow, E. Bollt, and L. da F. Costa. Network Structure Revealed by Short Cycles. Arxiv preprint cond-mat/0612502, 2006.
- [42] P.R. Villas Boas, F. A. Rodrigues, G. Travieso, and L. da F. Costa. Chain motifs: The tails and handles of complex networks. Physical Review E, 77(2):26106, 2008.
- [43] S. S. Shen-Orr, R. Milo, S. Mangan, and U. Alon. Network motifs in the transcriptional regulation network of Escherichia coli. Nature Genetics, 31(1):64–68, 2002.
- [44] P.R. Villas Boas, F.A. Rodrigues, G. Travieso, and L. da F. Costa. Border trees of complex networks. Arxiv preprint arXiv:0706.3403, 2007.
- [45] P. R. Villas Boas, F. A. Rodrigues, G. Travieso, and L. da F. Costa. Sensitivity of complex networks measurements. eprint arXiv: 0804.1104, 2008.
- [46] L. da F. Costa and F. A. Rodrigues. Seeking for Simplicity in Complex Networks. Arxiv preprint physics/0702102v2, 2008.
- [47] M. Barahona and L.M. Pecora. Synchronization in Small-World Systems. Physical Review Letters, 89(5):54101, 2002.
- [48] H. Hong, MY Choi, and B.J. Kim. Synchronization on small-world networks. Physical Review E, 65(2):26139, 2002.
- [49] D. Volchenkov, L. Volchenkova, and Ph. Blanchard. Epidemic spreading in a variety of scale free networks. Physical Review E, 66(4):046137–046146, 2002.
- [50] M. Boguñá and R. Pastor-Satorras. Epidemic spreading in correlated complex networks. Physical Review E, 66(4):047104–047107, 2002.
- [51] L. da F. Costa and G. Travieso. Exploring complex networks through random walks. Physical Review E, 75(1):16102, 2007.
- [52] L. da F. Costa. Synchronization of Non-Linear Random Walk Dynamics in Complex Network. Arxiv preprint arXiv:0801.2520, 2008.
- [53] L. da F. Costa. Random and Longest Paths: Unnoticed Motifs of Complex Networks. Arxiv preprint arXiv:0712.0415, 2007.
- [54] L. P. Chi and X. Cai. Structural changes caused by error and attack tolerance in us airport network. International Journal of Modern Physics B, 18:17–19, 2004.
- [55] P. Holme, B. J. Kim, C. N. Yoon, and S. K. Han. Attack vulnerability of complex networks. Physical Review E, 65(5):056109, 2002.
- [56] B. Tadić, G. J. Rodgers, and S. Thurner. Transport on complex networks: Flow, jamming and optimization. International Journal of Bifurcation and Chaos, 17(7):2363–2385, 2007.
- [57] L. da F. Costa. Avalanches of Activation and Spikes in Neuronal Complex Networks. Arxiv preprint arXiv:0802.0421, 2008.
- [58] P. Ormerod and A. P. Roach. The medieval inquisition: scale-free networks and the suppression of heresy. Physica A, 339:645 – 652, 2004.
- [59] P. Ball. The physics of society. Proceedings of the National Academy of Science USA, 415:371, 2002.
- [60] B. Wellman. The school child’s choice of companions. Journal of Educational Research, 14:126–132, 1926.
- [61] H. A. Simon. On a class of skew distribution functions. Biometrika, 42(3/4):425 – 440, 1955.
- [62] D. J. de S. Price. Networks of scientific papers. Science, 149:510 – 515, 1965.
- [63] D. J. de S. Price. A general theory of bibliometric and other cumulative advantage processes. Journal of the American Society for Information Science, 27:292 – 306, 1976.
- [64] L. C. Freeman. A set of measures of centrality based on betweenness. Sociometry, 40:35 – 41, 1977.
- [65] L. C. Freeman. Centrality in social networks: Conceptual clarification. Social Networks, 1:215 –239, 1979.
- [66] S. Milgram. The small world problem. Psychology Today, 2:60 – 67, 1967.
- [67] J. Travers and S. Milgram. An experimental study of the small world problem. Sociometry, 32:425 – 443, 1969.
- [68] D. J. Watts. Six Degrees: The Science of a Connected Age. W. W. Norton and Company, New York, 2003.
- [69] A. Degenne and M. Forsé. Introducing Social Networks. Sage Publications Ltd, London, 1999.
- [70] L. C. Freeman. The Development of Social Network Analysis: A Study in the Sociology of Science. Empirical Press, Vancouver, Canadá, 2004.
- [71] Social network journal, 2007. http://www.elsevier.com/locate/inca/505596.
- [72] F. Liljeros, C. R. Edling, L. A. N. Amaral, H. E. Stanley, and Y. Aaberg. The web of human sexual contacts. Nature, 411(6840):907 – 908, 2001.
- [73] P. Cano, O. Celma, M. Koppenberger, and J.M. Buldú. Topology of music recommendation networks. Chaos: An Interdisciplinary Journal of Nonlinear Science, 16:013107, 2006.
- [74] T. Evans. Physical and relational networks in the aegean bronze age. In European Conference of Complex Systems - ECCS’06, 2006.
- [75] C. Knappett, T. Evans, and R. Rivers. Modelling maritime interaction in the aegean bronze age. accepted for publication in Antiquity, 2008.
- [76] J. D. Watts. A twenty-first century science. Nature, 445:489, 2007.
- [77] B. Wellman. Computer networks as social networks. Science, 293:2031 – 2034, 2001.
- [78] Second life.
- [79] M. C. González and A-L. Barabási. From data to models. Nature, 3:224 – 225, 2007.
- [80] X. Guardiola, A. Guimerà, R. Arenas, A. Diaz-Guilera, D. Streib, and L. A. N. Amaral. Macro- and micro-structure of trust networks, 2002. arXiv:cond-mat/0206240.
- [81] M. Boguñá, R. Pastor-Satorras, A. Díaz-Guilera, and A. Arenas. Models of social networks based on social distance attachment. Physical Review E, 70:056122, 2004.
- [82] R. Guimerà, L. Danon, A. Díaz-Guilera, F. Giralt, and A. Arenas. Self-similar community structure in a network of human interactions. Physical Review E, 68(6):65103, 2003.
- [83] W. Bachnik, S. Szymczyk, P. Leszczynski, R. Podsiadlo, E. Rymszewicz, L. Kurylo, D. Makowiec, and B. Bykowska. Quantitive and sociological analysis of blog networks. Acta Physica Polonica B, 36(10):3179 – 3191, 2005.
- [84] P. Zakharov. Thermodynamic approach for community discovering within the complex networks: Livejournal study, 2006. arXiv:physics/0602063.
- [85] S. Valverde, G. Theraulaz, J. Gautrais, V. Fourcassie, and R. V. Solé. Emergent behaviour in agent networks: self-organization in wasp and open source communities. IEEE Intelligent Systems, 2006.
- [86] D. Lusseau. The emergent properties of a dolphin social network. Proceedings - Royal Society of London. Biological sciences, 270:186 – 188, 2003.
- [87] A.-L. Barabási and R. Albert. Emergence of scaling in random networks. Science, 286:509, 1999.
- [88] L. A. N. Amaral, A. Scala, M. Barthèlemy, and H. E. Stanley. Classes of small-world networks. Proceedings of the National Academy of Science USA, 97(21):11149 – 11152, 2000.
- [89] P.P. Zhang, K. Chen, Y. He, T. Zhou, B.B. Su, Y. Jin, H. Chang, Y.P. Zhou, L.C. Sun, B.H. Wang, and D.R. He. Model and empirical study on some collaboration networks. Physica A: Statistical Mechanics and its Applications, 360(2):599–616, 2006.
- [90] P. S. Dodds, R. Muhamad, and D. J. Watts. An experimental study of search in global social networks. Science, 301(8):827 – 829, 2003.
- [91] J-P. Onnela, J. Saramäki, J. Hyvönen, G. Szabó, M. A. de Menezes, K. Kaski, A-L. Barabási, and J. Kertész. Analysis of a large-scale weighted network of one-to-one human communication. New Journal of Physics, 9:179, 2007.
- [92] J-P. Onnela, J. Saramäki, J. Hyvönen, G. Szabó, D. Lazer, K. Kaski, J. Kertész, and A-L. Barabási. Structure and tie strengths in mobile communication networks. Proceedings of the National Academy of Science USA, 104(18):7332 – 7336, 2007.
- [93] P. Holme, S. M. Park, B. J. Kim, and C. R. Edling. Korean university life in a network perspective: Dynamics of a large affiliation network. Physica A, 373:821 – 830, 2007.
- [94] M. C. González, H. J. Herrmann, J. Kertész, and T. Vicsek. Community structure and ethnic preferences in school friendship networks. Physica A: Statistical Mechanics and its Applications, 379(1):307–316, 2007.
- [95] A. Arenas, L. Danon, A. Diaz-Guilera, P. M. Gleiser, and R. Guimerà. Community analysis in social networks. The European Physical Journal B, 38:373 – 380, 2004.
- [96] S. Lozano, A. Arenas, and A. Sánchez. Mesoscopic structure conditions the emergence of cooperation on social networks. PLoS ONE, 3:e1892, 2008.
- [97] J. H. Jones and M. S. Handcock. An assessment of preferential attachment as a mechanism for human sexual network formation. Proceedings of the Royal Society of London B, page 1027, 2003.
- [98] F. Liljeros. Sexual networks in contemporary western societies. Physica A, 338:238 – 245, 2004.
- [99] P. Ormerod and A. P. Roach. Network of sexual contacts and sexually transmitted hiv infection in burkina faso. Journal of Medical Virology, 78:724 – 729, 2006.
- [100] M. C. González, P. G. Lind, and H. J. Herrmann. Model of mobile agents for sexual interactions networks. European Physical Journal B, 49(3):371 – 376, 2006.
- [101] B. F. Blasio, A. Svensson, and F. Liljeros. Preferential attachment in sexual networks. Proceedings of the National Academy of Science USA, 104(26):10762 – 10767, 2007.
- [102] T. Britton, M.K. Nordvik, and F. Liljeros. Modelling sexually transmitted infections: The effect of partnership activity and number of partners on . Theoretical Population Biology, 72(3):389–399, 2007.
- [103] M. S. Handcock and J. H. Jones. Likelihood-based inference for stochastic models of sexual network formation. Theoretical Population Biology, 65:413 – 422, 2004.
- [104] P. Holme, C. R. Edling, and F. Liljeros. Structure and time evolution of an Internet dating community. Social Networks, 26(2):155–174, 2004.
- [105] J. Park and M. E. J. Newman. A network-based ranking system for us college football. Journal of Statistical Mechanics: Theory and Experiment, page 10014, 2005.
- [106] R. N. Onody and P. A. de Castro. Complex network study of brazilian soccer players. Physical Review E, 70(3):37103, 2004.
- [107] P. M. Gleiser. How to become a superhero. Journal of Statistical Mechanics: Theory and Experiment, 2007(09):P09020, 2007.
- [108] R. Alberich, J. Miro-Julia, and F. Rosselló. Marvel universe looks almost like a real social network. e-print arXiv:cond-mat/0202174, 2002.
- [109] X. Xu, L. Yang, and F. Liu. Structure of the cross-talk collaboration network of China. Physica A: Statistical Mechanics and its Applications, 376:738–746, 2007.
- [110] P. M. Gleiser and L. Danon. Community structure in jazz. Advances in Complex Systems, 6, 2003.
- [111] R. D. Smith. The network of collaboration among rappers and its community structure. Journal of Statistical Mechanics: Theory and Experiment, 2006.
- [112] A. Clauset, M. E. J. Newman, and C. Moore. Finding community structure in very large networks. Physical Review E, 70:066111, 2004.
- [113] G. Palla, I. Derényi, I. Farkas, and T. Vicsek. Uncovering the overlapping community structure of complex networks in nature and society. Nature, 435(7043):814–818, 2005.
- [114] J. Park, O Celma, M. Koppenberger, P. Cano, and J. M. Buldú. The social network of contemporary popular musicians, 2007.
- [115] R. Lambiotte and M. Ausloos. Uncovering collective listening habits and music genres in bipartite networks. Physical Review E, 72:066107, 2005.
- [116] R. Lambiotte and M. Ausloos. On the genre-fication of music: a percolation approach. The European Physical Journal B, 50:183 – 188, 2006.
- [117] D. de L. Silva, M. M. Soares, M. V. C. Henriques, M. T. S. Alves, S. G. de Aguiar, T. P. de Carvalho, G. Corso, and L. S. Lucena. The complex network of the brazilian popular music. Physica A, 332:559 – 565, 2004.
- [118] M. E. J. Newman. Scientific collaboration networks. I. Network construction and fundamental results. Physical Review E, 64(1):16131, 2001.
- [119] C. Cotta and J. J. Merelo. The complex network of evolutionary computation authors: an initial study, 2005. arXiv:physics/0507196.
- [120] R. Lambiotte and M. Ausloos. N-body decomposition of bipartite author networks. Physical Review E, 72:066117, 2005.
- [121] A. L. Barabási, H. Jeong, Z. Néda, E. Ravasz, A. Schubert, and T. Vicsek. Evolution of the social network of scientific collaborations. Physica A: Statistical Mechanics and its Applications, 311(3-4):590 – 614, 2002.
- [122] J. Moody. The structure of a social science collaboration network: Disciplinary cohesion from 1963 to 1999. American sociological review, 69:213 – 238, 2004.
- [123] M. Ausloos and R. Lambiotte. Drastic events make evolving networks. The European Physical Journal B, 57(1), 2007.
- [124] M. E. J. Newman. Scientific collaboration networks. II. Shortest paths, weighted networks, and centrality. Physical Review E, 64(1):16132, 2001.
- [125] F. N. Silva, M. A. Rodrigues, and L. da F. Costa. Concentric Characterization and Classification of Complex Network Nodes: Theory and Application to Institutional Collaboration. Arxiv preprint arXiv:0710.1857, 2007.
- [126] M. Li, Y. Fan, J. Chen, L. Gao, Z. Di, and J. Wu. Weighted networks of scientific communication: the measurement and topological role of weight. Physica A, 350:643 – 656, 2005.
- [127] Y. Fan, M. Li, J. Chen, L. Gao, Z. Di, and J. Wu. Network of econophysicists: a weighted network to investigate the development of econophysics. International Journal of Modern Physics B, 18(17 - 19):2505 – 2512, 2004.
- [128] P. Zhang, M. Li, J. Wu, Z. Di, and Y. Fan. The community structure of econophysicist collaboration networks, 2005. arXiv:physics/0505064.
- [129] Y-M. Choi and H-J. Kim. A directed network of greek and roman mythology. Physica A, 382:665 – 671, 2007.
- [130] J. Liu, Y. Dang, and Z. Wang. Complex network properties of chinese natural science basic research. Physica A: Statistical Mechanics and its Applications, 366:578 – 586, 2006.
- [131] M. J. Barber, A. Krueger, T. Krueger, and T. Roediger-Schluga. Network of european union-funded collaborative research and development projects. Physical Review E, 73:036132, 2006.
- [132] S. Lozano, J. Duch, and A. Arenas. Community detection in a large social dataset of european projects. Maryland, April 2006. Sixth SIAM - International Conference on Data Mining.
- [133] M. A. Porter, P. J. Friend, A. J. Mucha, and M. E. J. Newman. Community structure in the united states house of representatives. Chaos, 16:041106, 2006.
- [134] D. Braha and Y. Bar-Yam. Topology of large-scale engineering problem-solving networks. Physical Review E, 69(1):16113, 2004.
- [135] D. Braha and Y. Bar-Yam. Smart Business Networks, chapter Information flow structure in large-scale product development organizational networks. Springer Verlag, 2005.
- [136] D. Braha and Y. Bar-Yam. The statistical mechanics of complex product development: empirical and analytical results. Management Science, 53(7):1127 – 1145, 2007.
- [137] P.S. Keila and D.B. Skillicorn. Structure in the Enron Email Dataset. Computational & Mathematical Organization Theory, 11(3):183–199, 2005.
- [138] H. Ebel, L.I. Mielsch, and S. Bornholdt. Scale-free topology of e-mail networks. Physical Review E, 66(3):35103, 2002.
- [139] J. R. Tyler, D. M. Wilkinson, and B. A. Huberman. Email as spectroscopy: Automated discovery of community structure within organizations. Communities and Technologies, 2003.
- [140] J. Wang and P. De Wilde. Properties of evolving e-mail networks. Physical Review E, 70(6):66121, 2004.
- [141] M. E. J. Newman, S. Forrest, and J. Balthrop. Email networks and the spread of computer viruses. Physical Review E, 66(3):35101, 2002.
- [142] D. Braha and Y. Bar-Yam. From centrality to temporary fame: Dynamic centrality in complex networks. Complexity, 12(2):59–63, 2006.
- [143] C. C. Zou and D. W. Gong. Email worm modeling and defense. Computer Communications and Networks, 2004. ICCCN 2004. Proceedings. 13th International Conference on, pages 409–414, 2004.
- [144] J. Zhang and M. Van Alstyne. EmailNet: A System for Automatically Mining Social Networks from Organizational Email Communications. North American Association for Computational Social and Organizational Science (NAACSOS), Pittsburgh, 2003.
- [145] B. Hayes. Graph theory in practice: Part I. American Scientist, 88:9–13, 2000.
- [146] William Aiello, Fan Chung, and Linyuan Lu. A random graph model for massive graphs. In STOC ’00: Proceedings of the thirty-second annual ACM symposium on Theory of computing, pages 171–180, New York, NY, USA, 2000. ACM.
- [147] A.A. Nanavati, S. Gurumurthy, G. Das, D. Chakraborty, K. Dasgupta, S. Mukherjea, and A. Joshi. On the structural properties of massive telecom call graphs: Findings and implications. In CIKM ’06: Proceedings of the 15th ACM international conference on Information and knowledge management, pages 435–444, New York, NY, USA, 2006. ACM.
- [148] M.S. Granovetter. The Strength of Weak Ties. American Journal of Sociology, 78(6):1360, 1973.
- [149] R. Lambiotte, V.D. Blondel, C. de Kerchove, E. Huens, C. Prieur, Z. Smoreda, and P. Van Dooren. Geographical dispersal of mobile communication networks. Arxiv preprint arXiv:0802.2178, 2008.
- [150] V.D. Blondel, J.L. Guillaume, R. Lambiotte, and E. Lefebvre. Fast unfolding of community hierarchies in large networks. Arxiv preprint arXiv:0803.0476, 2008.
- [151] Y. Xia, C.K. Tse, W.M. Tam, F.C.M. Lau, and M. Small. Scale-free user-network approach to telephone network traffic analysis. Physical Review E, 72(2):26116, 2005.
- [152] M. C. González, C. A. Hidalgo, and A.-L. Barabási. Understanding individual human mobility patterns. Nature, 453(7196):779, 2008.
- [153] D. Brockmann, L. Hufnagel, and T. Geisel. Main navigation. Nature, 439:462–465, 2006.
- [154] W. Hsu and A. Helmy. IMPACT: Investigation of Mobile-user Patterns Across university Campuses using WLAN Trace analysis. arxiv:cs/0508009v1, 2005.
- [155] W. Hsu and A. Helmy. On nodal encounter patterns in wireless lan traces. In 4th International Symposium on Modeling and Optimization in Mobile, Ad Hoc and Wireless Networks, pages 1–10. IEEE, 2006.
- [156] S. Goyal. Connections: An Introduction to the Economics of Networks. Princeton University Press, 2007.
- [157] M. Serrano, M. A. andBoguñá. Topology of the world trade web. Physical Review E, 68(1):015101–015104, 2003.
- [158] A. Ausloos and R. Lambiotte. Clusters or networks of economies? a macroeconomy study through gross domestic product. Physica A, 382(1):16–21, 2006.
- [159] J. Miśkiewicz and M. Ausloos. G7 country gross domestic product (gdp) time correlations. a graph network analysis. Practical Fruits of Econophysics, 5:312–316, 2006.
- [160] M. Gligor and A. Ausloos. Clusters in weighted macroeconomic networks: the eu case. introducing the overlapping index of gdp/capita fluctuation correlations. The European Physical Journal B, 63(4):533–539, 2008.
- [161] X. Li, Y. Y. Jin, and G. Chen. On the topology of the world exchange arrangements web. Physica A: Statistical Mechanics and its Applications, 343(-):573–582, 2004.
- [162] A. Z. Górski, S. Drożdż, J. Kwapień, and P. Oświęcimka. Complexity characteristics of currency networks. Acta Physica Polonica B, 37(11):2897–2906, 2006.
- [163] J. S. Andrade Jr., D. M. Bezerra, J. Ribeiro Filho, and A. A. Moreira. The complex topology of chemical plants. Physica A: Statistical Mechanics and its Applications, 360(2):637–643, 2006.
- [164] W. Souma, Y. Fujiwara, and H. Aoyama. Small-world effects in wealth distribution, 2001. arXiv:cond-mat/0108482.
- [165] T. Di Matteo, T. Aste, and S. T. Hyde. Exchanges in complex networks: income and wealth distributions, 2003. arXiv:cond-mat/0310544.
- [166] R. Baggio. Complex systems, information technologies and tourism: a network point of view. Information Technology and Tourism, 8(1):15–29, 2006.
- [167] R. Baggio. Symptoms of complexity in a tourism system, 2008.
- [168] N. Scott, C. Cooper, and R. Baggio. Use of network analysis in tourism research. In Proceedings of the Advances in Tourism Marketing Conference (ATMC), Valencia, Spain, September 2007.
- [169] R. Baggio. The web graph of a tourism system. Physica A: Statistical Mechanics and its Applications, 379(2):727–734, 2007.
- [170] N. Scott, C. Cooper, and R. Baggio. Destination Networks Four Australian Cases. Annals of Tourism Research, 35(1):169–188, 2008.
- [171] R. Baggio and M. A. Corigliano. Tourism destinations: a network analysis of the web space. In Proceedings of the Advances in Tourism Marketing Conference (ATMC), Valencia, Spain, September 2007.
- [172] N. Scott, C. Cooper, and R. Baggio. Network Analysis and Tourism: From Theory to Practice. Channel View, Clevedon, UK, 2008.
- [173] L. da F. Costa and R. Baggio. The web of connections between tourism companies in elba: Structure and dynamics, 2008. arXiv:0803.2510.
- [174] R. N. Mantegna. Hierarchical structure in financial markets. European Physical Journal B, 11:193–197, 1999.
- [175] G. Bonanno, G. Caldarelli, F. Lillo, and R. N. Mantegna. Topology of correlation-based minimal spanning trees in real and model markets. Physical Review E, 68(4):046130, 2003.
- [176] J.-P. Onnela, A. Chakraborti, K. Kaski, J. Kertész, and A. Kanto. Dynamics of market correlations: Taxonomy and portfolio analysis. Physical Review E, 68(5):056110, 2003.
- [177] J.-P. Onnela, A. Chakraborti, K. Kaski, J. Kertész, and A. Kanto. Asset trees and asset graphs in financial markets. Physica Scripta, T106:48–54, 2003.
- [178] J.-P. Onnela, K. Kaski, and J. Kertész. Clustering and information in correlation based financial networks. European Physical Journal B, 38(2):353–362, 2004.
- [179] R. K. Pan and S. Sinha. Collective behavior of stock price movements in an emerging market. Physical Review E, 76(4):46116, 2007.
- [180] S. Battiston, J. F. Rodrigues, and H. Zeytinoglu. The network of inter-regional direct investment stocks across Europe. Advances in Complex Systems, 10(1):29–51, 2007.
- [181] D. Garlaschelli, S. Battiston, M. Castri, V. D.P. Servedio, and G. Caldarelli. The scale-free topology of market investments. Physica A, 350(2-4):491–499, 2005.
- [182] W. Souma, Y. Fujiwara, and H. Aoyama. Change of ownership networks in Japan, 2005. arXiv:physics/0504045.
- [183] R.K. Pan and S. Sinha. Collective behavior of stock price movements in an emerging market. Physical Review E, 76(4):46116, 2007.
- [184] A. V. Aho and J. D. Ullman. Foundations of computer science. Computer Science Press, Inc. New York, NY, USA, 1992.
- [185] P. J. Denning. Computer Science: The Discipline. Encyclopedia of Computer Science, 2000.
- [186] P. Bishop. Computing Science. Nelson, 1991.
- [187] S. Valverde, R. Ferrer i Chanco, and R. V. Solé. Scale-free networks from optimal design. Europhysics Letters, 60(4):512–517, 2002.
- [188] A. P. S. de Moura, Y. C. Lai, and A. E. Motter. Signatures of small-world and scale-free properties in large computer programs. Physical Review E, 68(1):017102, 2003.
- [189] S. Valverde and R. V. Solé. Hierarchical small worlds in software architecture, 2003. arXiv:cond-mat/0307278.
- [190] C. R. Myers. Software systems as complex networks: Structure, function, and evolvability of software collaboration graphs. Physical Review E, 68(4):046116–046130, 2003.
- [191] D. Challet and A. Lombardoni. Bug propagation and debugging in asymmetric software structures. Physical Review E, 70(4):046109–046113, 2004.
- [192] Y. Ma, K. He, and D. Du. A qualitative method for measuring the structural complexity of software systems based on complex networks. In Software Engineering Conference, 2005. APSEC ’05. 12th Asia-Pacific, pages 257–263, 2005.
- [193] N. LaBelle and E. Wallingford. Inter-package dependency networks in open-source software, 2006.
- [194] A. Iamnitchi, M. Ripeanu, and I. Foster. Locating data in (small-world?) peer-to-peer scientific collaborations. Lecture Notes in Computer Science, 2429:232–241, 2002.
- [195] A. Iamnitchi, M. Ripeanu, and I. Foster. Data-sharing relationships in the Web. In Proceedings of the Twelfth International World Wide Web Conference (WWW12), 2003.
- [196] A. Iamnitchi, M. Ripeanu, and I. Foster. Small-world file-sharing communities. INFOCOM 2004. Twenty-third Annual Joint Conference of the IEEE Computer and Communications Societies, 2:952–963, 2004.
- [197] N. Leibowitz, M. Ripeanu, and A. Wierzbicki. Deconstructing the Kazaa network. In Proceedings of the The Third IEEE Workshop on Internet Applications, pages 112–120, 2003.
- [198] M. Ripeanu, I. Foster, and A. Iamnitchi. Mapping the gnutella network: Properties of large-scale peer-to-peer systems and implications for system design. IEEE Internet Computing, 6:50–57, 2002.
- [199] J.-L. Guillaume and S. Le-Blond. Statistical properties of exchanges in P2P systems. In Proceedings of the International Conference on Parallel and Distributed Processing Techniques and Applications, volume 3, pages 1423–1428, 2004.
- [200] J. S. Kong, P. O. Boykin, B. A. Rezaei, N. Sarshar, and V. P. Roychowdhury. Let your cyberalter ego share information and manage spam, 2005. arXiv:physics/0504026.
- [201] R. Ferrer i Cancho, C. Janssen, and R. V. Solé. Topology of technology graphs: Small world patterns in electronic circuits. Physical Review E, 64(4):046119–046123, 2001.
- [202] A.-L. Barabási, M. A. de Menezes, S. Balensiefer, and J. Brockman. Hot spot and universality in networks dynamics. The European Physical Journal B, 38(2):169–175, 2004.
- [203] C. Teuscher. On irregular interconnect fabrics for self-assembled nanoscale electronics, 2006. arXiv:cond-mat/060658.
- [204] L. da F. Costa and R. M. Cesar Jr. Shape Analysis and Classification: Theory and Practice. CRC Press, 2001.
- [205] L. da F. Costa. Complex Networks, Simple Vision. Arxiv preprint cond-mat/0403346, 2004.
- [206] F. A. Rodrigues, G. Travieso, and L. da F. Costa. Fast Community Identification by Hierarchical Growth. International Journal of Modern Physics C, 18(06):937–947, 2007.
- [207] A. R. Backes, D. Casanova, and O. M. Bruno. A complex network-based approach for boundary shape analysis. Pattern Recognition, accepted, 2008.
- [208] T. Chalumeau, L. da F. Costa, O. Laligant, and F. Meriaudeau. Optimized texture classification by using hierarchical complex networks. In roceedings of Spie Conference on Machine Vision Applications in Industrial Inspection XIV, volume 6070, San Jose, California, 2006. IS&T/SPIE 18th Annual Symposium on Electronic Imaging.
- [209] C. J. P. Moschovitis, H. Poole, T. Schuyler, and T. M. Senft. History of the Internet: A Chronology, 1843 to the Present. ABC-Clio Inc, Santa Barbara, CA, 1999.
- [210] Q. Chen, H. Chang, R. Govindan, S. Jamin, S. J. Shenker, and W. Willinger. The origin of power laws in internet topologies revisited. In Proceedings of the 21st Annual Joint Conference of the IEEE Computer and Communications Societies,. IEEE Computer Society, 2002.
- [211] G. Siganos, M. Faloutsos, P. Faloutsos, and C. Faloutsos. Power laws and the AS-level internet topology. IEEE/ACM Transactions on Networking (TON), 11(4):514–524, 2003.
- [212] R. Pastor-Satorras, A. Vázquez, and A. Vespignani. Dynamical and correlation properties of the internet. Physical Review Letters, 87(25):258701, 2001.
- [213] A. Vázquez, R. Pastor-Satorras, and A. Vespignani. Large-scale topological and dynamical properties of the internet. Physical Review E, 65:066130, 2002.
- [214] G. Caldarelli, R. Marchetti, and L. Pietronero. The fractal properties of Internet. Europhysics Letters, 52(4):386–391, 2000.
- [215] S. Maslov, K. Sneppen, and A. Zaliznyak. Detection of topological patterns in complex networks: Correlation profile of the internet. Physica A, 333:529–540, 2004.
- [216] G. Bianconi. The entropy of randomized network ensembles. Europhysics Letters, 81(2):28005, 2008.
- [217] G. Bianconi. Number of cycles in off-equilibrium scale-free networks and in the Internet at the Autonomous System level. European Physical Journal B, 38(2):223–230, 2004.
- [218] S. Zhou and R. J. Mondragón. The rich-club phenomenon in the internet topology. Communications Letters, IEEE, 8(3):180–182, 2004.
- [219] J.J. McAuley, L. da F. Costa, and T.S. Caetano. Rich-club phenomenon across complex network hierarchies. Applied Physics Letters, 91:084103, 2007.
- [220] S. Carmi, S. Havlin, S. Kirkpatrick, Y. Shavitt, and E. Shir. MEDUSA - new model of internet topology using k-shell decomposition. In Proceedings of the International Conference on Network Science, 2006.
- [221] S. Carmi, S. Havlin, S. Kirkpatrick, Y. Shavitt, and E. Shir. A model of Internet topology using k-shell decomposition. Proceedings of the National Academy of Sciences, 104(27):11150–11154, 2007.
- [222] DIMES - Distributed Internet MEasurements and Simulations. http://www.netdimes.org.
- [223] K. A. Eriksen, I. Simonsen, S. Maslov, and K. Sneppen. Modularity and extreme edges of the internet. Physical Review Letters, 90(14):148701, 2003.
- [224] V. Rosato, L. Issacharoff, S. Meloni, D. Caligiore, and F. Tiriticco. Is the topology of the internet network really fit to sustain its function? Physica A, 387(7):1689–1704, 2008.
- [225] V. Latora and M. Marchiori. Efficient behavior of small-world networks. Physics Review Letters, 87:198701, 2001.
- [226] M. A. Menezes and A.-L. Barabási. Fluctuations in network dynamics. Physical Review Letters, 92:028701, 2004.
- [227] M. A. Menezes and A.-L. Barabási. Separating internal and external dynamics of complex systems. Physical Review Letters, 93:068701, 2004.
- [228] J. Duch and A. Arenas. Scaling of fluctuations in traffic on complex networks. Physical Review Letters, 96(21):218702, 2006.
- [229] M. Barthèlemy, B. Gondran, and E. Guichard. Large scale cross-correlations in internet traffic. Physical Review E, 66(5):056110, 2002.
- [230] R. Percacci and A. Vespignani. Scale-free behavior of the internet global performance. European Physical Journal B, 32(4):411–414, 2003.
- [231] S. Valverde and R. V. Solé. Internet’s critical path horizon. European Physical Journal B, 38(2):245–252, 2004.
- [232] D.-H. Kim and A. E. Motter. Fluctuation-driven capacity distribution in complex networks. New Journal of Physics, 10:053022, 2008.
- [233] D.-H. Kim and A. E. Motter. Resource allocation pattern in infrastructure networks. Journal of Physics A, 41(22):224019, 2008.
- [234] P. Echenique, J. Gómez-Gardeñes, and Y. Moreno. Improved routing strategies for Internet traffic delivery. Physical Review E, 70:056105, 2004.
- [235] D. Krioukov, k. claffy, K. Fall, and A. Brady. On compact routing for the internet. ACM SIGCOMM Computer Communication Review (CCR), 37(3):41–52, 2007.
- [236] M. Bogu ná, D. Krioukov, and K. Claffy. Navigability of complex networks, 2007. arXiv:0709.0303.
- [237] H. P. Thadakamalla, R. Albert, and S. R. T. Kumara. Search in spatial scale-free networks. New Journal of Physics, 9(6):190, 2007.
- [238] F. A. Rodrigues, P. R. V. Boas, G. Travieso, and L. da F. Costa. Seeking the best Internet Model. Arxiv preprint arXiv:0706.3225, 2007.
- [239] S.-H. Yook, H. Jeong, and A.-L. Barabási. Modeling the internet’s large-scale topology. Proceedings of the National Academy of Sciences, 99(21):13382–13386, 2002.
- [240] J. Park and M. E. J. Newman. Origin of degree correlations in the internet and other networks. Physical Review E, 68:026112, 2003.
- [241] V. Rosato and F. Tiriticco. Growth mechanisms of the as-level internet network. Europhysics Letters, 66(4):471–477, 2004.
- [242] P. Holme and B. J. Kim. Growing scale-free networks with tunable clustering. Physical Review E, 65:026107, 2002.
- [243] S. Zhou and R. J. Mondragón. Accurately modeling the internet topology. Physical Review E, 70(6):066108, 2004.
- [244] S. Zhou. Understanding the evolution dynamics of internet topology. Physical Review E, 74(1):016124, 2006.
- [245] M. A. Serrano, M. Bogu ná, and A. Díaz-Guilera. Modeling the Internet. European Physical Journal B, 50(1-2):249–254, 2006.
- [246] T. Berners-Lee, W. Hall, J. Hendler, N. Shadbolt, and D. J. Weitzner. Creating a science of the Web. Science, 313(5788):769–771, 2006.
- [247] S. Lawrence and C. L. Giles. Accessibility of information on the web. Nature, 400:107–109, 1999.
- [248] A.-L. Barabási, R. Albert, and H. Jeong. Scale-free characteristics of random networks: the topology of the World Wide Web. Physica A, 281:69–77, 2000.
- [249] A. Broder, R. Kumar, F. Maghoul, P. Raghavan, S. Rajagopalan, R. Stata, A. Tomkins, and J. Wiener. Graph structure in the web. Computer Networks, 33:309–320, 2000.
- [250] D. Donato, L. Laura, S. Leonardi, and S. Millozzi. Large scale properties of the Webgraph. European Physical Journal B, 38(2):239–243, 2004.
- [251] D. M. Pennock, G. W. Flake, S. Lawrence, E. J. Glover, and C. L. Giles. Winners don’t take all: Characterizing the competition for links on the web. Proceedings of the National Academy of Science USA, 99(8):5207–5211, 2002.
- [252] B. A. Huberman and L. A. Adamic. Growth dynamics of the World-Wide Web. Nature, 401:131, 1999.
- [253] C. Song, S. Havlin, and H. A. Makse. Self-similarity of complex networks. Nature, 433:392–395, 2005.
- [254] S. Brin and L. Page. The anatomy of a large-scale hypertextual web search engine. Computer Networks and ISDN Systems, 30:107–117, 1998.
- [255] L. A. Adamic. The small world web. In Proceedings of the 3rd European Conf. Research and Advanced Technology for Digital Libraries, ECDL, pages 443–452, 1999.
- [256] G. Bianconi, N. Gulbahce, and A. E. Motter. Local structure of directed networks. Physical Review Letters, 100(11):118701, 2008.
- [257] G. Caldarelli, R. Pastor-Satorras, and A. Vespignani. Structure of cycles and local ordering in complex networks. European Physical Journal B, 38(2):183–186, 2004.
- [258] G. W. Flake, S. Lawrence, C. L. Giles, and F. Coetzee. Self-organization and identification of web communities. IEEE Computer, 35(3):66–71, 2002.
- [259] J.-P. Eckmann and E. Moses. Curvature of co-links uncovers hidden thematic layers in the world wide web. Proceedings of the National Academy of Science USA, 99(9):5825–5829, 2002.
- [260] F. Fu, L. Liu, K. Yang, and L. Wang. The structure of self-organized blogosphere, 2006. arXiv:math.ST/0607361.
- [261] R. Milo, S. Itzkovitz, N. Kashtan, R. Levitt, S. Shen-Orr, I. Ayzenshtat, M. Sheffer, and U. Alon. Superfamilies of evolved and designed networks. Science, 303:1538–1542, 2004.
- [262] K. Shen and L. Wu. Folksonomy as a complex network, 2005. arXiv:cs.IR/0509072.
- [263] Z. Dezsö, E. Almaas, A. Lukács, B. Rácz, I. Szakadát, and A.-L. Barabási. Dynamics of information access on the web. Physical Review E, 73(6):066132, 2006.
- [264] B. A. Huberman, P. L. T. Pirolli, J. E. Pitkow, and R. M. Lukose. Strong regularities in World Wide Web surfing. Science, 280:95–97, 1998.
- [265] J. M. Kleinberg, R. Kumar, P. Raghavan, S. Rajagopalan, and A. S. Tomkins. The web as a graph: Measurements, models and methods. Lecture Notes in Computer Science, 1627:1–17, 1999.
- [266] S. R. Kumar, P. Raghavan, S. Rajagopalan, and A. Tomkins. Extracting large-scale knowledge bases from the web. In Proceedings of the 25th VLDB Conference, pages 639–650, Edinburgh, 1999.
- [267] R. Kumar, P. Raghavan, S. Rajagopalan, D. Sivakumar, A. Tomkins, and E. Upfal. Stochastic models for the web graph. In Proceedings of the 42st Annual IEEE Symposium on the Foundations of Computer Science, volume 57, 2000.
- [268] S. Bornholdt and H. Ebel. World Wide Web scaling exponent from simon’s 1955 model. Physical Review E, 64:035104, 2001.
- [269] B. Tadić. Dynamics of directed graphs: The World-Wide Web. Physica A, 293:273–284, 2001.
- [270] F. Menczer. Correlated topologies in citation networks and the web. European Physical Journal B, 38(2):211–221, 2004.
- [271] A. Vazquez. Statistics of citation networks. arXiv:cond-mat/0105031, 2001.
- [272] C. Chen and D. Hicks. Tracing knowledge diffusion. Scientometrics, 59(2):199 – 211, 2004.
- [273] A. F. J. van Raan. Reference-based publication networks with episodic memories. Scientometrics, 63(3):549 – 566, 2005.
- [274] S. Redner. How popular is your paper? an empirical study of the citation distribution. The European Physical Journal B, 4:131 – 134, 1998.
- [275] K. B. Hajra and P. Sen. Aging in citation networks. Physica A, 346:44 – 48, 2005.
- [276] S. Bilke and C. Peterson. Topological properties of citation and metabolic networks. Physical Review E, 64:036106, 2001.
- [277] C. Tsallis and M. P. de Albuquerque. Are citations os scientific papers a case of nonextensivity? The European Physical Journal B, 13:777 – 780, 2000.
- [278] I. Hellsten, R. Lambiotte, A. Scharnhorst, and M. Ausloos. Self-citations, co-authorships and keywords: A new approach to scientists’ field mobility? Scientometrics, 72:469 – 486, 2007.
- [279] M. Ausloos, R. Lambiotte, A. Scharnhorst, and I. Hellsten. Andrzej pekalski networks of scientific interests with internal degrees of freedom through self-citation analysis. arXiv:0710.1800, 2007.
- [280] Y. He, X. Zhu, and D.R. He. Statistics and Developing Model of Chinese Skyway Network. International Journal of Modern Physics B, 18(17-19):2595–2598, 2004.
- [281] W. Li and X. Cai. Statistical analysis of airport network of china. Physical Review E, 69(4):46106, 2004.
- [282] V. Pareto. Cours d’Économie Politique. Pichou, Lausanne, 23, 1897.
- [283] R. Guimerà and L. A. N. Amaral. Modeling the world-wide airport network. European Physical Journal B, 38:381–385, 2004.
- [284] G. Bagler. Analysis of the airport network of india as a complex weighted network, 2004. arXiv:cond-mat/0409773.
- [285] L. E. C. da Rocha. Structural evolution of the brazilian airport network. arXiv:0804.3081, 2008.
- [286] Dong-Hee Kim and Adilson E. Motter. Resource allocation pattern in infrastructure networks. Journal of Physics A: Mathematical and Theoretical, 41(22):224019 (8pp), 2008.
- [287] Dong-Hee Kim and Adilson E Motter. Fluctuation-driven capacity distribution in complex networks. New Journal of Physics, 10(5):053022 (19pp), 2008.
- [288] N. Barnier and P. Brisset. Graph coloring for air traffic flow management. Annals of operations research, 130:163–178, 2004.
- [289] Y. Hayashi. A Review of Recent Studies of Geographical Scale-Free Networks. IPSJ Digital Courier, 2(0):155–164, 2006.
- [290] S. Porta, P. Crucitti, and V. Latora. The network analysis of urban streets: A dual approach. Physica A: Statistical Mechanics and its Applications, 369(2):853–866, 2006.
- [291] V. Kalapala, V. Sanwalani, A. Clauset, and C. Moore. Scale invariance in road networks. Physical Review E, 73:026130, 2006.
- [292] A. Cardillo, S. Scellato, V. Latora, and S. Porta. Structural properties of planar graphs of urban street patterns. Physical Review E, 73(6):066107, 2006.
- [293] M. Rosvall, A. Trusina, P. Minnhagen, and K. Sneppen. Networks and cities: An information perspective. Physical Review Letters, 94(2):28701, 2005.
- [294] B. Hillier and J. Hanson. The social logic of space. Cambridge University Press, 1984.
- [295] K. Sneppen, A. Trusina, and M. Rosvall. Hide-and-seek on complex networks. Europhysics Letters, 69(5):853–859, 2005.
- [296] B.A.N. Travençolo and L. da F. Costa. Outward Accessibility in Urban Street Networks: Characterization and Improvements. Arxiv preprint arXiv:0802.3665, 2008.
- [297] K. Nagel and M. Schreckenberg. A cellular automaton model for freeway traffic. Journal de Physique I France, 2(2):2221–2229, 1992.
- [298] W. Knospe, L. Santen, A. Schadschneider, and M. Schreckenberg. Towards a realistic microscopic description of highway traffic. Journal of Physics A: Mathematical and General, 33(48):L477–L485, 2000.
- [299] D. Helbing. Traffic and related self-driven many-particle systems. Reviews of Modern Physics, 73(4):1067–1141, 2001.
- [300] A. Schadschneider. Traffic flow: a statistical physics point of view. Physica A: Statistical Mechanics and its Applications, 313(1-2):153–187, 2002.
- [301] K. Nagel and J. Esser. Large-scale traffic simulations for transportation planning. Annual Reviews of Computational Physics VII, 7:151–202, 2000.
- [302] A. Schadschneider, W. Knospe, L. Santen, and M. Schreckenberg. Optimization of highway networks and traffic forecasting. Physica A: Statistical Mechanics and its Applications, 346:165–173, 2005.
- [303] P. Sen, S. Dasgupta, A. Chatterjee, P. A. Sreeram, G. Mukherjee, and S. S. Manna. Small-world properties of the indian railway network. Physical Review E, 67(3):36106, 2003.
- [304] K. A. Seaton and L. M. Hackett. Stations, trains and small-world networks. Physica A: Statistical Mechanics and its Applications, 339(3-4):635–644, 2004.
- [305] K. P. Li, Z. Y. Gao, and B. H. Mao. A weighted network model for railway traffic. International Journal of Modern Physics C, 17(9):1339–1347, 2006.
- [306] V. Latora and M. Marchiori. Is the boston subway a small-world network? Physica A: Statistical Mechanics and its Applications, 314:109–113, 2002.
- [307] J. Sienkiewicz and JA Holyst. Public Transport Systems in Poland: From Bialystok to Zielona Góra by Bus and Tram Using Universal Statistics of Complex Networks. Acta Physica Polonica B, 36(5):1771, 2005.
- [308] J. Sienkiewicz and J. A. Holyst. Statistical analysis of 22 public transport networks in poland. Physical Review E, 72(4):46127, 2005.
- [309] C. von Ferber, Y. Holovatch, and V. Palchykov. Scaling in public transport networks, 2005. cond-mat/0501296.
- [310] R. Albert, I. Albert, and G.L. Nakarado. Structural vulnerability of the North American power grid. Physical Review E, 69(2):25103, 2004.
- [311] W.J. Bai, T. Zhou, Z.Q. Fu, Y.H. Chen, X. Wu, and B.H. Wang. Electric power grids and blackouts in perspective of complex networks. Communications, Circuits and Systems Proceedings, 2006 International Conference on, 4, 2006.
- [312] I. Dobson, B. A. Carreras, V. E. Lynch, and D. E. Newman. An initial model fo complex dynamics in electric power system blackouts. System Sciences, 2001. Proceedings of the 34th Annual Hawaii International Conference on, pages 710–718, 2001.
- [313] B. Carreras, V. Lynch, M. Sachtjen, I. Dobson, and D. Newman. Modeling blackout dynamics in power transmission networks with simple structure. In HICSS ’01: Proceedings of the 34th Annual Hawaii International Conference on System Sciences (HICSS-34), page 2018, Washington, DC, USA, 2001. IEEE Computer Society.
- [314] B.A. Carreras, V.E. Lynch, I. Dobson, and D.E. Newman. Critical points and transitions in an electric power transmission model for cascading failure blackouts. Chaos, 12(4):985–994, 2002.
- [315] B. A. Carreras, V. E. Lynch, I. Dobson, and D. E. Newman. Complex dynamics of blackouts in power transmission systems. Chaos: An Interdisciplinary Journal of Nonlinear Science, 14(3):643–652, 2004.
- [316] B. A. Carreras, D. E. Newman, I. Dobson, and A. B. Poole. Evidence for self-organized criticality in a time series of electric power system blackouts. Circuits and Systems I: Regular Papers, IEEE Transactions on, 51(9):1733–1740, 2004.
- [317] D.P. Chassin and C. Posse. Evaluating North American electric grid reliability using the Barabási–Albert network model. Physica A: Statistical Mechanics and its Applications, 355(2-4):667–677, 2005.
- [318] P. Crucitti, V. Latora, and M. Marchiori. A topological analysis of the Italian electric power grid. Physica A: Statistical Mechanics and its Applications, 338(1-2):92–97, 2004.
- [319] K. Sun. Complex Networks Theory: A New Method of Research in Power Grid. Transmission and Distribution Conference and Exhibition: Asia and Pacific, 2005 IEEE/PES, pages 1–6, 2005.
- [320] A. E. Motter and Y.-C. Lai. Cascade-based attacks on complex networks. Physical Review E, 66:065102, 2002.
- [321] P. Crucitti, V. Latora, and M. Marchiori. Model for cascading failures in complex networks. Physical Review E, 69(4):045104, 2004.
- [322] R. Kinney, P. Crucitti, R. Albert, and V. Latora. Modeling cascading failures in the north american power grid. European Physical Journal B, 46:101–107, 2005.
- [323] M. Anghel, K. A. Werley, and A. E. Motter. Stochastic model for power grid dynamics. In HICSS ’07: Proceedings of the 40th Annual Hawaii International Conference on System Sciences, page 113, Washington, DC, USA, 2007. IEEE Computer Society.
- [324] F. S. Collins, E. D. Green, A. E. Guttmacher, and M. S. Guyer. A vision for the future of genomics research. Nature, 422, 2003.
- [325] H. Kitano. Systems Biology: A Brief Overview. Science, 295, 2002.
- [326] B. Vogelstein, D. Lane, and A. J. Levine. Surfing the p53 network. Nature, 408:307–310, 2000.
- [327] Z. N. Oltvai and A.-L. Barabási. Life’s complexity pyramid. Science, 298(5594):763, 2002.
- [328] L. A. N. Amaral and J. M. Ottino. Complex networks. European Physical Journal B, 38:147–162, 2004.
- [329] N. J. Krogan, G. Cagney, H. Yu, G. Zhong, X. Guo, A. Ignatchenko, J. Li, S. Pu, N. Datta, A. P. Tikuisis, T. Punna, J. M. Peregrín-Alvarez, M. Shales, X. Zhang, M. Davey, M. D. Robinson, A. Paccanaro, J. E. Bray, A. Sheung, B. Beattie, D. P. Richards, V. Canadien, A. Lalev, F. Mena, P. Wong, A. Starostine, M. M. Canete, J. Vlasblom, S. Wu, C. Orsi, S. R. Collins, S. Chandran, R. Haw, J. J. Rilstone, K. Gandi, N. J. Thompson, G. Musso, P. St Onge, S. Ghanny, M. H. Y. Lam, G. Butland, A. M. Altaf-Ul, S. Kanaya, A. Shilatifard, E. O’Shea, J. S. Weissman, C. J. Ingles, T. R. Hughes, J. Parkinson, M. Gerstein, S. J. Wodak, and A. Emili and J. F. Greenblatt. Global landscape of protein complexes in the yeast Saccharomyces cerevisiae. Nature, 440:637–643, 2006.
- [330] J. C. Rain, L. Selig, H. De Reuse, V. Battaglia, C. Reverdy, S. Simon, G. Lenzen, F. Petel, J. Wojcik, V. Schaechter, Y. Chemama, A. Labigne, and P. Legrain. The protein-protein interaction map of helicobacter pylori. Nature, 409(6817):211–215, 2001.
- [331] L. Giot, J. S. Bader, C. Brouwer, A. Chaudhuri, B. Kuang, Y. Li, Y. L. Hao, C. E. Ooi, B. Godwin, E. Vitols, G. Vijayadamodar, P. Pochart, H. Machineni, M. Welsh, Y. Kong, B. Zerhusen, R. Malcolm, Z. Varrone, A. Collis, M. Minto, S. Burgess, L. McDaniel, E. Stimpson, F. Spriggs, J. Williams, K. Neurath, N. Ioime, M. Agee, E. Voss, K. Furtak, R. Renzulli, N. Aanensen, S. Carrolla, E. Bickelhaupt, Y. Lazovatsky, A. DaSilva, J. Zhong, C. A. Stanyon, R. L. Finley Jr., K. P. White, M. Braverman, T. Jarvie, S. Gold, M. Leach, J. Knight, R. A. Shimkets, M. P. McKenna, J. Chant, and J. M. Rothberg. A protein interaction map of drosophila melanogaster. Science, 302(5651):1727–1736, 2003.
- [332] E. Ravasz and A.-L. Barabási. Hierarchical organization in complex networks. Physical Review E, 67(2):26112, 2003.
- [333] A. W. Rives and T. Galitski. Modular organization of cellular networks. Proceedings of the National Academy of Science USA, 100(3):1128–1133, 2003.
- [334] R. Albert. Scale-free networks in cell biology. J Cell Sci, 118(Pt 21):4947–57, 2005.
- [335] A. E. Motter, N. Gulbahce, E. Almaas, and A.-L. Barabási. Predicting synthetic rescues in metabolic networks. Molecular Systems Biology, 4(168), 2008.
- [336] S. Maslov and K. Sneppen. Specificity and Stability in Topology of Protein Networks. Science, 296(5569):910–913, 2002.
- [337] S. Schnell, S. Fortunato, and S. Roy. Is the intrinsic disorder of proteins the cause of the scale-free architecture of protein-protein interaction networks? arxiv:q-bio/0606029, 2006.
- [338] T. Manke, L. Demetrius, and M. Vingron. Lethality and Entropy of Protein Interaction Networks. Genome Inform Ser Workshop Genome Inform, 16(1):159–63, 2005.
- [339] M. P. Joy, A. Brock, D. E. Ingber, and S. Huang. High-Betweenness Proteins in the Yeast Protein Interaction Network. Journal of Biomedicine and Biotechnology, 2005(2):96–103, 2005.
- [340] S. Wuchty, Z. N. Oltvai, and A.-L. Barabási. Evolutionary conservation of motif constituents in the yeast protein interaction network. Nature Genetics, 35(2):176–179, 2003.
- [341] L. H. Hartwell, J. J. Hopfield, S. Leibler, and A. W. Murray. From molecular to modular cell biology. Nature, 402(6761):C47–C52, 1999.
- [342] J. F. Poyatos and L. D. Hurst. How biologically relevant are interaction-based modules in protein networks? Genome Biology, 5:R93, 2004.
- [343] I. Albert and R. Albert. Conserved network motifs allow protein–protein interaction prediction. Bioinformatics, 20(18):3346–3352, 2004.
- [344] N. Williams. Yeast genome sequence ferments new research. Science, 272(5261):481–500, 1996.
- [345] S. Fields and O. Song. A novel genetic system to detect protein-protein interactions. Nature, 340(6230):245–246, 1989.
- [346] P. L. Bartel and S. Fields. The Yeast Two-Hybrid System. Oxford University Press US, 1997.
- [347] T. Ito, T. Chiba, R. Ozawa, M. Yoshida, M. Hattori, and Y. Sakaki. A comprehensive two-hybrid analysis to explore the yeast protein interactome. Proceedings of the National Academy of Science USA, 98(8):4569–4574, 2001.
- [348] P. Legrain and L. Selig. Genome-wide protein interaction maps using two-hybrid systems. FEBS Lett, 480(1):32–6, 2000.
- [349] S. Mukherjee, S. Bal, and P. Saha. Protein interaction maps using yeast two-hybrid assay. CURRENT SCIENCE, 81(5):458, 2001.
- [350] A. M. Lesk. Introduction to Protein Architecture: The Structural Biology of Proteins. Oxford University Press, 2001.
- [351] D. Eisenberg, E.M. Marcotte, I. Xenarios, and T.O. Yeates. Protein function in the post-genomic era. Nature, 405:823–826, 2000.
- [352] I. Xenarios and D. Eisenberg. Protein interaction databases. Curr. Opin. Biotechnol, 12(4):334–339, 2001.
- [353] R. Mrowka, A. Patzak, and H. Herzel. Is there a bias in proteome research? Genome Research, 11:1971–1973, 2001.
- [354] R. Saito, H. Suzuki, Y. Hayashizaki, and O. Journals. Interaction generality, a measurement to assess the reliability of a protein–protein interaction. Nucleic Acids Research, 30(5):1163–1168, 2002.
- [355] P. Bartel, C. T. Chien, R. Sternglanz, and S. Fields. Elimination of false positives that arise in using the two-hybrid system. Biotechniques, 14(6):920–924, 1993.
- [356] S. Fields and R. Sternglanz. The two-hybrid system: an assay for protein-protein interactions. Trends Genet, 10(8):286–92, 1994.
- [357] A comprehensive analysis of protein-protein interactions in saccharomyces cerevisiae, author=Uetz, P. and Giot, L. and Cagney, G. and Mansfield, T.A. and Judson, R.S. and Knight, J.R. and Lockshon, D. and Narayan, V. and Srinivasan, M. and Pochart, P. and others, journal=Nature, volume=403, number=6770, pages=623–7, year=2000.
- [358] C. von Mering, R. Krause, B. Snel, M. Cornell, S. G. Oliver, S. Fields, and P. Bork. Comparative assessment of large-scale data sets of protein-protein interactions. Nature, 417(6887):399–403, 2002.
- [359] E. M. Marcotte, M. Pellegrini, H. L. Ng, D. W. Rice, T. O. Yeates, and D. Eisenberg. Detecting protein function and protein-protein interactions from genome sequences. Science, 285(5428):751–753, 1999.
- [360] E. Sprinzak, S. Sattath, and H. Margalit. How reliable are experimental protein–protein interaction data. J Mol Biol, 327(5):919–23, 2003.
- [361] M. Pellegrini, E. M. Marcotte, M. J. Thompson, D. Eisenberg, T. O. Yeates, G. M. Suel, S. W. Lockless, M. A. Wall, and R. Ranganathan. Assigning protein functions by comparative genome analysis: protein phylogeneticprofiles. Proceedings of the National Academy of Science USA, 96(8):4285–8, 1999.
- [362] H. Hishigaki, K. Nakai, T. Ono, A. Tanigami, and T. Takagi. Assessment of prediction accuracy of protein function from protein–protein interaction data. Yeast, 18(6):523–531, 2001.
- [363] B. Schwikowski, P. Uetz, and S. Fields. A network of protein- protein interactions in yeast. Nature Biotechnology, 18:1257–1261, 2000.
- [364] A. Vazquez, A. Flammini, A. Maritan, and A. Vespignani. Global protein function prediction from protein-protein interaction networks. Nature Biotechnology, 21(6):697–700, 2003.
- [365] K. Takemoto and C. Oosawa. Evolving networks by merging cliques. Physical Review E, 72(4):46116, 2005.
- [366] E. Eisenberg and E. Y. Levanon. Preferential Attachment in the Protein Network Evolution. Physical Review Letters, 91(13):138701, 2003.
- [367] N. Pržulj, D. G. Corneil, and I. Jurisica. Modeling interactome: scale-free or geometric? Bioinformatics, 20(18):3508–3515, 2004.
- [368] A. Wagner. The Yeast Protein Interaction Network Evolves Rapidly and Contains Few Redundant Duplicate Genes. Molecular Biology and Evolution, 18:1283–1292, 2001.
- [369] A. Vazquez, A. Flammini, A. Maritan, and A. Vespignani. Modeling of protein interaction networks. Complexus, 1(1):38–44, 2003.
- [370] R. V. Solé, R. Pastor-Satorras, E. Smith, and T. B. Kepler. A model of large-scale proteome evolution. Advances in Complex Systems, 5(1):43–54, 2002.
- [371] R. Pastor-Satorras, E. Smith, and R. V. Solé. Evolving protein interaction networks through gene duplication. Journal of Theoretical Biology, 222:199–210, 2002.
- [372] R. V. Solé and P. Fernandez. Modularity “for free” in genome architecture? arxiv:q-bio/0312032, 2003.
- [373] R.K. Pan and S. Sinha. Modular networks emerge from multiconstraint optimization. Physical Review E, 76(4):45103, 2007.
- [374] A. Wagner. How the global structure of protein interaction networks evolves. Proceedings: Biological Sciences, 270(1514):457–466, 2003.
- [375] J. Berg, M. Lässig, and A. Wagner. Structure and evolution of protein interaction networks: a statistical model for link dynamics and gene duplications. BMC Evolutionary Biology, 4(51), 2004.
- [376] C. Vogel, S. A. Teichmann, and J. Pereira-Leal. The relationship between domain duplication and recombination. J. Mol. Biol, 346(1):355–65, 2005.
- [377] S. K. Ng, Z. Zhang, and S. H. Tan. Integrative approach for computationally inferring protein domain interactions. Bioinformatics, 19(8):923–929, 2003.
- [378] D. Betel, R. Isserlin, and C. W. V. Hogue. Analysis of domain correlations in yeast protein complexes. Bioinformatics, 20 Suppl 1:I55–I62, 2004.
- [379] S. Wuchty. Scale-free behavior in protein domain networks. Molecular Biology and Evolution, 18:1694–1702, 2001.
- [380] S. Wuchty. Interaction and domain networks of yeast. Proteomics, 2(12):1715–1723, 2002.
- [381] G. Bagler and S. Sinha. Assortative mixing in Protein Contact Networks and protein folding kinetics. Bioinformatics, 23(14):1760, 2007.
- [382] H. Jeong, B. Tombor, R. Albert, Z. N. Oltvai, and A.-L. Barabási. The large-scale organization of metabolic networks. Nature, 407(6804):651–654, 2000.
- [383] A. Wagner. The small world inside large metabolic networks. Proceedings: Biological Sciences, 268(1478):1803–1810, 2001.
- [384] J. S. Edwards and B. O. Palsson. The Escherichia coli MG1655 in silico metabolic genotype: Its definition, characteristics, and capabilities, 2000.
- [385] S. Schuster, D. A. Fell, and T. Dandekar. A general definition of metabolic pathways useful for systematic organization and analysis of complex metabolic networks. Nature Biotechnology, 18:326–332, 2000.
- [386] E. Ravasz, A. L. Somera, D. A. Mongru, Z. N. Oltvai, and A.-L. Barabási. Hierarchical Organization of Modularity in Metabolic Networks, 2002.
- [387] L. Diambra and L. da F. Costa. Complex networks approach to gene expression driven phenotype imaging. Bioinformatics, 21(20):3846–3851, 2005.
- [388] U. Alon. An Introduction to Systems Biology: Design Principles of Biological Circuits. Chapman & Hall/CRC, 2006.
- [389] A. Blais and B. D. Dynlacht. Constructing transcriptional regulatory networks. Genes & Development, 19(13):1499–1511, 2005.
- [390] E. D. Siggia. Computational methods for transcriptional regulation. Curr. Opin. Genet. Dev, 15:214–221, 2005.
- [391] M. M. Babu, N. M. Luscombe, L. Aravind, M. Gerstein, and S. A. Teichmann. Structure and evolution of transcriptional regulatory networks. Curr. Opin. Struct. Biol, 14(283):15193307, 2004.
- [392] D. Balcan, A. Kabakçıoğlu, M. Mungan, and A. Erzan. The Information Coded in the Yeast Response Elements Accounts for Most of the Topological Properties of Its Transcriptional Regulation Network. PLoS ONE, 2(6):e501, 2007.
- [393] T.I. Lee, N.J. Rinaldi, F. Robert, D.T. Odom, Z. Bar-Joseph, G.K. Gerber, N.M. Hannett, C.T. Harbison, C.M. Thompson, I. Simon, et al. Transcriptional regulatory networks in saccharomyces cerevisiae. Science, 298(5594):799–804, 2002.
- [394] N. Guelzim, S. Bottani, P. Bourgine, and F. Képès. Topological and causal structure of the yeast transcriptional regulatory network. Nature Genetics, 31:60–63, 2002.
- [395] H. W. Ma, J. Buer, and A. P. Zeng. Hierarchical structure and modules in the Escherichia coli transcriptional regulatory network revealed by a new top-down approach. BMC Bioinformatics, 5:199, 2004.
- [396] R. Dobrin, Q. K. Beg, A.-L. Barabási, and Z. N. Oltvai. Aggregation of topological motifs in the Escherichia coli transcriptional regulatory network. BMC Bioinformatics, 5(1):10, 2004.
- [397] H. Yu, D. Greenbaum, H. Xin Lu, X. Zhu, and M. Gerstein. Genomic analysis of essentiality within protein networks. Trends Genet, 20(6):227–231, 2004.
- [398] F. Li, T. Long, Y. Lu, Q. Ouyang, and C. Tang. The yeast cell-cycle network is robustly designed. Proceedings of the National Academy of Science USA, 101(14):4781–4786, 2004.
- [399] K. Klemm and S. Bornholdt. Topology of biological networks and reliability of information processing. Proceedings of the National Academy of Science USA, 102(51):18414–18419, 2005.
- [400] S. Bornholdt. Less is more in modeling large genetic networks. Science, 310(5747):449–451, 2005.
- [401] S. A. Teichmann and M. M. Babu. Gene regulatory network growth by duplication. Nature Genetics, 36(5):492–496, 2004.
- [402] N. S. Holter, M. Mitra, A. Maritan, M. Cieplak, J. R. Banavar, and N. V. Fedoroff. Fundamental patterns underlying gene expression profiles: Simplicity from complexity, 2000.
- [403] O. Alter, P. O. Brown, and D. Botstein. Singular value decomposition for genome-wide expression data processing and modeling, 2000.
- [404] D. S. Lee, J. Park, K. A. Kay, N. A. Christakis, Z. N. Oltvai, and A.-L. Barabási. The implications of human metabolic network topology for disease comorbidity. Proceedings of the National Academy of Science USA, 105:9849–9850, 2008.
- [405] A.-L. Barabási. Network Medicine–From Obesity to the" Diseasome". New England Journal of Medicine, 357(4):404, 2007.
- [406] L. da F. Costa, M.P. Viana, and M.E. Beletti. Complex channel networks of bone structure. Applied Physics Letters, 88:033903, 2006.
- [407] L. da F. Costa, M.P. Viana, and M.E. Beletti. Hierarchy, Fractality, Small-World and Resilience of Haversian Bone Structure: A Complex Network Study. Arxiv preprint q-bio.TO/0506019, 2005.
- [408] B. Drossel and A. McKane. Handbook of graphs and networks, chapter Modelling food webs. Wiley-VCH, Berlin, 2003.
- [409] J. E. Cohen, F. Briand, and C. M. Newman. Community food webs. Springer-Verlag New York, 1990.
- [410] P. A. Murtaugh and J. P. Kollath. Variation of Trophic Fractions and Connectance in Food Webs. Ecology, 78(5):1382–1387, 1997.
- [411] R. J. Williams, E. L. Berlow, J. A. Dunne, A.-L. Barabási, and N. D. Martinez. Two degrees of separation in complex food webs. Proceedings of the National Academy of Science USA, 99(20):12913–12916, 2002.
- [412] D. Garlaschelli, G. Caldarelli, and L. Pietronero. Universal scaling relations in food webs. Nature, 423(6936):165–8, 2003.
- [413] D. Garlaschelli. Universality in food webs. The European Physical Journal B-Condensed Matter, 38(2):277–285, 2004.
- [414] I. Hanski. Metapopulation dynamics. Nature, 396(6706):41–49, 1998.
- [415] V. Vuorinen, M. Peltomäki, M. Rost, and MJ Alava. Networks in metapopulation dynamics. The European Physical Journal B-Condensed Matter, 38(2):261–268, 2004.
- [416] P.R. Guimarães Jr, M.A. de Menezes, R.W. Baird, D. Lusseau, P. Guimarães, and S.F. dos Reis. Vulnerability of a killer whale social network to disease outbreaks. Physical Review E, 76(4):42901, 2007.
- [417] J. Camacho, R. Guimerà, and L.A. Nunes Amaral. Robust Patterns in Food Web Structure. Physical Review Letters, 88(22):228102, 2002.
- [418] C.C. Wilmers. Understanding ecosystem robustness. Trends in Ecology & Evolution, 22(10):504–506, 2007.
- [419] S. Sinha. Complexity vs. stability in small-world networks. Physica A: Statistical Mechanics and its Applications, 346(1-2):147–153, 2005.
- [420] S. Sinha and S. Sinha. Evidence of universality for the May-Wigner stability theorem for random networks with local dynamics. Physical Review E, 71(2):20902, 2005.
- [421] D.H. Boucher. The Biology of Mutualism: Ecology and Evolution. Oxford University Press, 1988.
- [422] E.L. Rezende, J.E. Lavabre, P.R. Guimaraes, P. Jordano, and J. Bascompte. Non-random coextinctions in phylogenetically structured mutualistic networks. Nature, 448(7156):925–928, 2007.
- [423] P.R. Guimarães Jr, V. Rico-Gray, S. Furtado dos Reis, and J.N. Thompson. Asymmetries in specialization in ant–plant mutualistic networks. Proceedings of the Royal Society B: Biological Sciences, 273(1597):2041–2047, 2006.
- [424] J. Bascompte, P. Jordano, C.J. Melián, and J.M. Olesen. The nested assembly of plant-animal mutualistic networks. Proceedings of the National Academy of Science USA, 100(16):9383–9387, 2003.
- [425] P.R. Guimarães Jr, C. Sazima, S.F. Reis, and I. Sazima. The nested structure of marine cleaning symbiosis: is it like flowers and bees? Biology Letters, 3(1):51–54, 2007.
- [426] J.M. Beggs and D. Plenz. Neuronal Avalanches in Neocortical Circuits. Journal of Neuroscience, 23(35):11167, 2003.
- [427] O. Sporns. Network analysis, complexity, and brain function. Complexity, 8(1):56–60, 2002.
- [428] L. da F. Costa. Morphological complex networks: Can individual morphology determine the general connectivity and dynamics of networks? arxiv:q-bio.MN/0503041, 2005.
- [429] C. Koch and G. Laurent. Complexity and the nervous system. Science, 284(5411):96–8, 1999.
- [430] M. Hämäläinen, R. Hari, R. J. Ilmoniemi, J. Knuutila, and O. V. Lounasmaa. Magnetoencephalography–theory, instrumentation, and applications to noninvasive studies of the working human brain. Reviews of Modern Physics, 65(2):413–497, 1993.
- [431] N. K. Logothetis, J. Pauls, M. Augath, T. Trinath, and A. Oeltermann. Neurophysiological investigation of the basis of the fMRI signal. Nature, 412:150–157, 2001.
- [432] L. da F. Costa and L. Diambra. Topographical maps as complex networks. Physical Review E, 71(2):21901, 2005.
- [433] L. da F. Costa, M. S. Barbosa, V. Coupez, and D. Stauffer. Morphological Hopfield Networks. Brain and Mind, 4(1):91–105, 2003.
- [434] D.J. Felleman and D.C. Van Essen. Distributed hierarchical processing in the primate cerebral cortex. Cerebral Cortex, 1(1):1–47, 1991.
- [435] C.C. Hilgetag. Anatomical connectivity defines the organization of clusters of cortical areas in the macaque and the cat. Philosophical Transactions: Biological Sciences, 355(1393):91–110, 2000.
- [436] G. A. P. C. Burns. Analysis of the connectional organization of neural systems associated with the hippocampus in rats. Philosophical Transactions: Biological Sciences, 355(1393):55–70, 2000.
- [437] J. W. Scannell, C. Blakemore, and M. P. Young. Analysis of connectivity in the cat cerebral cortex. Journal of Neuroscience, 15(2):1463–1483, 1995.
- [438] J. Karbowski. Optimal wiring principle and plateaus in the degree of separation for cortical neurons. Physical Review Letters, 86(16):3674–3677, 2001.
- [439] C.C. Hilgetag. Uniformity, specificity and variability of corticocortical connectivity. Philosophical Transactions: Biological Sciences, 355(1393):7–20, 2000.
- [440] L. da F. Costa and O. Sporns. Hierarchical features of large-scale cortical connectivity. The European Physical Journal B-Condensed Matter, 48(4):567–573, 2005.
- [441] L. da F. Costa, M. Kaiser, and C. C. Hilgetag. Predicting the connectivity of primate cortical networks from topological and spatial node properties. BMC Systems Biology, 1:16, 2007.
- [442] L. da F. Costa and O. Sporns. Diversity of cortical states at non-equilibrium simulated by the ferromagnetic Ising model under metropolis dynamics. International Journal of Bifurcation and Chaos in Applied Sciences and Engineering, 17(7):2387–2398, 2007.
- [443] L. da F. Costa and O. Sporns. Correlating thalamocortical connectivity and activity. Applied Physics Letters, 89:013903, 2006.
- [444] L.F. Lago-Fernández, R. Huerta, F. Corbacho, and J.A. Sigüenza. Fast Response and Temporal Coherent Oscillations in Small-World Networks. Physical Review Letters, 84(12):2758–2761, 2000.
- [445] B. Percha, R. Dzakpasu, M. Żochowski, and J. Parent. Transition from local to global phase synchrony in small world neural network and its possible implications for epilepsy. Physical Review E, 72(3):31909, 2005.
- [446] S. Sinha, J. Saramäki, and K. Kaski. Emergence of self-sustained patterns in small-world excitable media. Physical Review E, 76(1):15101, 2007.
- [447] S. Nadkarni and P. Jung. Spontaneous oscillations of dressed neurons: A new mechanism for epilepsy? Physical Review Letters, 91(26):268101, 2003.
- [448] N. Chatterjee and S. Sinha. Understanding the mind of a worm: hierarchical network structure underlying nervous system function in C. elegans. Prog Brain Res, 168:145–53, 2007.
- [449] M. I. Rabinovich, P. Varona, A. I. Selverston, and H. D. I. Abarbanel. Dynamical principles in neuroscience. Reviews of Modern Physics, 78(4):1213–1265, 2006.
- [450] A. M. Aertsen, G. L. Gerstein, M. K. Habib, and G. Palm. Dynamics of neuronal firing correlation: modulation of" effective connectivity". Journal of Neurophysiology, 61(5):900–917, 1989.
- [451] C. J. Stam. Functional connectivity patterns of human magnetoencephalographic recordings: a small-world network? Neuroscience Letters, 355(1-2):25–28, 2004.
- [452] D. S. Bassett, A. Meyer-Lindenberg, S. Achard, T. Duke, and E. Bullmore. From the Cover: Adaptive reconfiguration of fractal small-world human brain functional networks. Proceedings of the National Academy of Science USA, 103(51):19518, 2006.
- [453] S. Dodel, JM Hermann, and T. Geisel. Functional connectivity by cross-correlation clustering. Neurocomputing, 44(46):1065–1070, 2002.
- [454] F. De Vico Fallani, L. Astolfi, F. Cincotti, D. Mattia, M.G. Marciani, A. Tocci, S. Salinari, H. Witte, W. Hesse, S. Gao, A. Colosimo, and F. Babiloni. Cortical Network Dynamics during Foot Movements. Neuroinformatics, 6(1):23–34, 2008.
- [455] F. De Vico Fallani, L. Astolfi, F. Cincotti, D. Mattia, MG Marciani, S. Salinari, J. Kurths, S. Gao, A. Cichocki, A. Colosimo, and F. Babiloni. Cortical functional connectivity networks in normal and spinal cord injured patients: Evaluation by graph analysis. Hum Brain Mapp, 28(12):1334–46, 2007.
- [456] V. M. Eguíluz, D. R. Chialvo, G. A. Cecchi, M. Baliki, and A. V. Apkarian. Scale-Free Brain Functional Networks. Physical Review Letters, 94(1):18102, 2005.
- [457] R. Salvador, J. Suckling, C. Schwarzbauer, and E. Bullmore. Undirected graphs of frequency-dependent functional connectivity in whole brain networks. Philosophical Transactions of the Royal Society B: Biological Sciences, 360(1457):937–946, 2005.
- [458] S. Achard, R. Salvador, B. Whitcher, J. Suckling, and E. Bullmore. A resilient, low-frequency, small-world human brain functional network with highly connected association cortical hubs. Journal of Neuroscience, 26(1):63, 2006.
- [459] C. J. Stam, B. F. Jones, G. Nolte, M. Breakspear, and P. Scheltens. Small-World Networks and Functional Connectivity in Alzheimer’s Disease. Cerebral Cortex, 17(1):92, 2007.
- [460] F. Bartolomei, I. Bosma, M. Klein, J.C. Baayen, J.C. Reijneveld, T.J. Postma, J.J. Heimans, B.W. van Dijk, J.C. de Munck, A. de Jongh, K.S. Cover, and C.J. Stam. Disturbed functional connectivity in brain tumour patients: Evaluation by graph analysis of synchronization matrices. Clinical Neurophysiology, 117(9):2039–2049, 2006.
- [461] R. V. Solé, B. Corominas-Murtra, S. Valverde, and L. Steels. Language networks: Their structure, function and evolution. SFI Working Paper 05-12-042, 2005.
- [462] D. Jurafsky and J. H. Martin. Speech and Language Processing: An Introduction to Natural Language Processing, Computational Linguistics and Speech Recognition. Prentice Hall, New Jersey, 2000.
- [463] B. Pang and L. Lee. A sentimental education: Sentiment analysis using subjectivity summarization based on minimum cuts. In Proceedings of the ACL 2004, pages 271–278, 2004.
- [464] R. Mihalcea. Random walks on text structures. In Proceedings of CICLing-2006, volume 3878 of LNCS, pages 249–262, February 2006.
- [465] S. N. Dorogovtsev and J. F. F. Mendes. Language as an evolving word web. Proceedings of the Royal Society of London B, 268:2603, 2001.
- [466] R. Ferrer i Cancho and R. V. Solé. The small world of human language. Proceedings of the Royal Society of London B, 268:2261, 2001.
- [467] V. Loreto and L. Steels. Social dynamics: Emergence of language. Nature Physics, 3:758–760, 2007.
- [468] M. Steyvers and J. B. Tenenbaum. The large-scale structure of semantic networks: statistical analyses and a model for semantic growth. Cognitive Science, 29:41–78, 2005.
- [469] A. E. Motter, A. P. S. Moura, Y. C. Lai, and P. Dasgupta. Topology of the conceptual network of language. Physical Review E, 65:065102, 2002.
- [470] A. J. Holanda, I. T. Pisa, O. Kinouchi, A. S. Martinez, and E. E. S. Ruiz. Thesaurus as a complex network. Physica A, 344:530–536, 2004.
- [471] D. Strori, A. Bombaci, and H. Bingol. Cross comparison of synonym graphs in a multi linguistic context. In 22nd International Symposium on Computer and Information Sciences, pages 1–7, 2007.
- [472] H. E. Makaruk and R. Owczarek. Hubs in languages: Scale free networks of synonyms. Preprint arXiv:0802.4112v1, 2008.
- [473] O. Kinouchi, A. S. Martinez, G. F. Lima, G. M. Lourenço, and S. Risau-Gusman. Deterministic walks in random networks: An application to thesaurus graphs. Physica A, 315:665–676, 2002.
- [474] M. Sigman and G. A. Cecchi. Global organization of the WordNet lexicon. Proceedings of the National Academy of Sciences, 99(3):1742–1747, 2002.
- [475] L. da F. Costa. What’s in a name? International Journal of Modern Physics C, 15:371–379, 2004.
- [476] A. A. A. Ferreira, G. Corso, G. Piuvezam, and M. S. C. F. Alves. A scale-free network of evoked words. Brazilian Journal of Physics, 36(3A):755–758, 2006.
- [477] M. Choudhury, A. Mukherjee, A. Basu, and N. Ganguly. Analysis and synthesis of the distribution of consonants over languages: a complex network approach. In Proceedings of the COLING/ACL on Main conference poster sessions, pages 128–135, 2006.
- [478] M. M. Soares, G. Corso, and L. S. Lucena. The network of syllables in Portuguese. Physica A, 355:678–684, 2005.
- [479] A. Mukherjee, M. Choudhury, A. Basu, and N. Ganguly. Modeling the co-occurrence principles of the consonant inventories: A complex network approach, 2006. arXiv:physics/0606132.
- [480] S. M. G. Caldeira, T. C. Petit Lobão, R. F. S. Andrade, A. Neme, and J. G. V. Miranda. The network of concepts in written texts. European Physical Journal B, 49:523–529, 2006.
- [481] A. P. Masucci and G. J. Rodgers. Network properties of written human language. Physical Review E, 74:026102, 2006.
- [482] R. Ferrer i Cancho, R. V. Solé, and R. Köhler. Patterns in syntactic dependency networks. Physical Review E, 69:051915, 2004.
- [483] R. Ferrer i Cancho, A. Capocci, and G. Caldarelli. Spectral methods cluster words of the same class in a syntactic dependency network. International Journal of Bifurcation and Chaos, 17(7):2453–2463, 2007.
- [484] A. Capocci, V. D. P. Servedio, G. Caldarelli, and F. Colaiori. Detecting communities in large networks. Physica A, 352:669–676, 2005.
- [485] P. Edmonds. Choosing the word most typical in context using a lexical co-occurrence network. In Proceedings of the 35th Annual Meeting of the Association for Computational Linguistics, pages 507–509, 1997.
- [486] L. Antiqueira, M. G. V. Nunes, O. N. Oliveira Jr., and L. da F. Costa. Strong correlations between text quality and complex networks features. Physica A, 373:811–820, 2007.
- [487] T. A. S. Pardo, L. Antiqueira, M. G. V. Nunes, O. N. Oliveira Jr., and L. da F. Costa. Modeling and evaluating summaries using complex networks. In Proceedings of the 7th Workshop on Computational Processing of Written and Spoken Portuguese (PROPOR), volume 3960 of LNAI, pages 1–10. Springer-Verlag, May 2006.
- [488] T. A. S. Pardo, L. Antiqueira, M. G. V. Nunes, O. N. Oliveira Jr., and L. da F. Costa. Using complex networks for language processing: The case of summary evaluation. In Proceedings of the International Conference on Communications, Circuits and Systems (ICCCAS’06) - Special Session on Complex Networks, 2006.
- [489] D. R. Amancio, L. Antiqueira, T. A. S. Pardo, L. da F. Costa, O. N. Oliveira Jr., and M. G. V. Nunes. Complex networks analysis of manual and machine translations. International Journal of Modern Physics C, 19(4):583–598, 2008.
- [490] L. Antiqueira, T. A. S. Pardo, M. G. V. Nunes, O. N. Oliveira Jr., and L. da F. Costa. Some issues on complex networks for author characterization. In Proceeedings of the Workshop in Information and Human Language Technology (TIL’06), 2006.
- [491] M. Choudhury, M. Thomas, A. Mukherjee, A. Basu, and N. Ganguly. How difficult is it to develop a perfect spell-checker? a cross-linguistic analysis through complex network approach. In Proceedings of the Second Workshop on TextGraphs: Graph-Based Algorithms for Natural Language Processing, pages 81–88, 2007.
- [492] B. Corominas-Murtra. Network statistics on early English syntax: Structural criteria. Preprint arXiv:0704.3708v2, 2007.
- [493] M. Markošová. Network model of human language. Physica A, 387(2-3):661–666, 2008.
- [494] S. Abe and N. Suzuki. Scale-free network of earthquakes. Europhysics Letters, 65(4):581–586, 2004.
- [495] S. Abe and N. Suzuki. Complex-network description of seismicity. Nonlinear Processes in Geophysics, 13(2):145–150, 2006.
- [496] S. Abe and N. Suzuki. Small-world structure of earthquake network. Physica A: Statistical Mechanics and its Applications, 337(1-2):357–362, 2004.
- [497] S. Abe and N. Suzuki. Complex earthquake networks: Hierarchical organization and assortative mixing. Physical Review E, 74(2):026113–026117, 2006.
- [498] S. Abe and N. Suzuki. Dynamical evolution of clustering in complex network of earthquakes. The European Physical Journal B, 59(1):93–97, 2007.
- [499] M. Baiesi and M. Paczuski. Scale-free networks of earthquakes and aftershocks. Physical Review E, 69(6):066106–066113, 2004.
- [500] G. Bianconi and A.-L. Barabási. Bose-einstein condensation in complex networks. Physical Review Letters, 86(24):5632–5635, 2001.
- [501] R. Burioni, D. Cassi, M. Rasetti, P. Sodano, and A. Vezzani. Bose-einstein condensation on inhomogeneous complex networks. J. Phys. B: At. Mol. Opt. Phys, 34:4697–4710, 2001.
- [502] J. P. K. Doye and Massen C. P. Characterizing the network topology of the energy landscapes of atomic clusters. The Journal of Chemical Physics, 122(8):084105, 2005.
- [503] T. Taketsugu and D. J. Wales. Theoretical study of rearrangements in water dimer and trimer. Molecular Physics, 100(17):2793–2806, 2002.
- [504] F. Rao and A. Caflisch. The protein folding network. Journal of Molecular Biology, 342(1):299–306, 2004.
- [505] D. Gfeller, P. De Los Rios, A. Caflisch, and F. Rao. Complex network analysis of free-energy landscapes. Proceedings of the National Academy of Science USA, 104(6):1817–1822, 2007.
- [506] H. Seyed-allaesi, H. Seyed-allaesi, and M. R. Ejtehadi. The energy landscape network of spin-glasses, 2007. arXiv:0710.5403v1.
- [507] E. T. Lu and R. J. Hamilton. Avalanches and the distribution of solar flares. Astrophysics Journal Letters, 380(2):L89–L92, 1991.
- [508] D. Hughes and M. Paczuski. Scale-free magnetic networks: comparing observational data with a self-organizing model of the coronal field, 2003. astro-ph/0309230v1.
- [509] D. Hughes and M. Paczuski. A heavenly example of scale free networks and self-organized criticality. Physica A: Statistical Mechanics and its Applications, 342(1-2):158–163, 2004.
- [510] M. Guitterman. Small-world phenomena in physics: the Ising model. Journal of Physics A: Mathematical and Theoretical, 33(47):8373–8381, 2000.
- [511] A. Barrat and M. Weigt. On the properties of small-world network models. European Physics Journal B, 13(3):547–560, 2000.
- [512] H. Hong, B. J. Kim, and M. Y. Choi. Comment on “Ising model on a small world network”. Physical Review E, 66(1):018101–018102, 2002.
- [513] S. Roy and S. M. Bhattacharjee. Is small-world network disordered? Physics Letters A, 352:13, 2006.
- [514] C. P. Herrero. Ising model in small-world networks. Physical Review E, 65(6):066110–066115, 2002.
- [515] T.-Y. Cai and Z.-Y. Li. Ising model on a small world network. International Journal of Modern Physics B, 18(17-19):2575–2578, 2004.
- [516] A. Aleksiejuk, J.A. Hołyst, and D. Stauffer. Ferromagnetic phase transition in Barabási–Albert networks. Physica A: Statistical Mechanics and its Applications, 310(1-2):260–266, 2002.
- [517] G. Bianconi. Mean field solution of the Ising model on a Barabási-Albert network. Physics Letters A, 303(2):166–168, 2002.
- [518] S. N. Dorogovtsev, A. V. Goltsev, and J. F. F. Mendes. Ising model on networks with an arbitrary distribution of connections. Physical Review E, 66(1):016104–016108, 2002.
- [519] M. Leone, A. Vázquez, A. Vespignani, and R. Zecchina. Ferromagnetic ordering in graphs with arbitrary degree distribution. The European Physical Journal B, 28(2):191–197, 2002.
- [520] M. A. Sumour and M. M. Shabat. Monte carlo simulation of Ising model on directed barabási-albert network, 2004. arXiv:0411055.
- [521] S. N. Dorogovtsev, A. V. Goltsev, and J. F. F. Mendes. Potts model on complex networks. The European Physical Journal B, 38(2):177–182, 2004.
- [522] Z.-Q. Jiang, W.-X. Zhou, B. Xu, and W.-K. Yuan. A complex ammonia plant network in chemical engineering. AIChE Journal, 53(2):423–428, 2007.
- [523] L. A. N. Amaral and M. Barthèlemy. Small-world networks and the conformation space of a short lattice polymer chain. Europhysics Letters, 55(4):594–600, 2001.
- [524] A. Kabakçioglu and A. L. Stella. Scale-free network hidden in a collapsing polymer. Physical Review E, 72(5):055102–055105, 2005.
- [525] L. K. Gallos and P. Argyrakis. Absence of kinetic effects in reaction-diffusion processes in scale-free networks. Physical Review Letters, 92(13):138301, 2004.
- [526] R. V. Solé and A. Munteanu. The large scale oranization of chemical reaction networks in astrophysics. Europhysics Letters, 68(2):170–176, 2004.
- [527] G. Corso. Families and clustering in a natural numbers network. Physical Review E, 69(3):036106–036110, 2004.
- [528] A. K. Chandra and S. Dasgupta. A small world network of prime numbers. Physica A: Statistical Mechanics and its Applications, 357(3-4):436–446, 2005.
- [529] A. A. Tsonis, K. L. Swanson, and P. J. Roebber. What do networks have to do with climate. Bulletin of the American Meteorological Society, 87(5):585–596, 2006.
- [530] A. A. Tsonis, A. G. Hunt, and J. B. Elsner. On the relation between ENSO and global climate change. Meteorology and Atmospheric Physics, 84(3):229–242, 2003.
- [531] A. A. Tsonis, J. B. Elsner, A. G. Hunt, and T. H. Jagger. Unfolding the relation between global temperature and ENSO. Geophysical Research Letters, 32(9), 2005.
- [532] A. A. Tsonis and K. L. Swanson. Topology and Predictability of El Niño and La Niña Networks. Physical Review Letters, 100(22), 2008.
- [533] V. Latora and M. Marchiori. How the science of complex networks can help developing strategies against terrorism. Chaos, Solitons and Fractals, 20(1):69–75, 2004.
- [534] V. E. Krebs. Mapping networks of terrorist cells. Connections, 24(3):43–52, 2002.
- [535] Y. Maeno and Y. Ohsawa. Discovering covert node in networked organization. Arxiv preprint arXiv:0803.3363, 2008.
- [536] J. O. Kephart and S. R. White. Directed-graph epidemiological models of computer viruses. IEEE Computer Society Symposium on Research in Security and Privacy, pages 343–359, 1991.
- [537] A. Kleczkowski and B. T. Grenfell. Mean-field-type equations for spread of epidemics: The ‘small world’ model. Physica A: Statistical Mechanics and its Applications, 274(1-2):355–360, 1999.
- [538] C. Moore and M. E. J. Newman. Epidemics and percolation in small-world networks. Physical Review E, 61(5):05678–05682, 2000.
- [539] M. Kuperman and G. Abramson. Small world effect in an epidemiological model. Physical Review Letters, 86(13):2909–2912, 2001.
- [540] M. Small, P. Shi, and C. K. Tse. Plausible models for propagation of the sars virus. IEICE Trans Fundam Electron Commun Comput Sci, E87-A(9):2379–2386, 2004.
- [541] R. Pastor-Satorras and A. Vespignani. Epidemic dynamics and endemic states in complex networks. Physcial Review E, 63(6):066117–066124, 2001.
- [542] M. Boguñá, R. Pastor-Satorras, and A. Vespignani. Absence of epidemic threshold in scale-free networks with degree correlations. Physical Review Letters, 90(2):028701–028703, 2003.
- [543] Y. Moreno, R. Pastor-Satorras, and A. Vespignani. Epidemic outbreaks in complex heterogeneous networks. The European Physical Journal B, 26(4):521–529, 2002.
- [544] M. E. J. Newman. Spread of epidemic disease on networks. Physical Review E, 66(1):016128–016139, 2002.
- [545] R. Pastor-Satorras and A. Vespignani. Epidemic dynamics infinite size scale-free networks. Physical Review E, 65(3):035108–035111, 2002.
- [546] X. F. Wang and G. Chen. Complex networks: small-world, scale-free and beyond. Circuits and Systems Magazine, IEEE, 3(1):6–20, 2003.
- [547] F. Liljeros, C. R. Edling, H. E. Stanley, Y. Aberg, and L. A. N. Amaral. Sexual contacts and epidemic thresholds. Nature, 423(6940):605–606, 2003.
- [548] T. Zhou, Z.-Q. Fu, and B.-H. Wang. Epidemic dynamics on complex networks. Progress in Natural Science, 16(5):452–457, 2006.
- [549] Z. Dezső and A.-L. Barabási. Halting viruses in scale-free networks? Physical Review E, 65(5):055103–055106, 2002.
- [550] R. Pastor-Satorras and A. Vespignani. Immunization of complex networks. Physical Review E, 65(3):036104–036111, 2002.
- [551] R. Pastor-Satorras and A. Vespignani. Epidemics and immunization in scale-free networks. In S. Bornholdt and H. G. Schuster, editors, Handbook of Graphs and Networks. Wiley-VCH, Berlin, 2003.
- [552] R. Cohen, S. Havlin, and D. ben Avraham. Efficient immunization strategies for computer networks and populations. Physical Review Letters, 91(24):247901–247904, 2003.
- [553] J. Gómez-Gardeñes, P. Echenique, and Y. Moreno. Immunization of real complex communication networks. The European Physical Journal B, 49(2):259–264, 2006.
- [554] Y. Hayashi, M. Minoura, and J. Matsukubo. Oscillatory epidemic prevalence in growing scale-free networks. Physical Review E, 69(1):016112–016119, 2004.
- [555] L. A. Meyers, M. E. J. Newman, M. Martin, and S. Schrag. Applying network theory to epidemics: Control measures for outbreaks of mycoplasma pneumoniae. Emerging Infectious Diseases, 9(2):204–210, 2001.
- [556] L. M. Sander, C. P. Warren, I. Sokolov, C. Simon, and J. Koopman. Percolation on heterogeneous networks as a model for epidemics. Mathematical Biosciences, 180(1):293–305, 2002.
- [557] L. M. Sander, C. P. Warrena, and I. M. Sokolovb. Epidemics, disorder, and percolation. Physica A: Statistical Mechanics and its Applications, 325(1-2):1–8, 2003.
- [558] M. Small, P. Shi, and C. Tse. Plausible models for propagation of the sars virus. IEICE Trans. Fundam. Electron. Commun. Comput. Sci., E87(9):2379–2386, 2004.
- [559] M. Small and C. K. Tse. Clustering model for transmission of the sars virus: application to epidemic control and risk assessment. Physica A, 351(2-4):499–411, 2005.
- [560] M. Small, C. K. Tse, and D. M. Walker. Super-spreaders and the rate of transmission of the sars virus. Physica D, 215(2):146–158, 2006.
- [561] M. Small, D. M. Walker, and C. K. Tse. Scale-free distribution of avian influenza outbreaks. Phys. Rev. Lett., 99(18), 2007.
- [562] X. Li and X. A. Wang. On the stability of epidemic spreading in small-world networks: how prompt the recovery should be? International Journal of Systems Science, 38(5):401–411, 2007.
- [563] W.-P. Guo, X. Li, and X.-F. Wang. Epidemics and immunization on euclidean distance preferred small-world networks. Physica A, 380:684–690, 2007.
- [564] Z. Zhang, S. Zhou, T. Zou, and J. Guan. Finite epidemic thresholds in fractal scale-free ‘large-world’ networks, 2008. arXiv:08030361.
- [565] P. Shannon, A. Markiel, O. Ozier, N.S. Baliga, J.T. Wang, D. Ramage, N. Amin, B. Schwikowski, and T. Ideker. Cytoscape: A Software Environment for Integrated Models of Biomolecular Interaction Networks. Genome Research, 13:2498–2504, 2003.