Spatial signal amplification in cell biology: a lattice-gas model for self-tuned phase ordering
Abstract
Experiments show that the movement of eukaryotic cells is regulated by a process of phase separation of two competing enzymes on the cell membrane, that effectively amplifies shallow external gradients of chemical attractant. Notably, the cell is able to self-tune the final enzyme concentrations to an equilibrium state of phase coexistence, for a wide range of the average attractant concentration. We propose a simple lattice model in which, together with a short-range attraction between enzymes, a long-range repulsion naturally arises from physical considerations, that easily explains such observed behavior.
pacs:
64.60.My, 64.60.Qb, 87.16.Xa, 87.17.Jj, 82.39.Rt, 82.40.NpSpecific moments of the life of a cell living in a multicellular community, such as migration, proliferation, organization in layers or complex tissues, imply spatial organization along some axis of direction. The original spatial symmetry of the cell must be broken to adapt to a highly structured anisotropic environment. For instance, migrating cells must orient towards sources of chemical attractants, mitotic cells must orient along the spindle-pole axis to bud daughter cells, epithelial cells must recognize the inner and outer part of tissues to define organ boundaries. From a physical point of view, these spatial organization phenomena may be seen as self-organized phase ordering processes, where the cell state, spontaneously, or because driven by an external field, decays into a state of coexistence of two or more chemical phases, spatially localized in different regions in order to define a front and a rear, a top and a bottom, an outer and an inner part. Local thermodynamic equilibrium requires precise tuning of chemical potentials to nongeneric values to allow the coexistence of different phases. To implement this requirement in a robust way, capable of giving a stable response over a wide range of stimulation situations, biological systems must be endowed with self-organized tuning mechanisms leading to phase coexistence and polarization.
Directional sensing in chemotacting eukaryotic cells provides a beautiful illustration of these principles 111The biological facts presented below are taken, where not otherwise specified, from the reviews RSB+03 and LH96 .. At the heart of directional sensing lies a chemical phase separation process taking place on the inner surface of the cell membrane GCT+05 . The main players of the process are the enzymes phosphatidylinositol 3-kinase (PI3K), and phosphatase and tensin homolog (PTEN), which catalyze the switch of the phospholipid phosphatidylinositol between the bisphosphate (PIP2) and the trisphosphate (PIP3) states. The phospholipids are permanently bound to the inner face of the cell membrane, while the two enzymes diffuse in the cell volume and become active when they are adsorbed on the membrane. PI3K adsorption takes place through binding to receptors of the external attractant. PTEN adsorption takes place through binding to the PTEN product, PIP2, a process which introduces an amplification loop in the system dynamics ID02 ; GCT+05 . A second amplification loop provided by PI3K binding to PIP3 DMY+06 has been recently observed.
Although there are no relevant enzyme–enzyme or phospholipid–phospholipid interactions, the above described catalytic processes, together with phospholipid diffusion on the cell membrane, mediate an effective short-range attractive interaction among enzymes of the same type. This interaction drives the system towards phase separation in a PTEN-rich and a PI3K-rich phase GCT+05 ; CGC+07 . Two different regimes of membrane polarization may be distinguished. In the presence of an attractant gradient, anisotropy driven polarization is realized in a time of the order of a few minutes, and results in the formation of a PI3K-rich patch on the membrane side closer to the attractant source and of a PTEN-rich patch in the complementary region ID02 . The process works as an efficient gradient amplifier: a few percent gradient is sufficient to completely polarize the cell membrane. The orientation response is reversible: by inverting the gradient direction the polarization orientation is also inverted. On the other hand, cells exposed to uniform distributions of attractant polarize in random directions over a longer timescale. The average concentration of attractant is of crucial importance, as shown by experimentally observed dose-response curves Zig77 : directional sensing does not take place neither at very low nor at very high attractant levels, and there exists an optimal attractant concentration such that the cell response is maximal.
On the basis of a simple analogy with the physics of binary mixtures, one would expect that the coexistence between the PI3K-rich and the PTEN-rich phase would require a fine tuning of the chemical potential difference between the two species. Surprisingly, phase separation takes place instead for a wide range of absolute concentration of the attractant, and therefore of absolute values of the chemical potential for PI3K adsorption. To explain this mechanism we propose here a simple lattice-gas model in which, together with the effective short-range attraction between enzymes, a long-range repulsion naturally arises from the finiteness of the enzymatic reservoir, that easily explains the observed behavior.
Model – We represent the cell membrane by a square lattice of size with sites, using periodic boundary conditions. The sites occupied by PI3K (PTEN) are described by a () spin 222One can imagine performing a coarse-graining of the system on an appropriate length scale and associating a sign to PI3K-rich sites and a sign to PTEN-rich sites.. We denote by the total number of enzymes in the cell, which is given by the sum of the number of cytosolic (free) enzymes and the number of membrane-bound enzymes: . The probability that a PI3K enzyme binds to site is proportional to the number of cytosolic PI3Ks and to the density of binding sites (activated receptors with local concentration and PIP3’s). As a first approximation, the PIP3 concentration can be assumed to be linearly dependent from the density of PI3Ks. This gives, on site :
| (1) |
where are functions of the chemical reaction rates, and are the nearest neighbors of . Similarly, the probability that a PTEN molecule binds to site is proportional to the number of free PTENs, and to the concentration of PIP2:
| (2) |
We interpret as an energy difference (in units of ) between states and , depending both on the local field and on the number of cytosolic PI3Ks and PTENs. Since , we can express and as functions of the magnetization . Linearizing around and , we obtain:
| (3) |
where , , with , and , with . If we can neglect the dependence of on the attractant concentration .
Eq. (3) corresponds to the variation of the Hamiltonian
| (4) |
The model (4) contains a short-range ferromagnetic interaction representing the effective attractive interaction between enzymes, a long-range antiferromagnetic interaction which results from the finiteness of the cytosolic enzymatic reservoir, and an external site-dependent field representing the effect of the attractant. The latter depends on the concentration of activated receptors, which we take proportional to the concentration of external attractant, in the form .
When is independent of , the second and third term of Eq. (4) can be written (apart from a constant) as , so that energy minimization leads the system to self-tune to the magnetization value . Eq. (3) shows that is subject to the action of an effective external field . The value measures the degree of metastability of the PTEN phase, and tends to zero during the self-tuning evolution of the system. To realize the phase separation, has to be greater than the critical value for the two-dimensional Ising spin model (). Furthermore, in the absence of chemical attractant, the membrane has to be fully occupied by PTEN, implying . We set for definiteness .
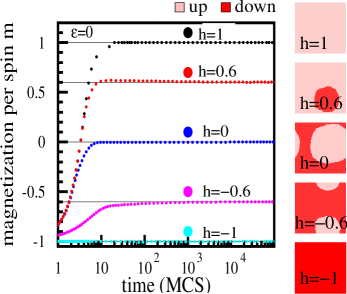
Simulations – We study by Monte Carlo simulations the dynamics and the final state attained by the system, using a square lattice of size . We first consider the case , which corresponds to uniform stimulation. In the absence of stimulation (, implying and ) the membrane is uniformly populated by PTEN molecules. Setting (which implies ), spin up (PI3K) domain nucleation is started in the spin down (PTEN) sea. The magnetization tends asymptotically to , while the effective field tends to zero (Fig. 1), realizing the condition for phase coexistence.
After a rapid nucleation phase, a domain coarsening dynamics follows: large domains grow and smaller ones shrink LP81 (Fig. 2).
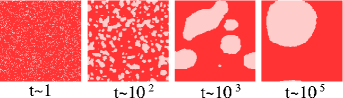
The final equilibrium state is characterized by the coexistence of the PI3K and the PTEN phase, localized in two complementary clusters. The equilibrium position of the PI3K cluster, which determines the direction of cell movement, is random. This behavior is consistent with experiments in which cells exposed to a uniform attractant distribution orient randomly (stochastic polarization) Zig77 .
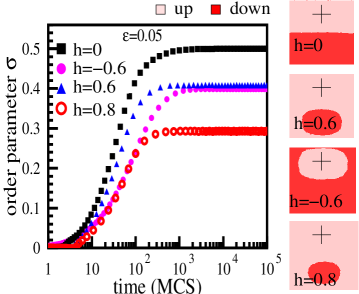
In the presence of a gradient in the chemical attractant () the PI3K cluster localizes around the maximum of the attractant density. To measure the polarization degree we define the following order parameter:
| (5) |
which is both a measure of the degree of order in the system and of the correlation of the center of the PI3K cluster with the maximum of the attractant density (Fig. 3).
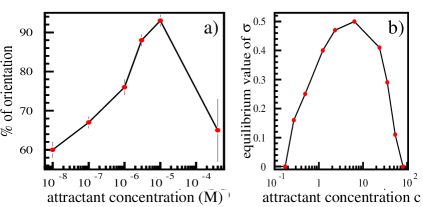
Dose-response curve – Simulations reproduce the qualitative behavior of experimentally observed dose-response curves SNB+06 ; Zig77 , showing no response for either very high or very low values of the attractant concentration, and optimal response for intermediate values (Fig. 4). This effect can be explained as follows. For very low the critical radius for patch nucleation is larger than the size of the cell, and no polarization is possible. For very high , such that , the equilibrium magnetization is , the whole system is uniformly populated by the PI3K phase, and again no polarization is possible. Polarization is possible only for values which are intermediate between these two limit cases.
Reversibility – Polarization induced by the gradient is reversible. By changing the gradient direction after the system has reached equilibrium, the position of the PI3K cluster adjusts to the new direction in a finite time (not shown). This effect reproduces the observed reorientation of eukaryotic cells under varying attractant gradients observed in the experiments JMD+04 . Interestingly, after changing the sign of the relative gradient we observed reorientation taking place by a collective movement of the PI3K cluster, and not by its evaporation and successive recombination.
Gradient amplification and polarization time – The transient states are characterized by a coarsening dynamics with the appearance of scaling laws in the process of domain formation LP81 ; GKL+07 ; Bra95 . Our simulations show that, for a condition of uniform distribution of attractant, in the initial coarsening stage the average cluster radius grows approximately as . In Fig. 5 the inverse length of the total cluster boundary is plotted against time 333If the system is composed of circular domains, the inverse length of the total cluster boundary scales as the mean radius of the clusters..
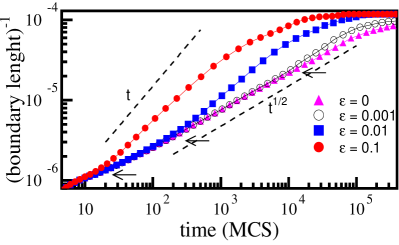
We define the polarization time as the time for which the order parameter reaches 90% of its equilibrium value. If the attractant is uniformly distributed the coarsening process stops when the average cluster radius becomes of the order of the cell size, , implying that the spontaneous cell polarization time scales as .
In the case of an attractant gradient we observe instead a double scaling behavior. For , where is a crossover time depending on the amplitude of the gradient , cluster growth proceeds approximately as in the uniform case, while, for , the process of polarization becomes anisotropic, and the average cluster size grows approximately linearly in (Fig. 5). The presence of this double scaling law implies that the polarization time behaves as (Fig. 6). We can understand the double scaling law as follows. In the presence of an attractant gradient polarization takes place in two steps. In the initial (tuning) step the gradient of the attractant is negligible with respect to the uniform component of the attractant and cluster growth is approximately unaffected by its presence. In the meanwhile, free enzymes shuttle from the cytosolic reservoir to the membrane, lowering the chemical potential for further cluster growth and effectively canceling out the effect of the uniform component of the attractant. This process continues until times of order , when only the effect of the gradient component is left. At this point, fast polarization in the direction of the gradient takes place.
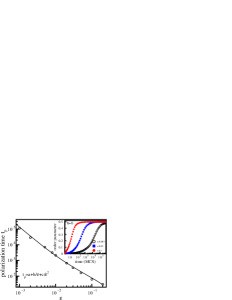
The anisotropic stage of cluster evolution leading to directed polarization occurs only if . Otherwise, the presence of a gradient of attractant becomes irrelevant and only the stage of isotropic patch growth actually occurs. The crossover time increases with decreasing until it becomes of the order of , implying the existence of a lower threshold of detectable gradients. For anisotropy-induced polarization is much faster than spontaneous polarization. This explains the experimentally observed effect of gradient amplification in chemotacting cells and the observation SNB+06 of a lower threshold of detectable gradients, below which there is no directional sensing. Our results also confirm the theoretical predictions of GKL+07 .
Discussion – We have introduced a simple lattice-gas model for the process of eukaryotic directional sensing, which reproduces important aspects of the observed phenomenology and sheds light on the underlying physical mechanism. The model maps signaling molecules and enzymes in spin variables, and the effective interaction between enzymes on the membrane into a ferromagnetic coupling. Enzymes shuttling from the cytosolic reservoir to the membrane is shown to provide a fundamental self-tuning mechanism which drives the system towards phase coexistence and polarization, by counteracting the effect of the external activation field. In the presence of an attractant gradient this mechanism cancels out the isotropic component of the attractant distribution in a first (tuning) stage of cluster growth, preparing the ground for fast directed polarization in the direction of the gradient in the next stage. The control provided by enzyme shuttling is encoded in the coupling of the effective magnetic field with the local order parameter , thus realizing an effective long-range repulsion between enzymes and introducing in the model an element of self-organization. The existence of two distinct stages in cluster evolution when an attractant gradient is present is signaled in the model simulations by the emergence of a double power law for the time evolution of clusters of signaling molecules. This shows up in the dependence of directed polarization time from the gradient: for , scales as .
Previous models of eukaryotic polarization postulated the existence of a global inhibitor, which was needed to cancel out the average value of the attractant leaving only the gradient component (see DJ03 for a review of previously proposed models of eukaryotic chemotaxis). The weak point of this approach is the necessity to fine-tune the activity of the global inhibitor in order to attain perfect cancellation of the average attractant value. In our scheme instead, the exchange of chemical factors between the cell membrane and a finite cytosolic reservoir realizes a self-tuning mechanism which naturally leads to an equilibrium state characterized by the coexistence of two distinct phases, similarly to what happens in the case of first-order phase transitions in a closed liquid-gas system or in the precipitation of a supersaturated solution. The sensing mechanism encoded in the model is particularly robust, allowing the cell to respond over a wide range of attractant concentrations.
Our model explains the experimentally observed behavior of chemotacting cells and reproduces several effects, such as gradient amplification, typical dose-response curves, reversibility of orientation. More generally, it shows that important biological functions may be described at a physical level as self-organized phase transition processes.
Acknowledgements.
We gladly acknowledge useful discussions with S. Di Talia, I. Kolokolov, V. Lebedev and G. Serini.References
- (1) A. Ridley et al., Science 302, 5651 (2003).
- (2) D.A. Lauffenburger and A.F. Horwitz, Cell 84, 359 (1996).
- (3) A. Gamba, et al. Proc. Natl. Acad. Sci U.S.A. 102, 16927 (2005).
- (4) A. de Candia et al., Sci. STKE 378, pl1 (2007).
- (5) M. Iijima and P. Devreotes, Cell 109, 599 (2002).
- (6) M. Dance et al., J. Biol. Chem. 281, 23285 (2006).
- (7) S.H. Zigmond, J. Cell. Biol. 75, 606 (1977).
- (8) E.M. Lifshitz, and L.P. Pitaevskii, Physical Kinetics (Pergamon Press, 1981).
- (9) L. Song et al., Eur. J. Cell Biol. 85, 981 (2006).
- (10) C. Janetopoulos et al., Proc. Natl. Acad. Sci. U.S.A. 101, 16606 (2004).
- (11) A. Bray, Adv. Phys. 45, 357 (1994).
- (12) A. Gamba et al., Phys. Rev. Lett. (2007).
- (13) P. Devreotes and C. Janetopoulos, J. Biol. Chem. 278, 20445 (2003).