A rotating hollow cone anisotropy of TeV emission from binary systems
Abstract
We show that TeV -ray emission produced via interactions of high-energy particles with anisotropic radiation field of a massive star in binary systems should have a characteristic rotating hollow cone anisotropy pattern. The hollow cone, whose axis is directed away from the massive star, rotates with the period equal to the orbital period of the system. We note that the two maxima pattern of the TeV energy band lightcurve of the -ray loud binary LS 5039 can be interpreted in terms of this rotating hollow cone model. Adopting such an interpretation, we are able to constrain the geometry of the system – either the inclination angle of the binary orbit, or the elevation of the -ray emission region above the orbital plane.
Subject headings:
gamma rays: theory — radiation mechanisms: non-thermal — binaries: generalIntroduction. -ray-loud binary systems are a newly identified class of sources in which either accretion onto the compact object (a neutron star, or a black hole), or interaction of an outflow from the compact object with the wind and radiation from a massive companion star leads to the production of very-high energy (VHE) -ray emission. Three such systems, PSR B1259-63, LS 5039 and LSI +61 303, have been firmly detected as persistent or regularly variable TeV -ray emitters (Aharonian et al., 2005, 2006; Albert et al., 2006). The VHE -ray emission from the -ray-loud binaries is variable on the orbital period (or shorter) time scale. This implies that the emission region is located close to the binary system, in a highly inhomogeneous and anisotropic particle and photon background produced by massive companion star.
In what follows we show that if the -ray emission from such a region is produced in interactions of isotropically distributed VHE particles with photons from the massive star, it should have a characteristic “rotating hollow cone” anisotropy, i.e. most of the photons are emitted at a certain angle with respect to a symmetry axis directed radially away from the massive star. Orbital motion of the emission region around the massive star leads to the rotation of the emission cone. Rotation of the hollow cone on the orbital time scale leads to the appearance of 0, 1, or 2 maxima in the orbit-folded lightcurve in the VHE band, occurring at the phases when the line of sight is inclined at an angle with respect to the cone axis, i.e. at the moments of passage of the of the cone through the line of sight (similarly to the hollow cone models of period-folded lightcurves of pulsars, see e.g. (Lyne & Graham-Smith, 2005)).
The orbital modulation of the -ray flux, related to the passage of the hollow cone through the line of sight could be most clearly detected if there are no additional sources of the modulation, related e.g. to the ellipticity of the binary orbit, absence of spherical symmetry of the wind/radiation from the companion star etc. Among the three -ray-loud binary systems mentioned above, the system LS 5039 is characterized by the lowest ellipticity of the orbit. In this system the compact object orbits a O6.5V star which emits isotropic stellar wind (contrary to the other two systems in which the massive star is of the Be type).
The influence of the anisotropy of the photon field of the massive star on the properties of the -ray emission in binaries in general, and in LS 5039 in particular, was first studied by Khangulyan et al. (2005, 2007). Here we calculate the angular brightness profile of the hollow cone in LS 5039, and find that the observation of the two maxima of the orbit-folded lightcurve constrains the inclination of the binary orbit to be , if the emission is produced in the vicinity of the compact object. This result can be stated also in an opposite way: if the inclination of the binary orbit is , the two maxima structure of the orbit-folded lightcurve can be explained only if the VHE -ray emission region is displaced from the position of the compact object. This can be the case if the emission is produced in a jet. In this latter case, we show that the existence of the two-maxima of the lightcurve constrains the elevation of the emission point above the orbital plane.
Anisotropy of VHE -ray emission in a central photon field. Consider the -ray emission produced by interactions of VHE particles (e.g. protons or electrons) with the soft photon field in the vicinity of a massive star. Assume for simplicity that the size of the emission region is much less than the distance from the region to the center of the star and that the VHE particles in the region have isotropic velocity distribution. In spite of the isotropy of the VHE particle distribution, the -ray emission will be anisotropic. The anisotropy arises because of the Doppler effect which leads to the decrease (increase) of the rate of interaction of the VHE particles co-moving with (moving oppositely to) the soft photon field of the massive star.
The interaction rate of particles with momenta with soft photons with momenta is given by (Landau & Lifshitz, 1980)
| (1) |
where is the interaction cross-section, is the particle distribution, is the soft photon distribution and is the scalar product of the 4-momenta of the interacting particles,
| (2) |
( is the angle between the particle velocities) which contains the Doppler factor, (we assume that particle velocity is ).
If the soft photon field in the emission region would be isotropic, integration of the interaction rate of Eq. (1) over the soft photon angular distribution would average out of the angular factor , so that the -ray emission intensity, which is proportional to the interaction rate, would be isotropic. However, since all the soft photons crossing the emission region move in the same direction (away from the massive star), the interaction rate depends on the angle between the direction of emission and the direction ”from the massive star”. Particles comoving with the soft photon field (moving at the angles ) interact more rarely than the particles moving opposite to the photon field (at ).
The reduction of the interaction rate has two-fold consequences. On one hand, it leads to the reduction of the power of the -ray emission by the particles moving in the direction away from the star. On the other hand, the reduction of the interaction rate of the soft photons with the emitted VHE -rays facilitates the escape of -rays moving in the direction away from the star. A competition between the decrease of the -ray production rate, , and the increase of the -ray “survival probability” (i.e. of the , where is the optical depth with respect to the pair production) leads to the appearance of a maximum of the -ray flux
| (3) |
at an angle , i.e. to the appearance of a hollow cone anisotropy pattern.
At large distances from the massive star one can approximate the angular distribution of the soft photons by that of a point source. Under this simplifying assumption, one finds that the integration over the angular distribution of the UV photons is easily performed and the resulting expression for the rate of production of -rays takes the form
| (4) |
where is the cross-section of production of -rays in interaction of the particles with the soft photon field.
An estimate of the optical depth for the -rays, escaping from the production region, can be obtained by multiplying the absorption rate per -ray on the size of the absorbing region. The absorption rate is given by the expression (1) in which the particle is a -ray and the cross-section is the pair production cross section, . Estimating the size of the absorption region to be of the order of the distance of the emission point from the massive star, one finds
| (5) |
Substituting Eqs. (4),(5) into Eq. (3) one finds
| (6) |
Two effects affect the anisotropy pattern of the -ray emission. First, the explicit dependence of on is introduced in Eq. (6) by the Doppler effect. An additional implicit dependence on is introduced through the energy dependence of the interaction cross-sections . Indeed, in general , where the if the center-of-mass energy, which, in the case depends on as .
The anisotropy pattern resulting from the Doppler effect can be found if one ignores the energy dependence of . This is done in Fig. 1 (the constant is taken to be ). From this figure one can see that most of the -ray flux is emitted along a ”thick hollow cone” with the opening angle and the thickness comparable to the opening angle, . The energy dependence of the interaction cross-sections leads to the energy-dependent angular brightness profile of the thick hollow cone. The cone becomes wider at higher energies, where the absorption is less efficient, see Fig. 5 below. The non-zero brightness at is due to the finite radius of the star.

Geometrical model of variability of -ray emission. If the location of the emission region is determined by the position of the compact object (e.g. the -ray emission is produced in the vicinity of the compact object, or in the jet emitted by the compact object), the orientation of the hollow cone changes when the compact object moves around the star, as it is shown in Fig. 2 (where the emission region is supposed to be situated at an elevation above the compact object, so that the hollow cone axis is inclined at an angle , where is the binary separation distance).
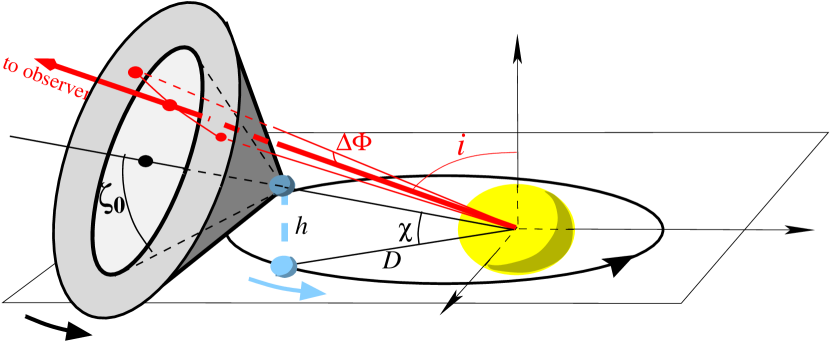
Changes of the orientation of the hollow cone with respect to the line of sight should lead to the orbital modulation of the observed -ray flux. Depending on the relation between the inclination angle of the binary orbit plane, and the opening angle of the hollow cone, , two characteristic patterns of the orbital modulation are possible. If the inclination of the orbit is , the direction of the line of sight passes through the ”wall” of the cone two times per orbit. This should lead to the appearance of two maxima in the orbit-folded lightcurve. If the binary orbit is circular, the maxima of the lightcurve occur when the true anomaly of the orbit (angular orbital phase , counted from the focal point of the orbit, at the periastron) takes the values
| (7) |
where is the anomaly of the inferior conjunction and
| (8) |
If the binary orbit is elliptical, an additional orbital modulation of the -ray flux can occur because of the variation of the distance of the emission region from the massive star (which leads to the modulation of the -ray production/absorption rates) with the orbital phase. As the inclination of the orbit decreases to , the two maxima at and merge at the phase .
Since the opening angle of the hollow cone, depends on the -ray energy, the condition can be satisfied only in a certain interval of energies, so that a merger of the two maxima at the phase of inferior conjunction can be observable at a particular energy at which .
The case of LS 5039. LS 5039 is one of the several X-ray binaries detected as sources of the VHE -ray emission (Aharonian et al., 2006). In this binary system the compact object rotates with the period d around a massive O6.5V star. The orbit is eccentric (). The inclination of the orbit is (Casares et al., 2005).
The orbit-folded lightcurve of the source at the energies TeV (Aharonian et al., 2006) has two maxima at the orbital phases . The two maxima are apparently not symmetric: the first maximum around spans a broader range of the orbital phase, while the second maximum is more sharp. The second maximum happens closer to the phase of the inferior conjunction, , than the first one. Replotting the orbit-folded TeV -ray lightcurve as a function of the true anomaly, , (to produce Fig. 3, we have calculated the true anomalies of each data point of the top panel of Fig. 5 of Aharonian et al. (2006) and rebinned the data into bins of the width ) rather than as a function of , a symmetry in the positions of the two maxima can be found.
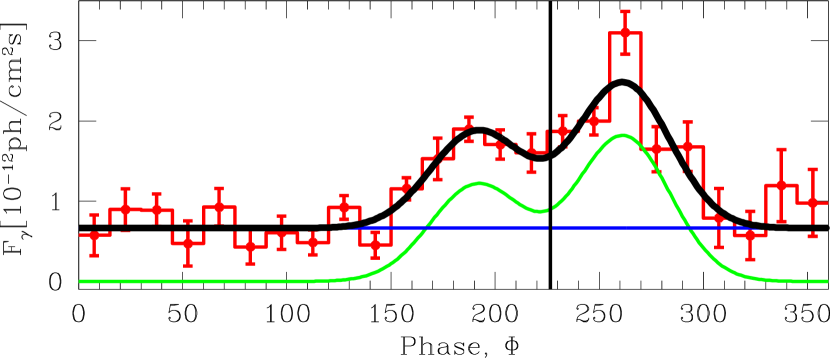
Namely, the lightcurve can be satisfactory fitted with a phenomenological model which is a sum of a constant (weakly modulated emission which can be produced e.g. at larger distances) plus two gaussians, whose centers are equally spaced from the phase of the inferior conjunction, (see Fig. 3). The positions of the centers of the gaussians, found by the fit, are , while the widths of the gaussians are nearly equal, (if the phase of the inferior conjunction is left free, while fitting, the fit finds the phase , consistent with the value found by Casares et al. (2005)). The gaussian centered at the phase is found to have times higher normalization than the gaussian centered at .
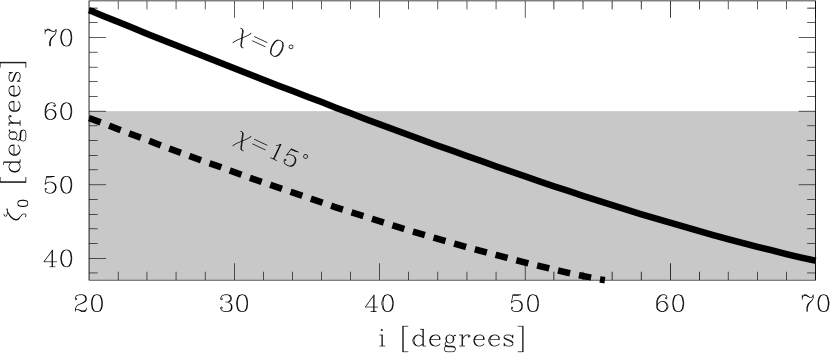
The observed symmetry of the positions of the maxima of the orbit folded lightcurve can be interpreted, in a straightforward way, in terms of the ”rotating hollow cone” model, discussed in the previous sections. In particular the phase shift of Eq. (7) is . From Eq. (8) (which can be used, for a low-eccentricity orbit, as a first approximation) one can find a relation between and , shown in Fig. 4. Taking into account the constraint on the inclination angle, (Casares et al., 2005), we find that the opening angle of the hollow cone anisotropy pattern is constrained to , if the emission is assumed to come from the vicinity of the compact object ( in Fig. 2).
A constraint on the geometry of LS 5039. The opening angle of the hollow cone, , can be found, once the emission process leading to the -ray production and the location of the emission region are known. Comparing the theoretically predicted value of to the one implied by the data one can, in principle, constrain the geometry of the system. In particular, assuming that the location of the emission region is known, one can constrain the inclination of the binary orbit with respect to the line of sight. Otherwise, if the inclination of the orbit would be known, one would be able to constrain the location of the emission region, in particular, its distance from the star and/or elevation above the orbital plane.
Different locations of the VHE -ray emission region are assumed in different models of activity of LS 5039. In the model of ”compact pulsar wind nebula” (see e.g. (Dubus et al., 2007)) the emission region is assumed to surround the compact object ( in notations of Fig. 2). In a ”microquasar” model the TeV emission is assumed to be produced in a jet, so that the emission region is displaced from the position of the compact object (it is situated above or below the orbital plane, , see e.g. (Khangulyan et al., 2007)). In both types of models the VHE -rays are produced via the inverse Compton scattering of the soft photons by the VHE electrons.
To find the rate of production of -rays via the inverse Compton scattering, one has to numerically integrate the Eq. (1), with being the Klein-Nishina cross section, over the angular and energy distributions of soft photons at a distance from the massive star. The result of such integration is shown by the dotted curves in Fig. 5 for electron energies, and TeV for the case when the emission region is situated at the distance of the periastron of the binary orbit.
To find the optical depth for the -rays emitted at different angles (see Eq. 3), one first calculates the -ray absorption rate, given by Eq. (1) with the cross section being the pair production cross-section, at each point of the -ray trajectory. This is done similarly to the calculation of the inverse Compton scattering rate, via an integration over the soft photon angular distribution. Next, one has to integrate the absorption rate along the -ray trajectory, from the emission point to infinity. The result of such numerical integration is shown by the dashed curves in Fig. 5 for -ray energies and TeV, assuming that emission is produced at the distance of the periastron of the binary orbit.
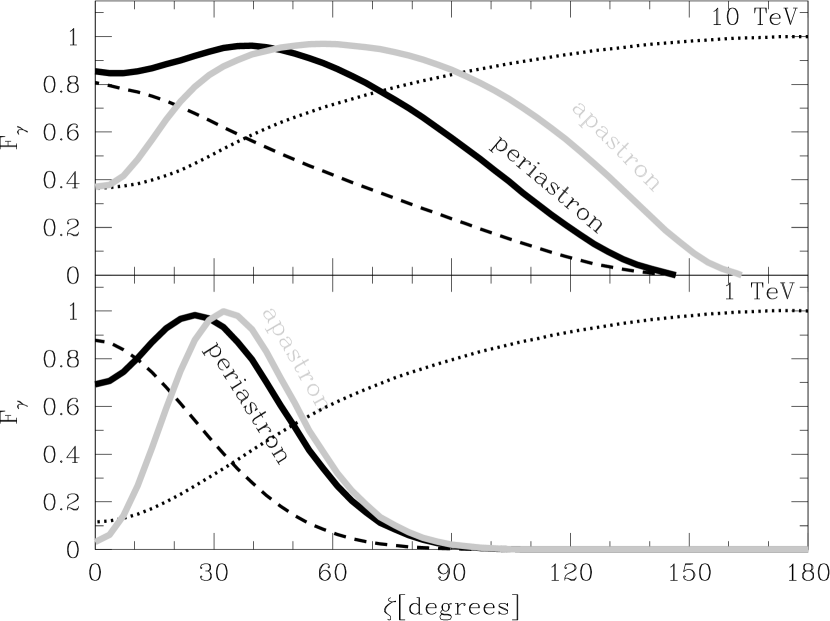
Substituting the numerically found and into Eq. (3) one can find the angular brightness profile of the hollow cone for different orbital phases and different photon energies. The angular brightness profile, calculated for the periastron/apastron of the binary orbit, is shown by the thick, solid, black/grey curve in Fig. 5. We assume that the energies of -rays are approximately equal to the energies of the primary electrons, which is true in the Klein-Nishina regime of the inverse Compton scattering.
The first maximum of the TeV band lightcurve of LS 5039 takes place at the orbital phase , close to the apastron of the orbit. From Fig. 5 one can see that at this phase the opening angle of the cone changes in the range when the -ray energy changes from 1 to 10 TeV. Comparing this numerically calculated range of values (shaded region in Fig. 4) to the one implied by the observational data, one can find from Fig. 4, that if the VHE -ray emission is produced close to the compact object (i.e. at ) the inclination angle of the binary orbit should be .
The constraint on can be re-formulated in a different way: if the inclination angle of the orbit is small, e.g. (see Casares et al. (2005)), the -ray emission is not produced close to the compact object. Instead, from Fig. 4 one can find that in this case the elevation of the emission region above the orbital plane should be . If the emission region is located in a jet-like outflow orthogonal to the orbital plane, the emission region should be situated at the height above the orbital plane, where is the binary separation distance (see Fig. 2 for notations).
Summary. We have shown that VHE -ray emission from -ray-loud binaries is expected to have a rotating hollow cone anisotropy pattern, determined by the Doppler effect in the anisotropic radiation field of a massive star (Fig. 1). This anisotropy leads to the appearance of a double-peak structure of the orbit-folded lightcurve, with the two peaks situated at equal distance (Eq. 8) from the phase of the inferior conjunction. We have demonstrated that such a symmetric double-peak structure is observed in the particular case of LS 5039. In this case, a measurement of the phase shift enables to find a relation between the opening angle of the hollow cone, , and the inclination of the binary orbit, (see Fig. 4). Comparing the value of , inferred from the data, to the one found from numerical calculation of the angular brightness profile of the cone (Fig. 5) we were able to constrain the inclination of the binary orbit and/or the elevation of the VHE -ray emission region above the orbital plane in this particular source.
In the particular case of LS 5039, the rotating hollow cone model discussed above can be tested if the statistics of the signal from the source becomes high enough to allow a splitting of the source lightcurve at the energies TeV onto two energy bins (e.g. TeV TeV and TeV). In this case the predicted shifts of the two maxima of the lightcurve toward each other (or even a merger of them) at the higher energies should be observable. If observed, such an effect would be a clear evidence in favor of the proposed model.
We thank F.Aharonian and A.Zdziarsky for the discussions of the subject.
References
- Aharonian et al. (2005) Aharonian F.A. et al., 2005, A&A, 442, 1.
- Aharonian et al. (2006) Aharonian F.A. et al., 2006, A&A, 460, 743.
- Albert et al. (2006) Albert J., et al., 2006, Science, 312, 1771.
- Dubus et al. (2007) Dubus G., Cerutti B., Henri G., 2007, A&A, accepted (arXiv:0710.0968).
- Khangulyan et al. (2005) Khangulyan D., Aharonian F., AIP Conf. Proc., 2005, 745, 359.
- Khangulyan et al. (2007) Khangulyan D., Aharonian F., Bosch-Ramon V., 2007, MNRAS, accepted (arXiv:0707.1689).
- Landau & Lifshitz (1980) Landau L.D., Lifshitz E.M., 1980, The Classical Theory of Fields, Elsevier.
- Lyne & Graham-Smith (2005) Lyne A., Graham-Smith F., 2005, Pulsar Astronomy, Cambridge Univ. Press.
- Casares et al. (2005) Casares J., Ribo M., Ribas I., et al., 2005, MNRAS, 364, 899.