“X–ray supernova remnants in nearby galaxies”
Abstract
We present the initial results from a study of the SNR population in a sample of six nearby galaxies (NGC 2403, NGC 4214, NGC 4449, NGC 5204, NGC 3077, NGC 4395) based on Chandra archival data. We discuss the analysis of the Chandra data and we present candidate SNR sources selected on the basis of their X–ray colours. We also present deep [S ii] 6716 & 6731 and H line images for most of the galaxies in our sample, which provide optically selected samples of SNRs. Comparison of the X–ray results with the complementary optical observations provides a more complete picture of the SNR population and allows us to address their X–ray emission. Our preliminary analysis of the [S ii]/H images show that 48 X–ray sources are typically associated with H sources, 7 of which are SNR candidates based on their [S ii]/H ratio and one is an already known radio SNR.
1 Introduction
Supernova Remnants (SNRs) are an important component of the X–ray source populations in galaxies (Blair & Long 1997), especially in luminosities below erg sec-1. The expanding SNR shocks heat the surrounding interstellar medium (ISM) to temperatures of – K and produce X–ray emission. This way SNRs provide a significant fraction of the mechanical energy that heats, shapes and chemically enriches the ISM. Despite extensive studies of individual galactic SNRs, a complete understanding of these sources remains elusive. It is well known that different wavebands provide a picture of different evolutionary stages of the SNR populations. On the other hand, although it is almost certain that environment plays a major role in the evolution and the multiwavelength properties of SNRs (e.g. Pannuti et al. 2007), the details of this connection are poorly understood. In order to address this connection, we initiated an X–ray and optical study of six nearby galaxies. Here we present the preliminary results from this work focusing on the identification and classification of the SNR candidates.
2 Sample, data reduction and identification method
Our sample consists of the nearby galaxies observed with Chandra and fulfil the following criteria : a) Distance 5 Mpc, in order to minimize source confusion; b) Inclination 60 degrees, in order to minimize internal extinction and projection effects; and c) Exposure times long enough to achieve a uniform detection limit of erg sec-1. The X–ray data analysis was performed with the CIAO tool suite version 3.4 and with custom developed scripts. This analysis includes initial cleaning of the data, source detection, photometry and multi band image extraction. The identification of the thermal SNRs is based on their hardness ratios (e.g. Prestwich et al. 2003). X–ray colours can be used to obtain information on the spectral properties of X–ray sources, especially in the case of small number of counts when spectral fitting is not possible. We calculate the X–ray colours using the BEHR tool (Park et al. 2006). In addition to the Chandra data, we obtained optical images in the [S ii] 6716 & 6731 and H lines using the 1.3m Skinakas (Greece) and the 1.2m FLWO (USA) telescopes. The optical images were also cleaned, sky subtracted and aligned using the IRAF package. The final H and [S ii] images were divided in order to locate sources with ratio [S ii]/H 0.4 (Mathewson & Clarke 1973), indicating optical SNR candidates.
3 Preliminary Results
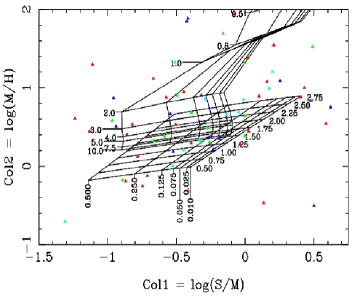
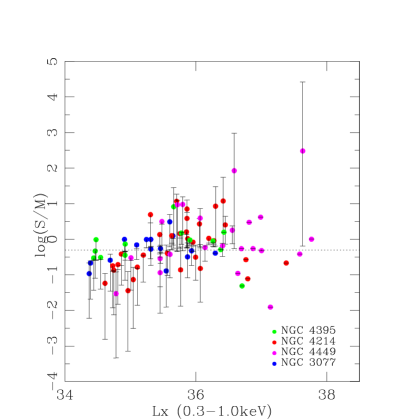
In Figure 1 we show a plot of the X–ray color Col1=log(S/M) versus the X–ray color Col2=log(M/H), where S, M, H are the numbers of counts in the soft (0.1 – 3.0 keV), medium (1.0 – 2.5 keV) and hard band (2.5 – 7.0 keV), of all the detected sources in four galaxies of our sample. On the same plot we present X–ray grids for power law and thermal plasma models for different temperature (kT), absorbing Hi column density and photon index (). The circle shows the locus of thermal SNRs given that they are expected to have temperatures of 2 keV. From the same diagram we see that sources with Col1 –0.3 have a high proportion of candidate SNRs. The grids are calculated based on the average affective area of the observations. The points correspond to the hardness ratios for each source calculated using the BEHR method (for clarity we do not show error bars). Points outside the grids have large errors and/or complex multi–component models. The red circle shows the locus of SNRs used in our analysis. Figure 2 shows a plot of Col1 versus luminosity.The X–ray SNR candidates are those with Col1 –0.3. We see that a large number of these sources are soft with luminosities around erg s-1 cm-2. Based on the color – color diagram, many of the sources can be absorbed SNRs.
Acknowledgements.
This work has been partly supported by NASA grant GO6-7086X and NASA LTSA grant G5-13056. IL wishes to thank the Center for Astrophysics for its hospitality during her visits there and acknowledges funding by the European Union and the Greek Ministry of Development in the framework of the programme ’Promotion of Excellence in Research Institutes (2nd Part)’ and the European Social Fund (ESF), Operational Program for Educational and Vocational Training II (EPEAEK II), and particularly the Program PYTHAGORAS II. The authors would like to thank the staff at 1.3 Skinakas Observatory (Crete, Greece) and FLWO 1.2 Observatory (Mt. Hopkins, Arizona, USA) for their excellent support during the observations. Skinakas Observatory is a collaborative project of the University of Crete, the Foundation for Research and the Technology-Hellas and the Max-Planck-Institute.
References
- [1] Blair, W.P. & Long, K.S., 1997,ApJS, 108, 261
- [2] Mathewson, D.S., & Clarke, L.N., 1973, ApJ, 180, 725
- [3] Mattonick, D.M. & Fesen, R.A., 1997, ApJS, 112, 49
- [4] Mattonick, D.M. et al., 1997, ApJS, 113, 333
- [5] Panutti, T., Schlegel, E.M., Griffith, S.A., 2007, AJ, 210, 1510
- [6] Park, T. et al., 2006, ApJ, 652, 610
- [7] Prestwich, A., et al., 2004, A&A, 595, 719
- [8] Vukotic, 2005, SerAJ, 170, 101