Radio spectrum evolution and magnetic field in extreme GPS radio sources
Abstract
Aims. The knowledge of the properties of the youngest radio sources is very important in order to trace the earliest phase of the evolution of the radio emission. RXJ1459+3337, with its high turnover frequency ( 25 GHz) provides a unique opportunity to study this class of extreme objects.
Methods. High-sensitivity multi-frequency VLA observations have been carried out to measure the flux-density with high accuracy, while multi-frequency VLBA observations were performed, aimed at determining the pc-scale structure. Archival ROSAT data have been used to infer the X-ray luminosity.
Results. The comparison between our new VLA data and those available in the literature shows a steady increment of the flux-density in the optically-thick part of the spectrum and a decrement of the turnover frequency. In the optically-thin regime, the source flux density has already started to decrease. Such a variability can be explained in terms of an adiabatically-expanding homogeneous radio component. The frequency range spanned by our VLBA observations, together with the resolution achieved, allows us to determine the source size and the turnover frequency, and then to derive the magnetic field directly from these observable quantities. The value obtained in this way is in good agreement with that computed assuming equipartition condition. A similar value is also obtained by comparing the radio and X-ray luminosities.
Key Words.:
galaxies: active – galaxies: evolution – radio continuum: general – magnetic fields – radiation mechanisms: non-thermal1 Introduction
The radio emission of extragalactic sources is synchrotron
radiation produced by relativistic electrons with a power-law energy
distribution. The relativistic electrons produce a power-law radio
spectrum which
reaches its maximum in
correspondence to the turnover frequency .
At frequencies below
, the
spectrum turns over likely due to Synchrotron Self-Absorption (Snellen
et al. sn00 (2000)), although free-free absorption may also play a
role (Mutoh et al. mutoh02 (2002), Kameno et al. kameno00 (2000)).
The evolutionary models proposed to interpret the various stages of the
life-cycle of radio sources relate the typical spectral peak
of very small and then compact region with age.
In the evolutionary scenario, the peak of the spectrum
progressively moves toward lower frequencies as the radio source
expands/grows.
In this framework, GHz-peaked spectrum (GPS) and compact
steep-spectrum (CSS) radio sources, the former with and the latter with , are
considered to represent early stages in the individual radio source
evolution.
The timescale of the spectral evolution in extremely young radio
sources is very short, of the order of a few tens of years
(Dallacasa dd03 (2003)).
This implies that the ideal targets to investigate
how the radio spectrum evolves, and
that are the main mechanisms at work, must be sought among
sources with very high
turnover frequencies.
The existence of “extreme” GPS sources with
turnover frequency above 10 GHz, termed “high frequency peakers”
(HFPs) by Dallacasa et al. (dd00 (2000)), is expected
from all the radio source evolutionary models.
Their detection is, however, quite difficult since they are
short-lived objects evolving into GPS and then CSS sources, and
to observational
limitations preventing their selection.
For a source to be recognized
as an extreme GPS object, the characteristic turnover frequency
must lie within
the frequency range sampled by large area surveys.
The frequencies of
the surveys currently available are not high enough to allow an
efficient selection of high-frequency peaking objects, since there is
insufficient information above 5 GHz.


The radio source RXJ1459+3337 was one of the first objects to be
recognized as an “extreme” GPS with the
turnover frequency at about 30 GHz and a peak flux density of
about 800 mJy as reported by Edge et al. (edge96 (1996)).
This object is associated with a quasar at z = 0.6448. It was
detected by ROSAT (Brinkmann et al. brink00 (2000)) and shows
an X-ray luminosity .
Multi-epoch VLA observations
indicate strong variability in the optically-thick part of its
radio spectrum. In particular, the flux-density variability at 5 GHz
(i.e. in the optically-thick regime) seems
to steadily increase.
Although flux-density variability is quite rare in GPS sources (O’Dea
odea98 (1998)), an increment of the flux density at frequencies below
may be a consequence of the evolution of a synchrotron
self-absorbed spectrum in an expanding component.
In this paper we present the results of
multi-frequency VLA and VLBA observations conducted in 2003 and
2005, respectively. In order to
identify the mechanisms at the basis of the spectral evolution we
combine the information on the physical conditions provided by
our new VLA data with that from archival data obtained in 1996
and 1999.
The frequency range sampled by
the new VLBA observations, together with their high-resolution,
allows us to compute the magnetic field by means of
observable quantities only, such as peak frequency, peak flux
density and the source size, as from the synchrotron theory
(Kellermann & Pauliny-Toth kpt81 (1981); see also Section 4.2).
The comparison between this value with the
field strength obtained assuming equipartition provides important
information on the physical conditions of the radio source.
Throughout this paper, we assume the following cosmology: , and , in a flat Universe.
2 Observations and data reduction
Our target RXJ1459+3337 was observed with the VLA on September 12th 2003
at 8 independent frequencies (1.4, 1.7, 4.5, 4.9, 8.1, 8.4, 15.0 and
22.2 GHz) during the monitoring program of HFP candidates
(Dallacasa et
al. dd00 (2000); Tinti et al. st05 (2005)),
the characteristics of the observations and the
data reduction are described in Orienti et al. (mo07 (2007)).
In VLA data the r.m.s noise level on the image plane is not relevant
(always well below 1 mJy),
if compared to the main
uncertainty coming from the amplitude calibration errors, which are
within (1) 3% at 1.4, 1.7, 4.5, 5.0, 8.1 and 8.4 GHz, and 5%
at 15 and 22 GHz, and which are predominant in the case of relatively
strong radio sources such as RXJ1459+3337.
VLBA observations of the radio source RXJ1459+3337 were carried
out on April 4th 2005 at 1.7, 5, 8.4, 15, 22 and 43 GHz, in
full polarization mode with a recording band-width of 32 MHz at 128
Mbps, for a total time of 10 hours.
The correlation was performed at the VLBA correlator in
Socorro and the data reduction was carried out with the NRAO AIPS package.
After the application of system temperature and antenna gain, the
amplitudes were checked using the data on 4C39.25 (J0927+3902).
The error on the absolute flux density scale is generally within
3%–10%, being worse at the highest frequencies.
The same source 4C39.25 was used to generate the bandpass
correction at each frequency.
However, at 43.2 GHz
a problem on the scan on the calibrator
precluded a good bandpass calibration.
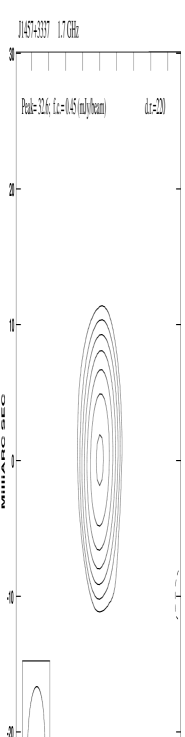
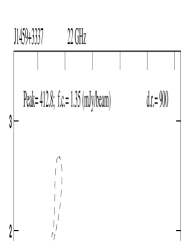
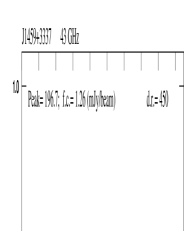
Images of RXJ1459+3337 at each frequency were produced after a number of
phase-only self-calibration iterations (Fig. 1).
The source was found to
be marginally
resolved at all frequencies (Fig. 2).
| Date | ||||||||||
|---|---|---|---|---|---|---|---|---|---|---|
| mJy | mJy | mJy | mJy | mJy | mJy | mJy | mJy | mJy | ||
| VLA | Sept 2003 | 25 | 31 | 194 | 221 | 410 | 423 | 521 | 356 | |
| VLBA | Apr 2005 | 33 | 221 | 446 | 519 | 348 | 198 |

The source flux densities at each frequency
have been measured on both VLBA and VLA images
in several ways, giving similar results, and the values
are reported in Table 1.
The VLBA flux-densities at each frequency are
consistent within with those measured by the VLA, indicating the
lack of low-surface brightness features on the pc-scale.
3 Results
GPS radio sources are usually characterized by the lack of any
significant flux-density variability and they can be considered as the
least variable class of extragalactic radio sources (O’Dea
odea98 (1998)), with an average variation within 5% (Stanghellini et
al. cs05 (2005)). In the case of RXJ1459+3337, however,
a comparison between our new simultaneous multi-frequency VLA
observations
with those available from the literature has pinpointed a
substantial variability in the optically thick part of the spectrum.
Fig. 3 shows the light-curves of RXJ1459+3337 at
each frequency:
from these plots it seems that at
1.4 and 5 GHz, well below the turnover frequency, the flux density
has steadily increased, while
in the optically-thin regime (i.e. 22 GHz), the flux density has
decreased. Following the approach from Dallacasa
et al. (dd00 (2000)), we fit the simultaneous radio spectra with a
purely analytical function used to determine
the peak flux density and the frequency
at which it occurs:
In this equation, the parameters and are
purely numeric, and do not provide any direct physical information.
Based on the results of the fit, we found that
the spectral peak has moved to lower
frequencies, from 241 GHz in 1996 to 172 GHz in
1999 and to 12.50.5 in
2003 (Fig. 4). The errors on these quantities were
calculated following the error propagation theory.
The decrement of the spectral peak together with the steady
increment of the flux-density in the optically-thick part of spectrum
suggest that the source is adiabatically expanding.
Despite the high resolution achieved by VLBA observations, the
radio source RXJ1459+3337 is only marginally resolved
even at 43 GHz.
Since the inferred source size is substantially smaller than the
VLBA beam
size at the highest frequency, our measurements are not sensitive to
small changes on the angular size and thus cannot confirm the
source expansion suggested by the spectrum evolution.


4 Discussion
The strong variability in the optically thick part of the spectrum is
not common among sources peaking below 5 GHz (O’Dea odea98 (1998)).
However, the timescale of evolution of extreme GPS sources
appears to be
quite short, of the order of a few tens of years.
In the context of
the youth scenario, such a result is not unexpected since
very young radio sources should evolve quite rapidly (Dallacasa
dd03 (2003)).
In the following discussion we investigate the physical conditions of
the radio emission and which mechanisms are involved in the evolution of
the radio spectrum.
4.1 The evolution of the radio spectrum
As noted above,
the radio emission in extragalactic radio sources is due to
synchrotron radiation from relativistic particles with a power-law
energy distribution. However, in very small objects the observed radio spectrum
significantly departs from the power-law shape, turning over at
frequencies below the peak. Such a deviation is mostly explained in
terms of synchrotron self-absorption.
The mechanism which plays the major role in the evolution of the
optically-thick part of the spectrum is the adiabatic expansion.
In this regime we have that
| (1) |
(Kellermann & Pauliny-Toth kpt81 (1981))
where is the flux density at a given frequency in the
optically-thick part of the spectrum, is the magnetic field
and is the angular size of the emitting region.
As the radio source adiabatically expands, the opacity decreases, the
turnover frequency moves to lower frequencies and the flux
density increases at frequencies below the turnover frequency.
Is it possible to relate the flux-density variability observed in
RXJ1459+3337 to adiabatic expansions?
First of all, we assume that the radio emission is due to a
homogeneous component which is adiabatically expanding at a constant
rate:
where is the source angular size at the time
and at the time .
We also assume that the magnetic field is frozen in the plasma:
where is the magnetic field at the time and
the magnetic field at the time .
From Eq. 1 we find that:
| (2) |
where and are the flux densities measured at the same
frequency at the time and respectively.
In the case of the 5 GHz light-curve, where enough data points are
available, we estimate the time of onset of radio emission by
fitting
the flux density measured at the different epochs
with the function
where , , the age the radio emission had at epoch and a free parameter which is almost equal to unity in our fits. As we consider the flux density measured at the oldest epoch available (; i.e. 1986). From the best fit to the data we obtain years, i.e. the birth of the radio emission should have occurred in 19565. In the case of the 1.4 GHz light-curve, the availability of only 3 data points makes the determination of the age less accurate with years, i.e. the radio emission should have started in 196615, in agreement with the 5 GHz determination. We do not perform fits on the light-curves at higher frequencies since they are affected by contamination due to the flattening occurring near the spectral peak.
As previously mentioned, adiabatic expansion also causes the spectral peak
to shift at lower frequencies. We know that the turnover frequency
is
| (3) |
where the energy of the relativistic particles is defined as (Pacholczyk pacho70 (1970)). This implies that
| (4) |
where and are the turnover frequency at the time
and respectively.
We estimate the epoch of the origin of radio emission by fitting the
frequency peak measured at the different epochs with the same function used
to fit the multi-epoch flux density. In this case, y=(/)1/4,
and the age the radio emission had at the epoch . is
the peak frequency at the oldest epoch available (, in this case 1996).
From the best fit we find years, implying that the radio
emission originated at , still in agreement
with the values
obtained from the flux density increment, although with higher
uncertainties, since the fit has been performed on 3 data points only.
The good agreement on the determination of the source age
may indicate that the radio source is evolving
with the physical conditions predicted
by simple self-similar growth models, as previously assumed.
4.2 The magnetic field
Direct measurements of the magnetic field are very difficult to carry
out. The magnetic field can be determined
from observable quantities, such as the turnover frequency in GHz,
the peak flux density in Jy and the source angular sizes
and
in mas as
directly inferred from the observations.
In this case we have
| (5) |
(Kellermann & Pauliny-Toth kpt81 (1981)) where is in Gauss.
From the fit to our new VLA data (see Section 2),
we obtained
12.50.5 GHz and 55015 mJy.
In addition, by using the task JMFIT we measured a source angular size of
0.360.14 mas ( where
is the deconvolved full width at
half-maximum of a Gaussian brightness
distribution as used in the fitting procedure) on our best VLBA
image, namely that at 22 GHz, since the longest spacings at 43 GHz are poorly
sampled and with a rather high noise.
The resulting resolution at 43 GHz is therefore no better than
that at 22 GHz.
With these parameters we obtain G.
Another way to constrain the magnetic field is to assume that the radio
source is in equipartition conditions.
From the minimum energy conditions (Pacholczyk pacho70 (1970)),
the equipartition magnetic field is
| (6) |
where the minimum energy density is
and is the luminosity calculated at 22 GHz, i.e.
in the
optically-thin part of the spectrum, and the volume of the radio
source in pc3.
For the calculation of V,
we assume that the radio emission has an ellipsoidal geometry and an
average optically thin spectral index of 0.7 (S ).
Furthermore, proton and
electron energies are assumed to be equal (k=1), with a filling factor
of
unity (i.e. the source volume is fully and homogeneously filled by
relativistic plasma). From Eq. 6,
we calculate an equipartition magnetic field
0.16 G, in very good agreement with the value directly derived
from the observed spectral quantities.
Since RXJ1459+3337 is also an X-ray source, we can try to constrain
the magnetic field by comparing the radio and X-ray luminosities, if we
assume that all the X-ray emission is due to Comptonization of the
electrons responsible for the synchrotron emission in the radio
band.
In this case we have:
| (7) |
(e.g. Singal singal86 (1986))
where and are the synchrotron and the
synchrotron self-Compton luminosity respectively and is the
radiation field, defined as
with
the surface area of the synchrotron emission,
and the
speed of light.
The ROSAT X-ray flux density of RXJ1459+3337 is 1.5610-12
erg s-1 cm-2 (Brinkmann et al. brink00 (2000)),
which corresponds to an X-ray
luminosity 2.81045 erg/s.
From the radio flux density we derive a synchrotron luminosity 1.21045 erg/s.
If in Eq. 7 we introduce these luminosities and the source
emitting area as derived
from VLBA images assuming an
ellipsoidal geometry (see above), we obtain a magnetic
field H 0.19 G, still in good agreement with the values derived
by the previous methods.
These results strongly suggest that the radio emitting plasma in such an
extreme object is consistent with the equipartition conditions.
5 Conclusions
We have presented new multi-frequency
VLBA and VLA observations of the radio source
RXJ1459+3337. Given the position of the spectral peak at
very high frequency,
this object is classified as an extreme
GPS radio source, also known as HFP.
By comparing our VLA observations with data from the literature spanning
about 17 years, we find that the flux-density in the
optically-thick part of the spectrum has been continuously increasing,
while the turnover frequency has been moving toward lower
frequencies.
Such a regular variability, although not common in GPS sources peaking below 5
GHz, can be described in the case the radio emission
originates from an adiabatically-expanding homogeneous component.
If in this context we compare either the flux-densities at the same frequency
measured at different times or the turnover frequencies,
we constrain the age of the radio emission, which is about
5010 years.
The resolution achieved by the VLBA observations, together with the
frequency range sampled, allowed us to “observe” the
turnover frequency and to directly measure parameters, such
as the peak flux density and angular size of the source with great
accuracy.
In this
way we estimate the magnetic field to be 0.16 0.03 G
by means of observable
quantities only.
The consistency of this value with the field derived for a minimum
energy condition
strongly supports the idea that
such extreme objects, as RXJ1459+3337 may already be
in equipartition.
The availability of ROSAT X-ray observations allowed us to infer the
magnetic field by comparing radio and X-ray luminosities. Even in this
case, the value inferred for the magnetic field agrees with the
previous results.
Acknowledgements.
We thank the anonymous referee for carefully reading the manuscript and valuable suggestions. The VLA and VLBA are operated by the US National Radio Astronomy Observatory which is a facility of the National Science Foundation operated under a cooperative agreement by Associated University, Inc. This work has made use of the NASA/IPAC Extragalactic Database NED which is operated by the JPL, California Institute of Technology, under contract with the National Aeronautics and Space Administration.References
- (1) Becker, R.H., White, R.L., Helfand, D.J. 1995, ApJ, 450, 559
- (2) Brinkmann, W., Laurent-Muehleisen, S.H., Voges, W., et al. 2000, A&A, 356, 445
- (3) Dallacasa, D., Stanghellini, C., Centonza, M., Fanti, R. 2000, A&A, 363, 887
- (4) Dallacasa, D. 2003, PASA, 20, 79
- (5) Edge, A.C., Jones, M., Saunders, R., Pooley, G., Grainge, K. 1996, in Proceedings of the Second Workshop on GPS and CSS Radio Sources, ed. I.A.G. Snellen et al. (Leiden: Leiden Observatory), 208
- (6) Gregory, P.C., Scott, W.K., Douglas, K., Condon, J.J. 1996, ApJS, 103, 427
- (7) Kameno, S., Horiuchi, S., Shen, Z.-Q. et al. 2000, PASJ, 52, 209
- (8) Kellermann, K.I., Pauliny-Toth, I.I.K. 1981, ARA&A, 19, 373
- (9) Laurent-Muehleisen, S.A., Kollgaard, R.I., Ryan, P.J., et al. 1997, A&AS, 122, 235
- (10) Mutoh, M., Makoto, I., Kameno, S., et al. 2002, PASJ, 54, 131
- (11) Neumann, M., Reich, W., Fuerst, E., et al. 1994, A&AS, 106, 303
- (12) O’Dea, C.P. 1998, PASP, 110, 493
- (13) Orienti, M., Dallacasa, D., Stanghellini, C. 2007, A&A, 475, 813
- (14) Pacholkczyk, A.G. 1970, Radio Astrophysics (San Francisco: Freeman & Co.)
- (15) Polatidis, A.G., Conway, J.E. 2003, PASA, 20, 69
- (16) Singal, A.K. 1986, A&A, 155, 242
- (17) Snellen, I.A.G., Schilizzi, R.T., Miley, G.K. et al. 2000, MNRAS, 319, 445
- (18) Stanghellini, C., O’Dea, C.P., Dallacasa, D., et al. 2005, A&A, 443, 891
- (19) Tinti, S., Dallacasa, D., de Zotti, G., Celotti, A., Stanghellini, C. 2005, A&A, 432, 31