On the origin of continuum and line emission in CTTSs
2 Department of Astronomy, Cornell University, Ithaca, NY 14853-6801, USA; romanova@astro.cornell.edu
)
Abstract
We calculated profiles of CIV 1550, Si IV 1400, NV 1240 and OVI 1035 doublet lines using results of 3D MHD simulations of disc accretion onto young stars with dipole magnetic field. It appeared that our calculations can not reproduce profiles of these lines observed (HST/GHRS-STIS and FUSE) in CTTSs’s spectra. We also found that the theory predicts much larger C IV 1550 line flux than observed (up to two orders of magnitude in some cases) and argue that the main portion of accretion energy in CTTSs is liberated outside accretion shock. We conclude that the reason of disagreement between the theory and observation is strongly non-dipole character of CTTS’s magnetic field near its surface. 111 Published in Proc. of IAU Symp. 243: ”Star-Disk Interaction in Young Stars”, Grenoble, France, 2007, Eds. J. Bouvier & I. Appenzeller, p.115
1 Introduction
Since the beginning of the 1990s, there has been a consensus that the line and continuum emission observed in the spectra of classical T Tauri stars (CTTSs) results from the magnetospheric accretion of circumstellar material. More precisely, the magnetic field of the star is believed to stop the accretion disk from reaching the stellar surface. In some way the disk material becomes frozen in the magnetospheric field lines and slides along them toward the stellar surface, eventually being accelerated to velocities km/s. The gas is then decelerated in an accretion shock (AS), whose radiation presumbly gives rise to the observed line and continuum emission.
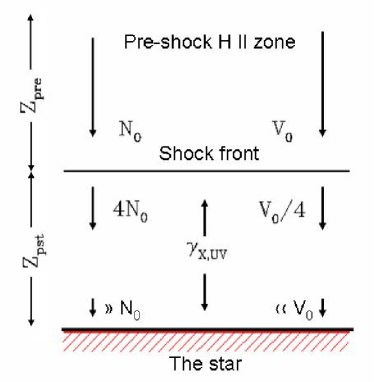
Radial extention of pre- and post-shock radiating regions of CTTS’s AS is much smaller than stellar radius – in figure 1, – making it possible to calculate the structure and spectrum of the AS in 1-D approximation (Lamzin, 1995). Calculations of Lamzin (1998) and Calvet & Gullbring (1998) indicated that the structure of the flow can be specified nearly unambiguously by two parameters: the velocity and density (or particle number density of the gas far in front of the shock.
Calvet & Gullbring (1998) used results of their calculations to derive the parameters of the accretion shock via modeling of the continuum spectral energy distributions of classical T Tauri stars. However, they did not took into account limb darkening effect and what is more the agreement between the calculated and observed spectra of the veiling continuum cannot be considered as a decisive support for the magnetospheric model, since boundary-layer models provide equally good agreement – see e.g. Basri & Bertout (1989). The line spectrum is far more informative, and comparisons of the calculated and observed intensities and profiles of emission lines enable detailed studies of the accretion processes.
Optically thin lines are best suited for this purpose: their intensity ratios can be used to derive physical conditions independent of the geometry of the region where they are formed, and the line profiles provide information about both the velocity field and geometry of this region. The calculations of Lamzin & Gomez de Castro (1999) demonstrated that the O III] 1663, Si III] 1892 and C III] 1909 lines should display the highest intensities among the optically thin lines, and just these lines were used to determine the accretion-shock parameters for several young stars in that paper. However, Gomez de Castro & Verdugo (2001, 2007) questioned whether these lines form in the AS. Spectral lines of neutral or singly ionized atoms apparantly form not only in AS but in magnetospheric flow and wind as well – see e.g. Edwards (2007) – and thus likewise cannot be used for diagnostic of AS.
Resonant UV lines of the C IV, Si IV, N V and O VI uv1 doublets looks as the most suitable lines for diagnostic of CTTSs’s AS, especially lines of C IV 1550 doublet: they are strong in CTTS’s spectra and calculation of their intensities is relatively simple.
2 Intensities of C IV 1550 doublet lines: theory vs. observations
Generally speaking, lines of C Si N+4 and O+5 ions form before and behind the shock front. Gas temperature in the pre-shock (precursor) zone of CTTSs does not exceed 20.000 K, but ions up to O+5 (at km/s) exist here due to photoionization of accreted matter by X-ray and UV quanta from post-shock cooling zone. When infalling gas crosses the shock front its temperature raises up to 1-3 MK and for example C+3 ions almost complitely transform to C+6 ions. Then gas cools and ions of interest appeares again but at that moment gas velocity is very close to zero – see Lamzin (1998) for details.
Lamzin (2003a) carried out non-LTE calculations of profiles of C IV 1550, Si IV 1400, N V 1240 and O VI 1035 doublet lines for a plane-parallel shock viewed at various angles. Calculations were performed for the range of preshock gas parameters appropriate for CTTSs. Intensities of C IV 1548+1551 lines, normalized to value, as a function of cosine of an angle between the normal to the shock front and the line of site are presented in figure 2. The ratio is expressed in percent, such as different lines in fugure respect to different infall gas velocities 300 and 400 km/s). Presented results were calculated for gas particle density cm-3 (left panel) and cm-3 (right panel).
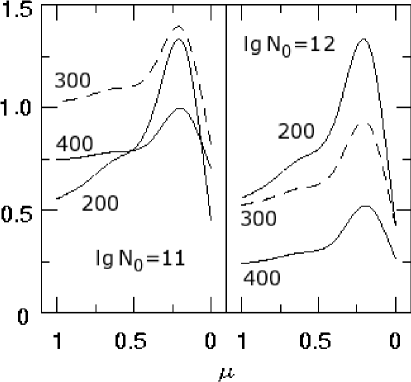
The value was chosen for normalisation because just this value expected to be equal to the bolometric flux of veiling continuum emission produced by AS. Indeed, according to current paradigm a half of X-ray and UV quanta from post-shock cooling zone moves to the stellar surface. These quanta are absorbed in upper layers of stellar atmosphere and then should be reradiated predominantly in the continuum – see Calvet & Gullbring (1998) for details. Thus the ratio depicted in figure 2, is theoretical prediction for ratio of C IV 1550 doublet line flux to bolometric flux of veiling continuum. Thus this ratio expected to be almost independenly on parameters of AS.
Meanwile it was found that observed ratio is much smaller – see table 1 in which we summarised results of our analyses of CTTSs UV spectra observed from Hubble Space Telescope (Kravtsova & Lamzin, 2002a,b; Kravtsova, 2003; Lamzin et al., 2004). The descripancy between the theory and observation is significant – more than two orders of magnitude in the case of RY Tau and DR Tau, such as this conclusion does not depend on current uncertainty of value and law of interstellar extinction in the direction to investigated stars.
| Star: | RY Tau | DR Tau | T Tau | DS Tau | BP Tau | DG Tau | Theory |
|---|---|---|---|---|---|---|---|
| 0.002 | 0.003 | 0.02 | 0.02 | 0.04 | 0.07 |
We suppose that this discrepancy means that the main portion of veiling continuum (up to 99 % in some cases juging from table 1) originates outside C IV 1550 line formation region, i.e. outside strong (Mach number AS. In other words we conclude that the main portion of accreted matter does not pass throught the AS and falls to the star almost parallel to the stellar surface. In this part of accretion flow transformation of kinetic energy of infalling gas into the heat and then into radiation should occur in the same way(s) as in a boundary layer, i.e in a series of weak ( oblique shocks. One can estimate the maximal possible angle between front of the weak oblique shocks and stellar surface as follows.
In the coronal equlibrium approximation C+3 ions forms at K. Such temperature can be reached immediately behind the shock front if accreted gas velocity component normal to stellar surface is km/s. Therefore oblique ASs with less than this value can not contribute to C IV 1550 line emission of accretion flow but produce veiling continuum and emission in lines of neutral, singly or twice ionized atoms. If typical infall gas velocity is km/s, then i.e. gas producing such weak shocks indeed falls to the star almost parallel to its surface.
3 Profiles of C IV 1550 doublet lines: theory vs. observations
As was mentioned above CIV 1550 doublet lines form in two spatially distinct regions of strong AS: in the radiative precursor and in the post-shock zone. Gas velocity in these regions are different: km/s in the pre-shock zone and km/s in the post-shock line formation region. As a result profile of e.g. CIV 1548 line in the spectrum of plane-parallel shock, viewed from the direction perpendicular to the surface of shock front, should have two components: the first one is almost at zero-velocity position and the second is redshifted to As follows from our calculations (Lamzin 2003a), both components are optically thick, resulting in FWHM of each componet km/s, with relative strength depending on at km/s ”zero-velocity” component is stronger than ”high-velocity” one and vice versa at km/s. If the shock is viewed from the direction, that makes an angle with the perpendicular to the shock’s surface, then ”zero-velocity” component should be seen practically at the same position but the redshift of ”high-velocity” peak should be now where The same is true (in a qualitative way) for lines of Si IV 1400, NV 1240 and OVI 1035 doublets.
Consider now a part of CTTS’s surface occupied with strong AS (accretion zone). Observed profile of e.g. CIV 1548 line emitted by AS is a sum (an integral) of double-peaked profiles from all elementary area of the accretion zone (multiplied to factor). All elementary areas are viewed at different angles due to curvature of stellar surface and these angles varies with time due to stellar rotation. One can expect that intensities of ”zero-velocity” components from all parts of accretion zone will be summarised and the (weighted) sum of high-velocity components will results in more or less wide red wing or separated redshifted component depending on distribution of parameters in accretion zone and on its geometry. Obviously the profile should vary with time due to stellar rotation and non-stationary accretion as well.
Lamzin (2003b) calculated profiles of C IV 1550 doublet lines
from strong AS assuming that: 1) matter falls to the star in radial direction;
2) and parameters of the shock are constant within accretion zone;
3) the zone has the shape of circular spot or sperical belt. Results of
the calculations were compared with profiles of the lines in
UV spectra of CTTSs observed with Goddard High Resolution Spectrograph (GHRS)
and Space Telescope Imaging Spectrograph (STIS). Observational data
were extracted from Scientific Archive of Hubble Space Telescope
(http://archive.stsci.edu/hst/
target_descriptions.html).
Calculated profiles differs significantly from observed ones presumbly
because our assumptions about the character of accretion flow
near stellar surface were not realistic enough.
One can expect better agreement if to use parameters of accretion flow derived from 3D MHD simulations of disc accretion to a slowly rotating magnetized young star with its dipole moment inclined at an angle to the stellar rotation axis. Accretion rate polar magnetic field strength as well as mass and radius of the central star are free parameters of these simulations in addition to the angle – see Romanova et al. (2003) for details. Velocity field and gas density at stellar surface, adopted from the simulations, we used as input parameters to calculate profiles of CIV 1550, Si IV 1400, NV 1240 and OVI 1035 doublet lines. For all models we adopted M R kG and varied parameters in the and M⊙/yr intervals respectively. Profiles were calculated for each accretion zone’s model with different values of an angle between stellar rotation axis and the line of sight as well as for a set of phases of stellar rotation periods, i.e. for different angles (in units) between magnetic dipole axis and the plane, which contains rotation axis and the line of sight
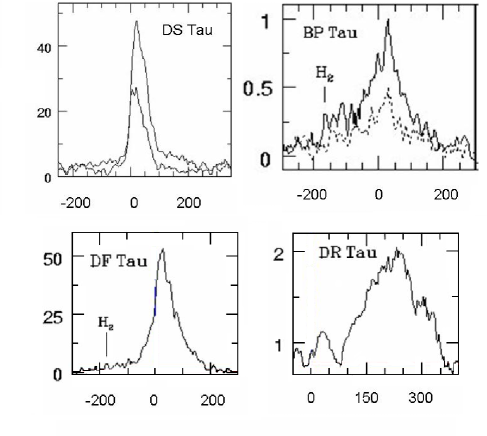
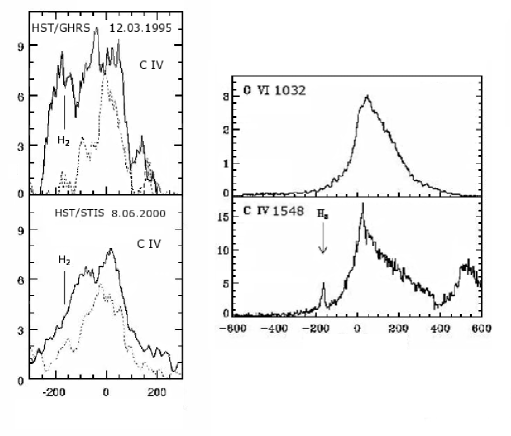
Observed profiles of C IV 1550 doublet lines in DS Tau, BP Tau, DF Tau and DR Tau spectra are shown in figure 3. Solid and dashed lines depicts C IV 1548 and C IV 1551 componens of the doublet. Profiles of C IV 1550 doublet’s components in spectra of T Tau are shown in figure 4 (left column). T Tau is the only star where there is more than one high resolution UV spectrum and one can observe variability of C IV doublet lines profiles. Only in the case of TW Hya (right panel of the figure) there is possibility to obtain information about lines of O VI 1035 doublet – see Ardila (2007) for reference and details.
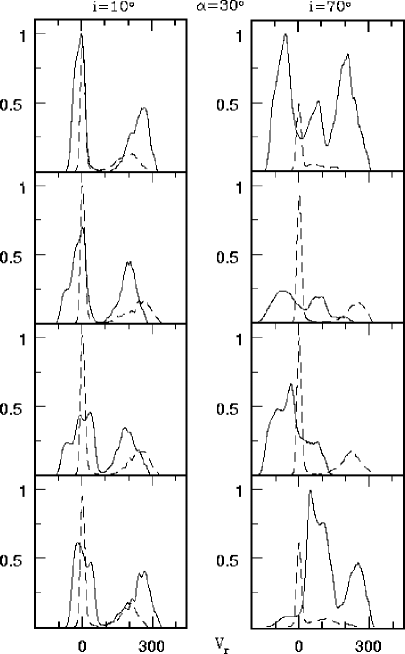
We plot in figure 5 results of our calculations for the model with M⊙/yr, (left panel) and (right panel). Vertical row of profiles in each panel corresponds to the following set of rotation period phases (from top to bottom): 0.25, 0.5, 0.75. Profiles were normalized to maximal intensity of the line at phase. It was assumed that accretion disk does not prevent to observe the part of the star that situated below disk’s midplane – this is the reason why some profiles have extended blue wing.
Matter falls to the star with dipole magnetic field at the angle relative to its surface. In the absence of magnetic field oblique shock should arise in such situation, what means that: 1) the shock front is parallel to stellar surface; 2) velocity component which parallel to stellar radius is the pre-shock velocity But bear in mind that accreted gas moves along magnetic field lines it also seems resonable to suppose that shock front is perpendicular to the magnetic field lines and therefore To avoid discussion of this problem we calculated profiles for both cases: solid lines in figure 5 corresponds to profiles calculated for case and dashed – for case.
Such approach looks resonable at the moment because both types of theoretical profiles differs from profiles of C IV 1548 line in spectra of CTTS presented in figures 3, 4. Observed profiles have only one peak, maximum of which is almost at zero velocity position. The only exception is DR Tau: profile its C IV 1548 line consists of two redshifted components but intensity of ”high-velocity” component is larger than ”low-velocity” one. Theoretical profiles calculated for models with another values of and parameters have qulitatively the same shape as in figure 5, i.e. also can not reproduce observations.
We suppose that the reason of the descripancy is too small divergency of accreted gas stream lines within accretion zone that itself occupies only of stellar surface (Romanova et al., 2003). If divergency of the stream (and therefore magnetic field) lines within accretion zone would be larger then it seems possible to obtain single-peak profile with extended red wing similar to observed ones. Anyway our results indicate that magnetic field of CTTSs is signifificantly non-dipole near stellar surface in agreement with direct magnetic field measurements (Johns-Krull, 2007).
4 Conclusion
We demonstrated that observed intensity and profiles of C IV 1550 doublet lines significantly differ from theoretical predictions based on the assumption that magnetic field of CTTSs near stellar surface is close to dipole. We conclude therefore that geometry of CTTS’s magnetic field near stellar surface is strongly non-dipole. Multipole components of global magnetic field of young star or/and small-scale magnetic fields of active regions probably produce large divergency of accreted gas stream lines within accretion zone that presumbly can explain disagreement between the theory and observations.
We thank the LOC of the Symposium for the invitation, financial support and hospitality.
References
- [1] Ardila D., 2007, this volume, p.103.
- [2] [0.3cm]
- [3] Basri G. & Bertout C., 1989, ApJ 341, 340.
- [4] [0.3cm]
- [5] Calvet N. & Gullbring E., 1998, ApJ 509, 802.
- [6] [0.3cm]
- [7] Edwards S., 2007, this volume, p.171.
- [8] [0.3cm]
- [9] Gómez de Castro A.I. & Lamzin S.A., 1999, MNRAS 304, 41.
- [10] [0.3cm]
- [11] Gómez de Castro A.I. & Verdugo E., 2001, ApJ 548, 976.
- [12] [0.3cm]
- [13] Gómez de Castro A.I. & Verdugo E., 2007, ApJ 654, 91.
- [14] [0.3cm]
- [15] Johns-Krull C., 2007, this volume, p.31.
- [16] [0.3cm]
- [17] Kravtsova A.S., 2003, Astron. Lett. 29, 463.
- [18] [0.3cm]
- [19] Kravtsova A.S. & Lamzin S.A., 2002a, Astron. Lett. 28, 676.
- [20] [0.3cm]
- [21] Kravtsova A.S. & Lamzin S.A., 2002b, Astron. Lett. 28, 835.
- [22] [0.3cm]
- [23] Lamzin S.A., 1995, A A 295, L20.
- [24] [0.3cm]
- [25] Lamzin S.A., 1998, Astron. Rep. 42, 322.
- [26] [0.3cm]
- [27] Lamzin S.A. & Gomez de Castro A.I., 1999, Astron. Lett. 24, 748 .
- [28] [0.3cm]
- [29] Lamzin S.A., 2003, Astron. Rep. 47, 498.
- [30] [0.3cm]
- [31] Lamzin S.A., 2003, Astron. Rep. 47, 540.
- [32] [0.3cm]
- [33] Lamzin S.A., Kravtsova A.S., Romanova M.M., Batalha C., 2004, Astron. Lett. 30, 413.
- [34] [0.3cm]
- [35] Romanova M.M., Ustyugova G.V., Koldoba A.V., Wick J.V., Lovelace R.V.E., 2003, ApJ 595, 1009.
- [36] [0.3cm]
- [37] Romanova M.M., Long M., Kulkarni A.K., Kurosawa R., Ustyugova G.V., Koldoba A.K. & Lovelace R.V.E., 2007, this volume, p.277.
- [38] [0.3cm]
- [39] Zeldovich Ya.B. & Raizer Yu.P., 1966, W.D. Hayes, R.F. Probstein, (eds.), Elements of gasdynamics and the classical theory of shock waves (New York: Academic Press).
- [40] [0.3cm]
- [41]