The Century Survey Galactic Halo Project III: A Complete 4300 deg2 Survey of Blue Horizontal Branch Stars in the Metal-Weak Thick Disk and Inner Halo
Abstract
We present a complete spectroscopic survey of 2414 2MASS-selected blue horizontal branch (BHB) candidates selected over 4300 deg2 of the sky. We identify 655 BHB stars in this non-kinematically selected sample. We calculate the luminosity function of field BHB stars and find evidence for very few hot BHB stars in the field. The BHB stars located at a distance from the Galactic plane kpc trace what is clearly a metal-weak thick disk population, with a mean metallicity of [Fe/H] , a rotation velocity gradient of km s-1 in the region kpc, and a density scale height of kpc. The BHB stars located at kpc are a predominantly inner-halo population, with a mean metallicity of [Fe/H] and a mean Galactic rotation of km s-1. We infer the density of halo and thick disk BHB stars is kpc-3 near the Sun, and the relative normalization of halo to thick-disk BHB stars is % near the Sun.
Subject headings:
stars: early types — stars: horizontal-branch — Galaxy: stellar content — Galaxy: halo1. INTRODUCTION
Theoretical simulations show that the remnants of hierarchical galaxy formation in the Milky Way should still be visible as star streams in the stellar halo (Johnston et al., 1996; Harding et al., 2001; Abadi et al., 2003; Bullock & Johnston, 2005; Font et al., 2006). Star counts and color-magnitude diagrams have proven very effective in identifying structures in the halo, including the Sagittarius stream wrapping around the sky (Majewski et al., 2003) and overdensities in Monoceros (Newberg et al., 2002; Ibata et al., 2003; Yanny et al., 2003), Canis Major (Martin, 2004), Triangulum-Andromeda (Rocha-Pinto et al., 2004), Virgo (Duffau et al., 2006; Vivas & Zinn, 2006; Newberg et al., 2007), and elsewhere (Belokurov et al., 2006; Grillmair & Dionatos, 2006; Grillmair, 2006). Stellar spectroscopy opens up the possibility of finding structures in velocity (such as the Sagittarius dwarf galaxy, e.g. Ibata et al., 1994), in metallicity, and in distance. The major difficulty in mapping the stellar halo is finding tracer stars that are luminous enough to observe at great depths yet common enough to densely sample the halo.
In Brown et al. (2003, hereafter Paper I), we introduced the Century Survey Galactic Halo Project, a photometric and spectroscopic survey from which we selected Blue Horizontal-Branch (BHB) stars as probes of the Milky Way halo. BHB stars are evolved, helium core-burning stars that serve as excellent “standard candles.” In Brown et al. (2005, hereafter Paper II), we explored the Two Micron All Sky Survey (Skrutskie et al., 2006, 2MASS) and the Sloan Digital Sky Survey (Adelman-McCarthy et al., 2006, SDSS) as the basis for a large spectroscopic survey of BHB stars. In Paper II we calculated the first field BHB luminosity function, and concluded that field BHB stars are consistent with populations seen in most globular clusters, but inconsistent with globular clusters that have substantial extended BHBs.
Here we describe a complete, non-kinematically selected sample of BHB stars covering 10% of the entire sky. Our survey is inspired by Brown et al. (2004), in which we photometrically selected BHB candidates from the completed 2MASS catalog. We have now obtained spectroscopy for 2414 2MASS-selected BHB candidates, allowing us to measure velocities and metallicities for stars to a depth of 8 kpc over a 4300 deg2 region. Such a large-area survey is necessary to unambiguously identify halo structure: theoretical simulations predict that star streams cover hundreds of square degrees on the sky (Bullock & Johnston, 2005; Font et al., 2006).
Previous spectroscopic surveys of field BHB stars (Pier, 1983; Sommer-Larsen et al., 1989; Arnold & Gilmore, 1992; Kinman et al., 1994; Wilhelm et al., 1999b; Kinman et al., 2004; Clewley et al., 2004, 2005; Kinman et al., 2007) have identified BHB stars over relatively small fractions of the sky (102 - 103 deg2) compared to the Century Survey Galactic Halo Project. The exception is the sample of 1170 BHB stars observed by the SDSS as mis-identified quasars or as filler objects in low density regions (Sirko et al., 2004a, b; Clewley & Kinman, 2006). In comparison, our spectroscopic survey of BHB stars is cleanly selected and is 100% complete within the selection limits.
Although our large-area spectroscopic survey is a rich source for general studies of the thick-disk and inner-halo populations, here we focus our attention on the properties of the BHB stars. Our goal is to lay the groundwork for a structure analysis to be presented in later paper (in preparation). In §2 we describe spectroscopic observations of stars in the new 4300 deg2 region, and discuss our selection efficiency for BHB stars. In §3 we discuss the global properties of the sample, including the mean galactic rotation and metallicity distribution of the stars. In §4 we calculate the luminosity function of our clean sample of field BHB stars. In §5 we fit for the density distribution of the BHB stars and determine the relative normalization of thick disk to inner halo stars. We conclude in §6.
2. DATA
2.1. Target Selection
Following Brown et al. (2004), we select candidate BHB stars by color from the 2MASS point source catalog (Skrutskie et al., 2006)111Available at http://www.ipac.caltech.edu/2mass/. with and . We use de-reddened colors and magnitudes (Schlegel et al., 1998) to create a clean sample. The color selection is designed to provide a relatively high selection efficiency (40%) for BHB stars, but a reduced completeness for BHB stars. Comparison with the Paper I sample suggests that the color selection samples 67% of the BHB population (Brown et al., 2004).
We select BHB candidates in the magnitude range . Our goal is to sample BHB stars as distant as possible, yet at the uncertainty in exceeds and thus there is little point in going fainter than with 2MASS. We set as our bright limit to avoid thin disk contamination; a typical BHB star with is 2 kpc distant at .
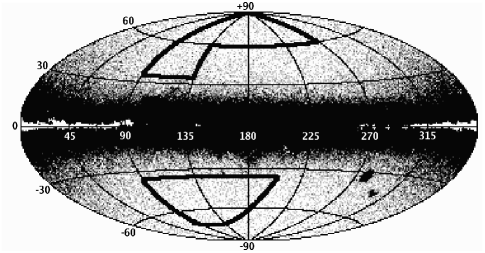
Figure 1, an Aitoff sky map plotted in Galactic coordinates, shows our survey region. The greyscale indicates the number counts of 2MASS BHB candidates in the magnitude range . Our survey region includes the north Galactic cap opposite the bulge , plus an extension to at . In the south, our survey samples a similar region bounded by , , and Dec . The survey areas cover 2136 deg2 in the north Galactic hemisphere and 2190 deg2 in the south Galactic hemisphere.
There are 2414 BHB candidates in our survey region. The average surface density of 2MASS-selected BHB candidates is 0.56 deg-2. Our survey is 100% complete and can identify stars moving at any radial velocity.

2.2. Spectroscopic Observations
Spectroscopic observations were obtained with the FAST spectrograph (Fabricant et al., 1998) on the Whipple 1.5m Tillinghast telescope. Observations were obtained over the course of 48 nights in 2004 and 2005. The spectrograph was operated with a 600 line mm-1 grating and a 2 arcsec slit, providing spectral resolution of 2.3 Å and wavelength coverage from 3450 to 5450 Å. Exposure times were chosen to yield a typical signal-to-noise in the continuum.
Paper I contains details of the data reduction. We use the spectra to measure radial velocities, spectral types, metallicities, effective temperatures, and surface gravities of the 2414 BHB candidates. During the course of this survey we re-observed 30 objects from Paper I. The scatter in the spectroscopic measurements of the same objects provides us with a direct measurement of the uncertainties: km s-1 in velocity, sub-types in spectral classification, dex in [Fe/H], K in effective temperature, and dex in surface gravity.

2.3. BHB Classification
The major difficulty in using BHB stars as probes of Galactic structure is the need to distinguish reliably between low surface-gravity BHB stars and higher surface-gravity A-type dwarfs and blue stragglers. Although investigators once thought blue stragglers were a minor component of the halo population, recent studies (Norris & Hawkins, 1991; Kinman et al., 1994; Preston et al., 1994; Wilhelm et al., 1999b; Brown et al., 2003, 2005) demonstrate that a surprisingly large fraction of faint stars in the color range associated with BHB stars are indeed high-gravity stars, many of which are blue stragglers (Preston & Sneden, 2000; Carney et al., 2005).
Our classification of BHB stars is identical to the approach described in Paper I. In brief, we apply the techniques of Kinman et al. (1994), Wilhelm et al. (1999a), and Clewley et al. (2002, 2004) to identify low surface-gravity BHB stars. Figure 2 displays the results for our sample. We consider objects that satisfy 3 or more of the 4 classification techniques as BHB stars (solid symbols in Figure 2); we identify 779 probable BHB stars.
We expect halo stars to be largely a metal-poor population (e.g., Paper II), yet 124 (16%) of the BHB stars are relatively metal-rich [Fe/H] . Curiously, the BHB stars with [Fe/H] are systematically 0.06 mag bluer in (B V)0, or 600 K hotter, than the more metal-poor BHB stars. Hot BHB stars have weak Ca ii K making metallicity measurements difficult. Furthermore, BHB and main-sequence A stars have similar surface gravities at K, making classification difficult. Thus we consider the [Fe/H] BHB stars suspect and mark them as BHB/A stars in Fig. 2.
Because our goal is to create a clean sample of non thin-disk BHB stars, we consider the 655 probable BHB stars with [Fe/H] as our “clean” sample of BHB stars. This is consistent with Chiba & Beers (2000), who use [Fe/H] to select thick-disk and halo stars by metallicity. We use the clean sample of BHB stars for the following analyses.

2.4. Sample Selection Efficiency
Our net selection efficiency for BHB stars is 27% (655 of 2414), and is a function of both depth and Galactic latitude. Figure 3 plots the fraction of all stars of spectral type A and the fraction of BHB stars as a function of apparent magnitude in our sample. Our color selection is 90% efficient for selecting A-type stars in the interval , but the efficiency plummets to 40% at due to increased photometric errors. Interestingly, the relative fraction of A-type stars identified as BHB stars increases from 30% at to 40% at . The increasing percentage of BHB stars reflects the relative fraction of different stellar populations at different depths in the halo. This behavior is best illustrated in Figure 4, which displays the fraction of all A-types and BHB stars in our sample as a function of Galactic latitude. BHB stars comprise 20% of the entire sample with and 50% of the entire sample with .
The non A-type stars in our sample are mostly early F-type stars scattering into our color-selection region, plus a small number of hot subdwarfs and white dwarfs with blue colors. We classify 46 objects (2% of the sample) as subdwarfs and 21 objects (1% of the sample) as DA white dwarfs. One object, CHSS 3842 (2MASS J010324.54-063210.5), is a hot DB white dwarf.
We present the photometric and spectroscopic parameters for all 2414 stars in Appendix A.
2.5. Variable Stars
We don’t expect to find RR Lyrae variables in our survey because our color selection targets stars bluewards of the horizontal branch instability strip. That said, our spectroscopy shows that 20% of the sample is composed of redder, F-type stars, and our survey is well matched to existing variability surveys such as the All Sky Automated Survey (ASAS, Pojmanski, 2002) and the Northern Sky Variability Survey (NSVS, Woźniak et al., 2004).
We match our entire target list to ASAS and find three variables: two RR Lyraes (CHSS 3168 and CHSS 3704) and one eclipsing binary (CHSS 3341). The NSVS is better matched to our survey region and survey depth. We find 1519 stars with NSVS photometry, of which six have RMS photometric scatter greater than 3 times their median photometric error. Of the six possible NSVS variables, two are RR Lyraes (CHSS 1983 and CHSS 2983) and four show no clear periodicity. Thus our survey contains a total of four known RR Lyraes, all of which fall in the reddest 15% of the sample. The four RR Lyraes are not part of the BHB sample.

2.6. A Possible Accreting White Dwarf
The most unusual object in the sample is CHSS 3134 (2MASS J002334.02+065647.6), possibly an accreting white dwarf. The object is identified as a DA white dwarf in the Berger & Fringant (1980) catalog of blue objects. Our higher-resolution spectrum (see Figure 5), however, shows hydrogen Balmer emission lines in the cores of the absorption lines from H to H10. Be stars have similar spectra, but Be stars usually have Balmer emission in only H and H (e.g., Bragg & Kenyon, 2002). The presence of strong Hei 4471 indicates the star is hot, with K, and the broad Balmer absorption lines indicate the star has high surface gravity. Based on the observed spectrum (Figure 5), this star is possibly a white dwarf accreting matter at low rates from a close binary companion. A white dwarf can dominate the spectrum if mass transfer has reduced its donor star to almost nothing. Alternatively, this star could be a compact binary in which the white dwarf is illuminating a low-mass companion. Further spectroscopic follow-up is needed to establish the exact nature of this unusual system.
3. GLOBAL PROPERTIES
3.1. Disk, Halo Models
Given the location and depth of our sample, we expect our BHB stars to sample both the thick-disk and halo populations. The halo may not be a single entity, and the recent Carollo et al. (2007) analysis of the abundances and kinematics of 20,000 stars from SDSS paints a picture of 1) a flattened inner halo with little or no rotation and with peak metallicity around [Fe/H] , and 2) a more spherical outer halo population that is strongly counter-rotating and with a peak metallicity of around [Fe/H] . Our sample of BHB stars reaches heliocentric distances up to 10 kpc. Thus, in this picture, the majority of our halo stars are associated with the “inner-halo” component of the halo.
To provide context for discussing the properties of our sample, we begin by investigating the expected contribution of the thick-disk and halo populations. Figure 6 shows star-count predictions from Siegel et al. (2002) for the relative contribution of the thin disk, the thick disk, and the halo in our survey volume. The two sets of lines (solid and dashed) illustrate the range allowed by their best-fit parameters (see their Table 6).

Figure 6 shows that while the relative contribution of the thick-disk and halo populations in our survey volume is uncertain, the thin-disk population should be negligible. The star-count models suggest that the thick disk should dominate our survey for kpc, while the inner-halo should dominate for kpc. Given the uncertainties in the normalizations, however, we simply conclude that our survey contains a mix of thick-disk and halo stars, and that the halo contribution increases with distance from the plane.
3.2. Radial Velocities
Figure 7 displays our heliocentric radial velocities, corrected for Solar motion relative to the local standard of rest (Hogg et al., 2005), as a function of spectral type. The large group of stars near A0 are the BHB stars (solid symbols). The other B-type objects are possibly hot BHB stars, blue stragglers, or run-away B stars. The F- and late A-type stars exhibit a smaller velocity dispersion than the BHB stars, consistent with their being mostly nearby stars located in the disk. All of the high velocity stars are probably halo stars. Because our sample covers a large area of the sky, we must remove the effects of Galactic rotation before calculating the line-of-sight velocity dispersion of the halo stars. We calculate velocity dispersion and Galactic rotation below.

3.3. Proper Motions
It would be very interesting to know the full space motions of our stars. We search existing proper motion catalogs and find 703 matches with the US Naval Observatory CCD Astrograph Catalog (Zacharias et al., 2004, UCAC2), 955 matches with the US Naval Observatory B1 Catalog (Monet et al., 2003, USNOB1), and 2414 matches with the Guide Star Catalog 2.3 (GSC2.3, B. McLean, 2005 private communication). We proceed cautiously, however, because our stars are relatively distant, at kpc, and the reported proper motions are typically quite small, 10 mas yr-1.
We compare proper motions between the UCAC2, USNOB1, and GSC2.3 catalogs. The UCAC2 and GSC2.3 proper motions correlate well, but USNOB1 proper motions are systematically discrepant from the other two catalogs for proper motions less than 10 mas yr-1. The UCAC2 appears the most reliable of the three catalogs (see Mink et al., 2004). However, even the UCAC2 may contain systematic errors on the scale of degrees (N. Zacharias, private communication, 2005), making comparison of stars in different parts of the sky problematic. The dispersion of the proper motions between the three catalogs is 7 mas yr-1; we consider this estimate a good measure of the accuracy of the catalogs over large areas of sky.
If we restrict ourselves to proper motions with confidence, the number of stars with proper motions greater than 20 mas yr-1 is approximately 10% of the catalog matches in all three catalogs. We estimate tangential velocities for these stars by combining the proper motions with our distance estimates (see below). The formal uncertainty of the tangential velocities is approximately km s-1. Because the uncertainty greatly exceeds expected stellar velocities, these tangential velocity estimates based on the best proper motions are in practice useless for our analyses. Thus we ignore proper motion in the remainder of our paper.

3.4. Metallicities
The strongest indicator of metallicity in our A-star spectra is the 3933 Å Ca ii K line. We estimate stellar metallicities based on Ca ii as described in Paper I. In brief, we use three different techniques: the spectral line indices of Beers et al. (1999), the equivalent width of Ca ii K plus a chi-square comparison between metallic-line regions in synthetic and observed spectra (Wilhelm et al., 1999a), and a Nelder-Mead algorithm that fits the entire spectrum (Nelder & Mead, 1965; Allende Prieto, 2003). The final metallicities are the average of the three techniques and have formal uncertainties of dex. As mentioned above, we re-observed 30 objects from Paper I and find that their metallicity determinations have a dex RMS scatter.
Figure 8 plots the metallicities and velocities of the BHB and BHB/A stars (left panel) and all the other non-BHB stars (right panel) in our sample. The extra stars at [Fe/H] and 0 are artifacts of our method; our measurements are restricted to [Fe/H] .
Examination of Figure 8 reveals that the BHB stars are more metal-poor than the other stars in our sample. Excluding the stars at the [Fe/H] limits, the BHB stars have a median [Fe/H] . By comparison, the non-BHB stars in our sample are more metal-rich, with a median [Fe/H] . The distributions of metallicity and velocity are consistent with the BHB stars constituting a largely halo population and the non-BHB stars constituting a largely thick-disk population.
3.5. Distances
BHB stars are approximate standard candles with luminosities dependent on effective temperature (color) and on metallicity. We estimate (B V)0, which we label BV0, for our BHB stars using 2MASS photometry and Balmer line strengths (and SDSS photometry, where available), as described in Paper I. We then calculate luminosities for our BHB stars by adapting the relation from Clewley et al. (2004). This relation assumes the Hipparcos-derived zero point, at [Fe/H] = (Gould & Popowski, 1998), a -metallicity slope based on RR Lyrae stars in the Large Magellanic Cloud (Clementini et al., 2003), and a cubic relation in (B V)0 (Preston et al., 1991) to provide a temperature correction. A detailed comparison of the luminosity function of field BHB stars and globular cluster BHB stars in Paper II revealed a systematic 0.3 mag offset of the Clewley et al. relation with respect to the globular clusters. Therefore, we adjust the zero-point 0.3 mag brighter:
| (1) |
Although our zero-point adjustment suggests that the error in the absolute scale of BHB luminosities may be substantial, we expect that the relative BHB luminosities are precise to better than 10% for our sample.
There are also 526 stars with early A spectral types between B8 and A3 that are not BHB stars (see Figure 7). These high surface-gravity stars likely comprise a mix of old blue stragglers and young main-sequence stars: two thirds of the early A-type stars have low mean metallicity [Fe/H] ; one third are consistent with solar metallicity [Fe/H]=0. We use the relation of Sarajedini (1993) and Kinman et al. (1994) to estimate luminosities for the 526 early A-type stars and the 124 BHB/A stars:
| (2) |
This relation is based on a fit to globular cluster blue stragglers of similar spectral type.
We estimate distances using the calculated luminosities and the observed magnitudes. We convert 2MASS magnitudes to magnitudes by taking our estimate and looking up the corresponding in Kenyon & Hartmann (1995) for a star of that color. This conversion adds additional uncertainty to our distance estimates. Thus a typical BHB star with [Fe/H] and has and a distance of 9.3 kpc at our limiting magnitude , with typical uncertainty of 9% in distance. By comparison, a non-BHB, early A-type star with [Fe/H] and has and a distance of 5.0 kpc at our limiting magnitude, with a typical uncertainty of 12% in distance. These distance uncertainties do not include systematic errors.
Stars of later spectral type than the BHB / early A stars are intrinsically less luminous objects in the nearby disk; we exclude these objects from our analysis and do not calculate their luminosities and distances.

3.6. Mean Galactic Rotation
Previous surveys provide conflicting measurements of the stellar halo rotation: it may be prograde (Chiba & Beers, 2000; Sirko et al., 2004b), retrograde (Majewski, 1992; Majewski et al., 1996; Carney et al., 1996; Spagna et al., 2003; Kinman et al., 2004, 2007; Carollo et al., 2007), or nothing at all (Layden et al., 1996; Gould & Popowski, 1998; Martin & Morrison, 1998; Gilmore et al., 2002; Brown et al., 2005). Curiously, measurements of retrograde rotation mostly come from surveys of the north Galactic pole. Differences in the observed halo rotation may also arise from the manner in which different samples have selected from inner-halo and outer-halo populations, which Carollo et al. (2007) argue have quite different rotation characteristics. Our large area survey is ideal for measuring the bulk rotation of the inner stellar halo. Our stars are selected photometrically without any kinematic bias, and our survey is 100% complete over two large contiguous regions.
We calculate mean rotation using the formalism of Frenk & White (1980). We assume the stars are in pure rotation with uniform velocity about the rotation axis of the Galactic disk, and project the observed radial velocity onto the azimuthal (rotation) direction. The Frenk & White (1980) formalism provides an estimate of both rotation velocity and the line-of-sight dispersion for a set of stars.
Figure 9 plots the results of this analysis as a function of . We bin in by binning together 78 stars ordered in , and moving through the sample in steps of 10 stars. We adopt this approach to avoid any effects of arbitrary placement of bins on the results; bins are typically 0.6 kpc in size, growing to kpc at kpc. We consider three different samples of stars: the clean sample of 655 BHB stars (solid line), a combined sample of 344 metal-poor BHB and early A-type stars with [Fe/H] (dashed line), and a combined sample of 541 intermediate metallicity BHB and early A-type stars with [Fe/H] (dotted line). The latter two metallicity cuts are intended to select halo and thick disk stellar populations, respectively, following Chiba & Beers (2000).
All stars rotate well below the solar value; drops monotonically with . This conclusion is valid for stars in the region kpc and kpc. A linear least squares fit to the clean sample of BHB stars yields km s-1. The observed velocity gradient is statistically identical to the km s-1 gradient found for thick disk stars in the region kpc by Chiba & Beers (2000) and by Girard et al. (2006) (see Fig. 9). What is remarkable, however, is that all three of our samples show the same velocity gradient. The metal-poor stars have only a marginally shallower velocity gradient and lower zero-point km s-1 than the intermediate-metallicity stars with km s-1. Thus the mean rotation velocities suggest that our samples contain significant numbers of thick disk stars with kpc.
The BHB and A stars located at kpc have km s-1, consistent with the rotation measured from faint F and G stars at similar distances (Gilmore et al., 2002; Wyse et al., 2006). Gilmore et al. (2002) argue that a single, coherent thick disk should have a constant rotation velocity far from the plane, and thus the observed intermediate 100 km s-1 rotation is evidence for a merger origin for the thick disk. However, our sample clearly contains a mix of stellar populations with different kinematics: the metal-poor sample has a systematically larger line-of-sight velocity dispersion than the intermediate metallicity sample at a given .
The lower panel of Figure 9 plots the line-of-sight velocity dispersion of the stars as a function of . The line-of-sight velocity dispersion of the clean BHB sample is statistically consistent with a constant value of km s-1. This is consistent with the 100 km s-1 velocity dispersion measured for thick disk stars at the same depth towards the south Galactic pole (Girard et al., 2006). Yet the metal-poor sample of stars has , consistent with a more halo-dominated population. Clearly, our BHB stars are a mix of thick-disk and halo populations. We note that the drop in velocity dispersion at kpc seen in the metal-poor stars, though not statistically significant, may in fact be a real feature due to velocity structure in the sample.
We find no evidence for significant rotation of the inner halo in the range kpc. Figure 9 shows that the formal values dip below zero in the region kpc, but the uncertainties are large (note the error bars in Fig. 9). Interestingly, the final bins of both the clean BHB sample and the [Fe/H] BHB and A star sample have values around zero. In the volume kpc, the clean BHB sample contains 131 stars with a formal km s-1, while the metal-poor sample contains 76 stars with a formal km s-1.

3.7. The Metal-Weak Thick Disk
The thick disk is generally understood to have a metallicity distribution that peaks around [Fe/H] (e.g. Gilmore et al., 1995; Allende Prieto et al., 2006). This conclusion is at odds with the low metallicity of our BHB stars located at . Figure 10 plots the position and metallicity of our clean sample of BHB stars. Solid squares are the average metallicity found in bins of 50 stars. BHB stars located at kpc have an average metallicity of [Fe/H] ; including the BHB/A stars increases the average metallicity only slightly, to [Fe/H] . The average metallicity of BHB stars in our sample with kpc is [Fe/H] . The small numbers of stars in this region prevent a determination of a significant metallicity gradient, however it is interesting that the average metallicity is lower than one might have expected from a canonical halo population with peak metallicity [Fe/H] (Carney et al., 1996). It may be that we are seeing evidence for the transition of inner- to outer-halo populations in this interval, as suggested by Carollo et al. (2007).
One explanation for both the low metallicity and the thick-disk-like kinematics (Figure 9) of our BHB stars at kpc is provided by the existence of a metal-weak thick disk (e.g., Norris et al., 1985; Morrison et al., 1990; Chiba & Beers, 2000; Beers et al., 2002). BHB stars are associated with metal-poor populations, such as globular clusters, thus it may be that our survey for BHB stars preferentially traces the metal-weak thick disk. In any case, the existence of very metal-poor BHB stars with thick-disk kinematics presents another clue for formation scenarios of the Milky Way.
A linear least-squares fit to the BHB stars located at kpc reveals a weak metallicity gradient, d[Fe/H]/d (solid line in Figure 10), consistent with zero. Previous studies find no evidence for a vertical metallicity gradient in the more commonly studied (metal-rich) thick disk (Gilmore et al., 1995; Allende Prieto et al., 2006).
4. LUMINOSITY FUNCTION OF BHB STARS
Understanding the luminosity function of field BHB stars is important for interpreting our maps of the Galactic halo. BHB stars have a distribution of intrinsic luminosities, thus we sample different luminosity BHB stars to different depths. The luminosity function describes the number of BHB stars per unit volume in the luminosity interval to . While we must infer a star’s luminosity from its color and metallicity, the relation (Eqn. 1) specifies only how a particular color and metallicity map to a particular . We emphasize that it is the observed distribution of BHB colors and metallicities that determines the form of the luminosity function. Paper II presents a more extensive discussion of this issue and the underlying physics.
We calculate the field BHB luminosity function using the Efstathiou et al. (1988) non-parametric maximum-likelihood method. An important feature of this method is that the density terms drop out, thus the luminosity function calculation is unbiased by density variations. In other words, the maximum-likelihood method does not require knowledge of the halo density distribution , it only requires that the luminosity function is independent of position in the volume sampled. Because stellar density varies with position in the Milky Way, we compute only the form of the luminosity function and arbitrarily normalize the luminosity function to one.

Figure 11 plots the luminosity function of the clean sample of BHB stars (dashed line). The luminosity function rises steeply at bright luminosities, peaks at , and falls rapidly with a tail at faint luminosities. Although our statistics are greatly improved over the field BHB luminosity function measured in Paper II, we caution that our BHB sample is incomplete for stars .
In principle, we can correct for our sample incompleteness. The Paper I sample is complete over a much broader range of color than our 2MASS-selected sample. Thus the Paper I sample can provide us with the distribution of BHB colors with that are missing from our 2MASS-selected sample. We estimate the luminosities of the missing, redder BHB stars as follows. First, we determine the distribution of BV0 colors of our stars as a function of . Second, we determine the distribution of [Fe/H] for BHB stars with colors near . Third, we construct cumulative distributions of BV0 and [Fe/H] from our observations, and then sample these distributions to obtain the expected distribution of ’s for the missing stars. Finally, we correct the luminosity function bins for the appropriate fraction of missing stars as determined from the Paper I sample.
Figure 11 plots the BHB luminosity function corrected for incompleteness (solid line). The effect of the incompleteness correction is to increase the fraction of redder, more luminous stars, and thus shift the peak of the distribution to . We also plot the corrected luminosity function for the combined sample of BHB and BHB/A stars. Because the BHB/A stars have [Fe/H] and bluer colors, on average, than the BHB stars, they are intrinsically under-luminous and fall entirely in the faint tail of the luminosity function. These stars are possibly hot extended BHB stars, though such a strong preference for high metallicities is not observed in globular clusters. For example, NGC 7078 has [Fe/H] (Harris, 1996) and contains a large number of extended BHB stars. Even if the BHB/A stars are all BHB stars, it is clear from Figure 11 that extended BHB stars are not a significant fraction of the field BHB population.


5. DENSITY DISTRIBUTION OF FIELD BHB STARS
Our sample of BHB stars can potentially provide an excellent measure of the density distribution of the thick-disk and inner-halo stellar populations. Traditionally, the Galaxy’s density distribution is measured with star counts. The star-count technique is powerful because can use photometric catalogs containing millions of stars (e.g. Siegel et al., 2002; Larsen & Humphreys, 2003). However, stellar populations are a complex function of both color and apparent magnitude. Thus star-count techniques suffer from uncertainties in stellar color-luminosity relations, as well as contamination from binaries and non-stellar objects. By comparison, our survey provides a very clean sample of spectroscopically identified BHB stars. Although the numbers of BHB stars is much smaller than samples of stars used by star counts, our spectra provide precise metallicity and distance determinations for every star.
We begin by considering the volume of space sampled by our survey. Using the BHB luminosity function, we calculate the fraction of stars at a given distance that fall within our survey magnitude limits. We expect that our survey is more than 50% complete for BHB stars in the range kpc. This range of heliocentric distance samples the region kpc and kpc for our predominantly high Galactic-latitude survey region. Thus we restrict our density distribution analysis to the above ranges of , , and . There are 544 BHB stars that fall within these ranges.
Before calculating the density distribution, we correct the observed BHB sample for incompleteness. First, the BHB luminosity function tells us the fraction of stars missing at each distance . Because of our restriction in distance, this correction applies to only a handful of stars near the boundaries of the sample. Second, the ratio of the observed and corrected luminosity functions tells us the fraction of BHB stars missing at each because of our color selection; we weight stars at a given appropriately. Finally, we use Figure 3 to estimate the fraction of faint BHB stars missing because of increased photometric errors, and give additional weight to stars with .
We assume the density distribution is a sum of a thick-disk and halo population with the canonical forms:
| (3) |
where and is the halo axial ratio. These are the same relations used by Siegel et al. (2002) in their fits to star counts. Selecting a power-law halo instead of a de Vaucouleurs halo is mostly a cosmetic choice; our BHB sample provides very little leverage on the halo density profile. Our sample is a high Galactic-latitude sample best suited to measuring and the relative normalizations of thick disk and halo BHB star densities.
Girard et al. (2006) caution that distance uncertainties, convolved with the sharply falling density distribution of stars, can alter the “observed” density distribution from the actual, intrinsic form. Thus, we mimic their procedure, and artificially partition each star into 100 positions in distance, with a distribution of distances described by a Gaussian distribution around the best value for each star. We then apply our limits in , , and to the subunits. This procedure allows stars that would otherwise be excluded by distance cuts to contribute a small amount of weight appropriate to the uncertainty in their distance estimate. We bin the subunits into volumes at fixed intervals and , and perform our density fits to these bins using minimization techniques (Press et al., 1992).
We start by testing fits to the different components of our BHB sample. The density distribution of stars located at kpc and kpc are very similar. In the final fit we consider stars above and below the plane together as a function of . We try different bin sizes and different ranges of and , and find that stars located at kpc prefer thick-disk scale lengths in the ranges kpc and . Unfortunately, stars located farther out, at kpc, provide very little constraint on the form of the halo profile. If we fix the core radius to kpc (Girard et al., 2006) and the halo axial ratio to (Robin et al., 2000; Siegel et al., 2002), our sample prefers an halo power-law index in the range .
We fit Equation 3 to the full BHB sample, holding fixed and fitting the other 6 parameters. Table 1 gives the best-fit parameters and Figure 12 shows the results. Figure 12a plots the observed density of BHB stars at kpc, the best-fit density distribution (solid line), and the thick-disk and halo components (dotted lines). Figure 12b plots the fraction of thick-disk and halo stars in our survey volume located ; the components contribute equal fractions of BHB stars at kpc.
We map out contours of to understand the uncertainty in our best-fit parameters. We caution that our sample provides little constraint on , and that there is a significant degeneracy between the thick-disk scale length, , and the halo power law index . Star-count models give similar results to our best-fit halo power-law index (Robin et al., 2000; Siegel et al., 2002, e.g.). In contrast, Chiba & Beers (2000) find from their spectroscopic sample of metal-poor stars. Given the uncertainties, however, our BHB stars provide no significant constraint on the shape of the halo. What we can measure with certainty is the normalization of halo to thick disk BHB stars.
The density of halo and thick disk BHB stars is kpc-3 near the Sun kpc, in good agreement with Green & Morrison (1993)’s lower limit of kpc-3. Kinman et al. (1994) report a three times smaller density of 30 kpc-3, but their sample has little constraint on thick disk BHB stars that dominate the BHB density near the Sun. We find that the relative normalization of halo to thick disk BHB stars is near the Sun.
| Param | Value | Units |
|---|---|---|
| kpc-3 | ||
| kpc | ||
| kpc | ||
| kpc-3 | ||
| kpc | ||
Our high-latitude sample also provides a good constraint on the vertical density distribution of BHB stars in the thick disk. To obtain a self-consistent picture of the relationship between the thick-disk scale lengths and , we fix the form of the halo power law (see Table 1), vary and across a grid of values, and fit only the normalizations. This approach results in contours of illustrated in Figure 13. The contours do not correspond to exact significance levels, but we have chosen the inner contour to match our best estimate of 1 significance based on boot-strap resampling. The asterisk in Figure 13 marks our best-fit values of and .
Previous star-count models for the thick disk find either a large scale height (1.2 - 1.4 kpc) and low normalization (Gilmore & Reid, 1983; Morrison et al., 2000; Reid & Majewski, 1993; Jurić et al., 2005) or a smaller scale height (0.75 - 1.0 kpc) and high normalization (Robin et al., 1996; Siegel et al., 2002; Robin et al., 2003; Cabrera-Lavers et al., 2005; Du et al., 2006; Girard et al., 2006). Our scale height is consistent with the larger scale heights.

The thick-disk scale length is interesting because it determines the rotational-equilibrium of thick disk stars. Star-count estimates range from kpc (Robin et al., 1996, 2003) to kpc (Larsen & Humphreys, 2003). Our scale length, kpc, falls in the middle of this range, similar to determinations from Siegel et al. (2002) and Jurić et al. (2005). This agreement shows the power of a clean, even if small, spectroscopic sample. If our BHB stars preferentially trace the metal-weak thick disk, then the density parameters in Table 1 reflect the density distribution of the metal-weak thick disk.
6. CONCLUSIONS
We discuss a complete spectroscopic survey of 2414 2MASS-selected BHB candidates over 4300 deg2 of sky. We identify 655 BHB stars in this non-kinematically selected sample. The luminosity function of the field BHB stars has a median value of and a small tail extending to , but shows very few extended BHB stars.
The BHB stars located at kpc have a mean Galactic rotation and density distribution remarkably consistent with a metal-weak thick-disk population. The kpc BHB stars have a mean metallicity of [Fe/H] , a velocity gradient of km s-1, and a vertical scale height of kpc. We infer a space density of kpc-3 thick disk BHB stars near the Sun. RR Lyrae stars, by comparison, have a much less prominent disk component near the Sun (Martin & Morrison, 1998). The existence of metal-poor BHB stars with thick-disk kinematics and scale heights present another clue for formation scenarios of the Milky Way.
The BHB stars located at kpc have a mean Galactic rotation and density distribution consistent with a predominantly halo population. The halo BHB stars have a mean metallicity of [Fe/H] , a mean Galactic rotation of km s-1, and relative normalization of % with respect to the thick disk near the Sun kpc. This is the best currently available measurement of the relative normalization of the halo and thick disk, an important quantity that enters into all models of the local structure of the Galaxy.
In the future, having established the global properties of our survey, we hope to analyze the BHB sample for structure in space, velocity, and metallicity.
References
- Abadi et al. (2003) Abadi, M. G., Navarro, J. F., Steinmetz, M., & Eke, V. R. 2003, ApJ, 597, 21
- Adelman-McCarthy et al. (2006) Adelman-McCarthy, J. K. et al. 2006, ApJS, 162, 38
- Allende Prieto (2003) Allende Prieto, C. 2003, MNRAS, 339, 1111
- Allende Prieto et al. (2006) Allende Prieto, C., Beers, T. C., Wilhelm, R., Newberg, H. J., Rockosi, C. M., Yanny, B., & Lee, Y. S. 2006, ApJ, 636, 804
- Arnold & Gilmore (1992) Arnold, R. & Gilmore, G. 1992, MNRAS, 257, 225
- Beers et al. (2002) Beers, T. C., Drilling, J. S., Rossi, S., Chiba, M., Rhee, J., Führmeister, B., Norris, J. E., & von Hippel, T. 2002, AJ, 124, 931
- Beers et al. (1999) Beers, T. C., Rossi, S., Norris, J. E., Ryan, S. G., & Shefler, T. 1999, AJ, 117, 981
- Belokurov et al. (2006) Belokurov, V. et al. 2006, ApJ, 642, L137
- Berger & Fringant (1980) Berger, J. & Fringant, A.-M. 1980, A&AS, 39, 39
- Bragg & Kenyon (2002) Bragg, A. E. & Kenyon, S. J. 2002, AJ, 124, 3289
- Brown et al. (2003) Brown, W. R., Allende Prieto, C., Beers, T. C., Wilhelm, R., Geller, M. J., Kenyon, S. J., & Kurtz, M. J. 2003, AJ, 126, 1362 (Paper I)
- Brown et al. (2004) Brown, W. R., Geller, M. J., Kenyon, S. J., Beers, T. C., Kurtz, M. J., & Roll, J. B. 2004, AJ, 127, 1555
- Brown et al. (2005) Brown, W. R., Geller, M. J., Kenyon, S. J., Kurtz, M. J., Allende Prieto, C., Beers, T. C., & Wilhelm, R. 2005, AJ, 130, 1097 (Paper II)
- Bullock & Johnston (2005) Bullock, J. S. & Johnston, K. V. 2005, ApJ, 635, 931
- Cabrera-Lavers et al. (2005) Cabrera-Lavers, A., Garzón, F., & Hammersley, P. L. 2005, A&A, 433, 173
- Carney et al. (1996) Carney, B. W., Laird, J. B., Latham, D. W., & Aguilar, L. A. 1996, AJ, 112, 668
- Carney et al. (2005) Carney, B. W., Latham, D. W., & Laird, J. B. 2005, AJ, 129, 466
- Carollo et al. (2007) Carollo, D. et al. 2007, preprint astro-ph/0706.3005
- Chiba & Beers (2000) Chiba, M. & Beers, T. C. 2000, AJ, 119, 2843
- Clementini et al. (2003) Clementini, G., Gratton, R., Bragaglia, A., Carretta, E., Di Fabrizio, L., & Maio, M. 2003, AJ, 125, 1309
- Clewley & Kinman (2006) Clewley, L. & Kinman, T. D. 2006, MNRAS, 371, L11
- Clewley et al. (2004) Clewley, L., Warren, S. J., Hewett, P. C., Norris, J. E., & Evans, N. W. 2004, MNRAS, 352, 285
- Clewley et al. (2002) Clewley, L., Warren, S. J., Hewett, P. C., Norris, J. E., Peterson, R. C., & Evans, N. W. 2002, MNRAS, 337, 87
- Clewley et al. (2005) Clewley, L., Warren, S. J., Hewett, P. C., Norris, J. E., Wilkinson, M. I., & Evans, N. W. 2005, MNRAS, 362, 349
- Du et al. (2006) Du, C., Ma, J., Wu, Z., & Zhou, X. 2006, MNRAS, 372, 1304
- Duffau et al. (2006) Duffau, S., Zinn, R., Vivas, A. K., Carraro, G., Méndez, R. A., Winnick, R., & Gallart, C. 2006, ApJ, 636, L97
- Efstathiou et al. (1988) Efstathiou, G., Ellis, R. S., & Peterson, B. A. 1988, MNRAS, 232, 431
- Fabricant et al. (1998) Fabricant, D., Cheimets, P., Caldwell, N., & Geary, J. 1998, PASP, 110, 79
- Font et al. (2006) Font, A. S., Johnston, K. V., Bullock, J. S., & Robertson, B. E. 2006, ApJ, 638, 585
- Frenk & White (1980) Frenk, C. S. & White, S. D. M. 1980, MNRAS, 193, 295
- Gilmore & Reid (1983) Gilmore, G. & Reid, N. 1983, MNRAS, 202, 1025
- Gilmore et al. (1995) Gilmore, G., Wyse, R. F. G., & Jones, J. B. 1995, AJ, 109, 1095
- Gilmore et al. (2002) Gilmore, G., Wyse, R. F. G., & Norris, J. E. 2002, ApJ, 574, L39
- Girard et al. (2006) Girard, T. M., Korchagin, V. I., Casetti-Dinescu, D. I., van Altena, W. F., López, C. E., & Monet, D. G. 2006, AJ, 132, 1768
- Gould & Popowski (1998) Gould, A. & Popowski, P. 1998, ApJ, 508, 844
- Green & Morrison (1993) Green, E. M. & Morrison, H. L. 1993, in ASP Conf. Ser. 48, The Globular Cluster-Galaxy Connection, ed. G. H. Smith & J. P. Brodie (San Francisco: ASP), 318
- Grillmair (2006) Grillmair, C. J. 2006, ApJ, 645, L37
- Grillmair & Dionatos (2006) Grillmair, C. J. & Dionatos, O. 2006, ApJ, 643, L17
- Harding et al. (2001) Harding, P., Morrison, H. L., Olszewski, E. W., Arabadjis, J., Mateo, M., Dohm-Palmer, R. C., Freeman, K. C., & Norris, J. E. 2001, AJ, 122, 1397
- Harris (1996) Harris, W. E. 1996, AJ, 112, 1487
- Hogg et al. (2005) Hogg, D. W., Blanton, M. R., Roweis, S. T., & Johnston, K. V. 2005, ApJ, 629, 268
- Ibata et al. (1994) Ibata, R. A., Gilmore, G., & Irwin, M. J. 1994, Nature, 370, 194
- Ibata et al. (2003) Ibata, R. A., Irwin, M. J., Lewis, G. F., Ferguson, A. M. N., & Tanvir, N. 2003, MNRAS, 340, L21
- Johnston et al. (1996) Johnston, K. V., Hernquist, L., & Bolte, M. 1996, ApJ, 465, 278
- Jurić et al. (2005) Jurić, M. et al. 2005, preprint, astro-ph/0510520
- Kenyon & Hartmann (1995) Kenyon, S. J. & Hartmann, L. 1995, ApJS, 101, 117
- Kinman et al. (2004) Kinman, T. D., Bragaglia, A., Cacciari, C., Buzzoni, A., & Spagna, A. 2004, Memorie della Societa Astronomica Italiana, 75, 36
- Kinman et al. (2007) Kinman, T. D., Cacciari, C., Bragaglia, A., Buzzoni, A., & Spagna, A. 2007, MNRAS, 375, 1381
- Kinman et al. (1994) Kinman, T. D., Suntzeff, N. B., & Kraft, R. P. 1994, AJ, 108, 1722
- Larsen & Humphreys (2003) Larsen, J. A. & Humphreys, R. M. 2003, AJ, 125, 1958
- Layden et al. (1996) Layden, A. C., Hanson, R. B., Hawley, S. L., Klemola, A. R., & Hanley, C. J. 1996, AJ, 112, 2110
- Majewski (1992) Majewski, S. R. 1992, ApJS, 78, 87
- Majewski et al. (1996) Majewski, S. R., Munn, J. A., & Hawley, S. L. 1996, ApJ, 459, L73
- Majewski et al. (2003) Majewski, S. R., Skrutskie, M. F., Weinberg, M. D., & Ostheimer, J. C. 2003, ApJ, 599, 1082
- Martin (2004) Martin, J. C. 2004, AJ, 128, 2474
- Martin & Morrison (1998) Martin, J. C. & Morrison, H. L. 1998, AJ, 116, 1724
- Mink et al. (2004) Mink, D. J., Brown, W. R., & Kurtz, M. J. 2004, in ASP Conf. Ser. 314: Astronomical Data Analysis Software and Systems (ADASS) XIII, ed. F. Ochsenbein, M. G. Allen, & D. Egret (San Francisco: ASP), 141
- Monet et al. (2003) Monet, D. G. et al. 2003, AJ, 125, 984
- Morrison et al. (1990) Morrison, H. L., Flynn, C., & Freeman, K. C. 1990, AJ, 100, 1191
- Morrison et al. (2000) Morrison, H. L., Mateo, M., Olszewski, E. W., Harding, P., Dohm-Palmer, R. C., Freeman, K. C., Norris, J. E., & Morita, M. 2000, AJ, 119, 2254
- Nelder & Mead (1965) Nelder, J. A. & Mead, R. 1965, Computer Journal, 7, 308
- Newberg et al. (2007) Newberg, H. J., Yanny, B., Cole, N., Beers, T. C., Re Fiorentin, P., Schneider, D. P., & Wilhelm, R. 2007, ApJ, in press
- Newberg et al. (2002) Newberg, H. J. et al. 2002, ApJ, 569, 245
- Norris et al. (1985) Norris, J., Bessell, M. S., & Pickles, A. J. 1985, ApJS, 58, 463
- Norris & Hawkins (1991) Norris, J. E. & Hawkins, M. R. S. 1991, ApJ, 380, 104
- Pier (1983) Pier, J. R. 1983, ApJS, 53, 791
- Pojmanski (2002) Pojmanski, G. 2002, Acta Astronomica, 52, 397
- Press et al. (1992) Press, W. H., Teukolsky, S. A., Vetterling, W. T., & Flannery, B. P. 1992, Numerical recipes in C. The art of scientific computing (Cambridge: University Press, 2nd ed.)
- Preston et al. (1994) Preston, G. W., Beers, T. C., & Shectman, S. A. 1994, AJ, 108, 538
- Preston et al. (1991) Preston, G. W., Shectman, S. A., & Beers, T. C. 1991, ApJ, 375, 121
- Preston & Sneden (2000) Preston, G. W. & Sneden, C. 2000, AJ, 120, 1014
- Reid & Majewski (1993) Reid, N. & Majewski, S. R. 1993, ApJ, 409, 635
- Robin et al. (1996) Robin, A. C., Haywood, M., Creze, M., Ojha, D. K., & Bienayme, O. 1996, A&A, 305, 125
- Robin et al. (2000) Robin, A. C., Reylé, C., & Crézé, M. 2000, A&A, 359, 103
- Robin et al. (2003) Robin, A. C., Reylé, C., Derrière, S., & Picaud, S. 2003, A&A, 409, 523
- Rocha-Pinto et al. (2004) Rocha-Pinto, H. J., Majewski, S. R., Skrutskie, M. F., Crane, J. D., & Patterson, R. J. 2004, ApJ, 615, 732
- Sarajedini (1993) Sarajedini, A. 1993, in ASP Conf. Ser. 53: Blue Stragglers, ed. R. A. Saffer, 14
- Schlegel et al. (1998) Schlegel, D. J., Finkbeiner, D. P., & Davis, M. 1998, ApJ, 500, 525
- Siegel et al. (2002) Siegel, M. H., Majewski, S. R., Reid, I. N., & Thompson, I. B. 2002, ApJ, 578, 151
- Sirko et al. (2004a) Sirko, E. et al. 2004a, AJ, 127, 899
- Sirko et al. (2004b) —. 2004b, AJ, 127, 914
- Skrutskie et al. (2006) Skrutskie, M. F. et al. 2006, AJ, 131, 1163
- Sommer-Larsen et al. (1989) Sommer-Larsen, J., Christensen, P. R., & Carter, D. 1989, MNRAS, 238, 225
- Spagna et al. (2003) Spagna, A., Cacciari, C., Drimmel, R., Kinman, T., Lattanzi, M. G., & Smart, R. L. 2003, in ASP Conf. Ser. Vol. 298, 137
- Vivas & Zinn (2006) Vivas, A. K. & Zinn, R. 2006, AJ, 132, 714
- Wilhelm et al. (1999a) Wilhelm, R., Beers, T. C., & Gray, R. O. 1999a, AJ, 117, 2308
- Wilhelm et al. (1999b) Wilhelm, R., Beers, T. C., Sommer-Larsen, J., Pier, J. R., Layden, A. C., Flynn, C., Rossi, S., & Christensen, P. R. 1999b, AJ, 117, 2329
- Woźniak et al. (2004) Woźniak, P. R. et al. 2004, AJ, 127, 2436
- Wyse et al. (2006) Wyse, R. F. G., Gilmore, G., Norris, J. E., Wilkinson, M. I., Kleyna, J. T., Koch, A., Evans, N. W., & Grebel, E. K. 2006, ApJ, 639, L13
- Yanny et al. (2003) Yanny, B. et al. 2003, ApJ, 588, 824
- Zacharias et al. (2004) Zacharias, N., Urban, S. E., Zacharias, M. I., Wycoff, G. L., Hall, D. M., Monet, D. G., & Rafferty, T. J. 2004, AJ, 127, 3043
Appendix A DATA TABLES
Tables 2 and 3 contain the photometric and spectroscopic measurements for the 2414 2MASS-selected BHB candidates. Our survey boundaries include 100 objects previously observed as part of Papers I and II. We include the previously published objects in Tables 2 and 3 for completeness. Tables 2 and 3 are presented in their entirety in the electronic edition of the Astronomical Journal. A portion of the tables are shown here for guidance regarding their format and content.
Table 2 summarizes photometry and positions. Column (1) is our identifier. The designation CHSS stands for Century Halo Star Survey and is chosen to be unique from previous surveys. Column (2) is the J2000 right ascension in hours, minutes, and seconds. Column (3) is the J2000 declination in degrees, arcminutes, and arcseconds. Column (4) is the extinction-corrected 2MASS magnitude. Columns (5) and (6) are the extinction-corrected 2MASS colors and . Column (7) is the reddening value from Schlegel et al. (1998). Columns (8) and (9) are the Galactic coordinates, in degrees. Column (10) is our color predicted from 2MASS photometry and Balmer line strengths (and SDSS photometry, where available).
Table 3 summarizes the spectroscopic and stellar parameters. We include all the DA white dwarfs and subdwarfs in this table, but we omit their stellar parameters as our analysis is meaningless for these objects. We also omit stellar parameters for a few dozen objects with unusually low signal-to-noise spectra. Column (1) is our identifier. Column (2) is the heliocentric radial velocity in km s-1. Column (3) is the spectral type, where B0=10, A0=20, F0=30, and so forth. Column (4) is the effective temperature in K. Column (5) is the surface gravity in cm s-2. Column (6) is the metallicity given as the logarithmic [Fe/H] ratio relative to the Sun. Column (7) is our classification: BHB = blue horizontal branch star, BHB/A = possible blue horizontal branch star with [Fe/H] , A = high surface gravity, early A-type star, DA = DA white dwarf, sd = subdwarf. Column (8) is the absolute magnitude estimated from Equations 1 and 2 for BHB and A stars, respectively. Column (9) is the estimated distance in kpc. Absolute magnitude and distance estimates are only provided for BHB and A-type stars, as described in Section 3.5.
| ID | (mag) | (mag) | (mag) | (mag) | (deg) | (deg) | (mag) | ||
|---|---|---|---|---|---|---|---|---|---|
| (1) | (2) | (3) | (4) | (5) | (6) | (7) | (8) | (9) | (10) |
| CHSS 3014 | 0:01:29.2 | 16:01:51 | 0.037 | 105.787 | |||||
| CHSS 3015 | 0:01:31.4 | 18:36:09 | 0.033 | 106.753 | |||||
| CHSS 3016 | 0:01:32.9 | 22:58:26 | 0.079 | 108.220 | |||||
| CHSS 3017 | 0:01:59.2 | 25:01:07 | 0.088 | 108.964 |
Note. — Table 2 is presented in its entirety in the electronic edition of the Astronomical Journal. A portion is shown here for guidance and content.
| Dist | ||||||||
|---|---|---|---|---|---|---|---|---|
| ID | (km s-1) | Type | (K) | (cm s-2) | [Fe/H] | Class | (mag) | (kpc) |
| (1) | (2) | (3) | (4) | (5) | (6) | (7) | (8) | (9) |
| CHSS 3014 | 7644 | 3.26 | BHB | |||||
| CHSS 3015 | 7356 | 3.54 | ||||||
| CHSS 3016 | 8388 | 3.51 | BHB | |||||
| CHSS 3017 | 8195 | 4.20 | A |
Note. — Table 3 is presented in its entirety in the electronic edition of the Astronomical Journal. A portion is shown here for guidance and content.