Development of a new analysis technique to measure low radial-order p modes in spatially-resolved helioseismic data
Abstract
In order to take full advantage of the long time series collected by the GONG and MDI helioseismic projects, we present here an adaptation of the rotation-corrected -averaged spectrum technique in order to observe low radial-order solar p modes. Modeled profiles of the solar rotation demonstrated the potential advantage of such a technique [1, 2, 3]. Here we develop a new analysis procedure which finds the best estimates of the shift of each of a given () multiplet, commonly expressed as an expansion in a set of orthogonal polynomials, which yield the narrowest mode in the -averaged spectrum. We apply the technique to the GONG data for modes with and show that it allows us to measure lower-frequency modes than with classic peak-fitting analysis of the individual- spectra.
1 Introduction
In the search for long-lived, low-order p modes, the classic methods of peak-fitting the individual- spectra fail because of the decrease in mode amplitudes and increase in solar convective motions (solar noise) as the frequency decreases, reducing the signal-to-noise ratio (hereafter SNR) of those modes. Instead, various pattern-recognition techniques have been developed in an effort to reveal the presence of modes in the low-frequency range. In the case of spatially-resolved helioseismic data (for example observations collected by the space-based SOHO/MDI instrument and the ground-based multi-site GONG network), -averaged spectra appeared to be a powerful tool. They were employed early in the development of helioseismology [1], but have been replaced by fitting the -spectra individually as the quality of the data improved. Years later, in order to fully take advantage of the long-duration helioseismic MDI and GONG instruments, -averaged spectra corrected by the modeled solar rotation were used to detect new low radial-order p modes and to put some upper limits on the detectability of the g modes [2, 3]. These authors demonstrated the potential advantage of such rotation-corrected -averaged spectra. We present here an adaptation of the -averaged spectrum technique in which the -dependent shift parameters are determined.
2 Observation of long-lived, low signal-to-noise-ratio modes
The accurate observation of low-frequency modes is a difficult task because of two main reasons. First, the amplitude of the acoustic modes decreases as the mode inertia increases as the frequency decreases, while the “solar noise” from incoherent, convective motions increases; thus the SNR of those modes is progressively reduced. Second, these low-frequency p modes have very long lifetimes, as much as several years. These two effects together render the observation of such low-amplitude and long-lived modes a difficult task to achieve. However, thanks to several long-duration space- and ground-based instruments, more than 11 years of high-quality helioseismic data are available today. The observation of low radial-order solar p modes is becoming possible if we can somehow improve the SNR of these modes.
The classic peak-fitting analysis consists of fitting the individual- spectra of a given multiplet (), either individually or simultaneously. Such fitting methods fail to obtain reliable estimates of the mode parameters when the SNR is very low. Instead, for a given multiplet (), the mean of low-SNR spectra can result in an average spectrum with a SNR 1 once the individual- spectra are corrected for the rotation- and structure-induced shifts. A model of the solar rotation can be used [1, 2, 3] or, as described in this paper, we can also determine the shifts as we are searching for the low-frequency modes.
3 Determination of the splitting coefficients and figures-of-merit
The -averaged spectrum is obtained by finding the best estimates of the splitting coefficients, commonly called -coefficients, which yield the narrowest peak in the averaged spectrum. The -coefficients are individually estimated through an iterative process. Then, for a given mode (), the frequency shift is parameterized by a set of coefficients, as:
| (1) |
where are the splitting coefficients, and corresponds to the Clebsch-Gordan polynomial expansion [4].


For a particular order of the coefficients , a range of values is scanned around the current value, while the other s are kept fixed. For each scanned value of , the individual- spectra are shifted by the corresponding Clebsch-Gordan polynomials, and the mean of these shifted spectra is taken. The mean of independent power densities, which has a with more than 2 d.o.f. statistics, can be correctly fitted with a Maximum-Likelihood Estimator (MLE) minimization code developed for spectra following a with 2 d.o.f. statistics if the SNR of each -spectrum is comparable [5]. The mean power spectrum is then MLE fitted by a Lorenztian profile and its Full-Width-at-Half-Maximum (FWHM) determined. When all of the scans are performed, the corresponding FWHMs can be seen as a figure-of-merit (FOM). As shown on Fig. 1, the FOMs of the s clearly show well-defined minima, the peak profile getting narrower as the -coefficients converge to their best estimates. The uncertainties () are defined as the formal uncertainties of the fits to the minima.
This iterative procedure is performed until the difference between two iterations in each of the computed coefficients falls below a given threshold ( nHz). A more realistic and detailed description of the different effects responsible for lifting the degeneracy of the mode frequency into multiplets needs the use of more splitting coefficients in Eq. 1 than we have shown here, and is currently underway.
Finally, the mode parameters (central frequency, linewidth, ) are extracted by fitting the -averaged spectrum once the individual- spectra are corrected by the best estimates of the splitting coefficients. However, the formal uncertainties must be normalized by [5]. But this a-posteriori error normalization is correct only if the spectra of a given () mode have the same SNR. The SNRs of the -spectra inside a multiplet are not the same in our data, and the uncertainties of the mode parameters have to be taken as a lower limit only.
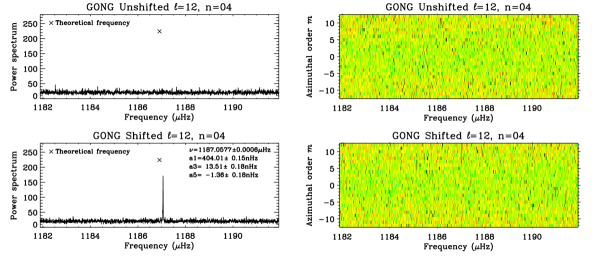
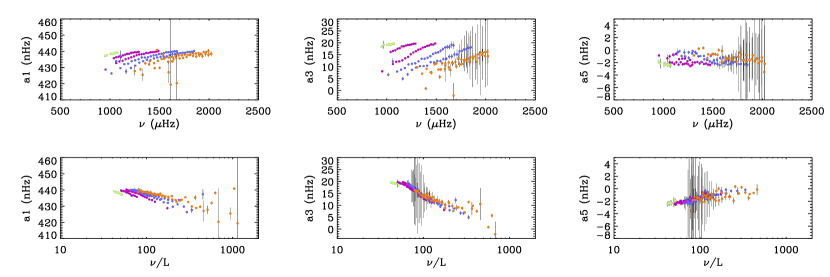
Figure 2 illustrates the advantage of using the -averaged spectrum technique in the case of the mode at 1187 Hz for 2088 days of GONG data111Same observational timespan as used by [8]., where the -averaged spectra before and after the correction of the -spectra for the splitting coefficients are presented. The fitted central frequency (i.e. ) and -coefficients (determined as on Fig. 1) of the mode are also given on Fig. 2. The corresponding diagram before correction (upper-right panel on Fig. 2) does not show any high SNR structure, while after correction (lower-right panel on Fig. 2), one can see that the individual- spectra line up. The whole set of estimated shifts , , and of the low-frequency modes with and measured in the 2088-day GONG set are shown on Fig. 3.
4 Comparison with other measurements
In the routine analysis, the GONG and MDI projects use two separate peak-finding pipelines to extract the mode parameters. Those pipelines, developed in the early 1990s and mostly unchanged since, provide mode parameters on a routine basis. Time series of 108 days are used by the GONG project [6], while the MDI project uses 72-day time series [7]. Recently, a new and independent peak-finding method of the individual- spectra, optimized to take advantage of the long, spatially-resolved, helioseismic time series available today for both GONG and MDI projects, has been developed [8].
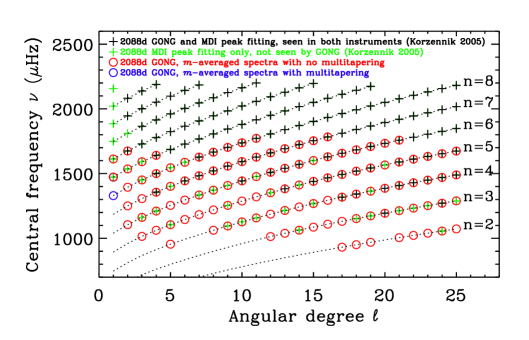
This new peak-fitting pipeline has been used to extract the low- and medium-degree () mode parameters on both GONG and MDI observations using one 2088-day long time series, as well as using five overlapping segments of 728 days [8]. In order to compare our results obtained with the -averaged spectrum technique, we applied the procedure described in Sec. 3 to the same 2088 days of GONG observations. Only modes which passed the so-called H0 hypothesis statistical test [3] were kept. Figure 4 shows the diagram of the low-frequency modes measured with the two different analysis. The observed modes with the present method are represented by the open circles (GONG data only), contrasted with the crosses (both GONG and MDI data) [8]. As seen in Fig. 4, the -averaged spectrum technique allows us to measure a significantly larger number of low-frequency modes in GONG data down to 900 Hz, and to fill in the gaps in the diagram obtained by fitting the individual- spectra [8]. This -averaged spectrum technique is clearly effective in the low-frequency range where classic peak-fitting methods are limited by the low signal-to-noise ratio of each individual- component.
5 Conclusion - Perspectives
We developed a new method to measure low-frequency solar p modes in spatially-resolved helioseismic observations. The -averaged spectrum technique, in which we determine the correction for the splitting coefficients (i.e., -coefficients), allows us to measure lower frequencies in GONG data than with classic peak-fitting methods of the individual- spectra, which are limited by the low signal-to-noise ratio of these low-radial order modes. We are currently in the process of generalizing the method with a larger number of -coefficients, both odd and even orders. We are also going to apply this technique to the MDI data. The lower level of background noise in the MDI data should allow us to measure even lower low-frequency modes than with GONG observations.
This work utilizes data obtained by the Global Oscillation Network Group (GONG) program, managed by the National Solar Observatory, which is operated by AURA, Inc. under a cooperative agreement with the National Science Foundation. The data were acquired by instruments operated by the Big Bear Solar Observatory, High Altitude Observatory, Learmonth Solar Observatory, Udaipur Solar Observatory, Instituto de Astrofísica de Canarias, and Cerro Tololo Interamerican Observatory. This work has been supported by the NASA SEC GIP grant NAG5-11703.
References
References
- [1] Brown, T. M. 1985, Nature, 317, 591
- [2] Schou, J. 2004, ESA SP-559: SOHO 14 Helio- and Asteroseismology: Towards a Golden Future, 559, 134 \nonumSchou, J. 2002, ESA SP-508: From Solar Min to Max: Half a Solar Cycle with SOHO, 508, 99 \nonumSchou, J. 1998, ESA SP-418: Structure and Dynamics of the Interior of the Sun and Sun-like Stars SOHO 6/GONG 98, 418, 341
- [3] Appourchaux, T., et al. 2000, ApJ, 538, 401
- [4] Riztwoller, M. H., & Lavely, E. M. 1991, ApJ, 369, 557
- [5] Appourchaux, T. 2003, A&A, 412, 903
- [6] Anderson, E. R., Duvall, T. L., Jr., & Jefferies, S. M. 1990, ApJ, 364, 699
- [7] Schou, J. 1992, Ph.D. Thesis, Aarhus Univ.
- [8] Korzennik, S. G. 2005, ApJ, 626, 585