Inflows and Outflows in the Dwarf Starburst Galaxy NGC 5253: High-Resolution H I Observations
Abstract
Very Large Array and Parkes 64 m radiotelescope 21-cm observations of the starburst dwarf galaxy NGC 5253 reveal a multi-component non-axisymmetric H I distribution. The component associated with the stellar body shows evidence for a small amount of rotational support aligned with the major axis, in agreement with optically measured kinematics and consistent with the small galaxian mass. Approximately 20–30% of the H I emission is associated with a second component, an H I “plume” extending along the optical minor axis to the southeast. We consider outflow, inflow, and tidal origins for this feature. Outflow appears improbable, inflow is a possibility, and tidal debris is most consistent with the observations. Thus, kinematics of the H I that include this feature are not indicative of the dynamical mass or the local velocity dispersion of the cold gas. These H I observations also reveal a filamentary third component that includes an 800 pc diameter H I shell or bubble to the west of the nucleus, coinciding with an H shell. The mass of H I in the shell may be as large as M⊙. This large mass, coupled with the lack of expansion signatures in the neutral and ionized gas ( km s-1), suggests that this feature may be an example of a starburst-blown bubble stalled by interaction with a massive neutral envelope. Many other H I kinematic features closely resemble those seen in H emission from the ionized gas, supporting the interpretation of neutral and ionized gas outflow at velocities of 30 km s-1. Comparison between extinction estimates from the Balmer emission-line decrement and the H I column densities suggest a gas-to-dust ratio 2–3 times the Galactic value in this low-metallicity () galaxy.
1 Introduction
NGC 5253 is a remarkable starbursting dwarf galaxy with a prominent minor axis dust lane located in the nearby Centarus A/M 83 galaxy complex (Karachentsev et al., 2007) . At visual wavelengths, the impression of NGC 5253 is dominated by its network of ionized gas filaments which extend across its minor axis and reach beyond the stellar distribution (Hodge, 1966; Graham, 1981; Caldwell & Phillips, 1989; Marlowe et al., 1995; Martin, 1998). X-ray observations reveal several small starburst-heated bubbles but no monolithic superbubble or galactic wind (Strickland & Stevens, 1999; Summers et al., 2004). It harbors an extremely luminous, compact, obscured site of nuclear star formation containing several star clusters with masses from – having ages yrs (Gonzalez-Riestra et al., 1987; Calzetti et al., 1997; Vanzi & Sauvage, 2004; Martín-Hernández et al., 2005). Much of the nucleus is obscured by high levels of patchy dust extinction up to mag (Aitken et al., 1982; Moorwood & Glass, 1982; Alonso-Herrero et al., 2004). Radio-wave continuum and recombination line studies have revealed a dominant luminous ( ), compact (r=1 pc), young ( Myr) star cluster that appears to be gravitationally bound and potentially destined to evolve into a globular cluster (Beck et al., 1996; Turner et al., 1998; Gorjian et al., 2001; Mohan et al., 2001). The centimeter-wave spectral energy distribution is consistent with an optically-thick thermal Bremsstrahlung source111Turner, Beck, & Ho (2000) term this object a “supernebula” while Kobulnicky & Johnson (1999) use the name “ultra-dense H II regions” (UDHII) by analogy with the Galactic ultra-compact H II regions Wood & Churchwell (1989). having densities exceeding cm-3 and emission measures cm-6 pc powered by Lyman continuum photons s-1. Caldwell & Phillips (1989) studied the star formation history of NGC 5253 and determined that the light was dominated by a young component with an age between 108 and 109 yrs. Recent studies have concluded that all of the UV-selected star clusters in NGC 5253 have estimated ages 20 Myr, indicating that either the star formation episode began very recently or else that the timescale for dynamical disruption of star clusters is very short (Tremonti et al., 2001; Harris et al., 2004). The overall gas-phase metallicity of NGC 5253 is 12+ (about 1/4 solar), but some of the central regions contain an excess of nitrogen, consistent with local “pollution” from Wolf-Rayet star winds (Walsh & Roy, 1989; Kobulnicky et al., 1997; López-Sánchez et al., 2007).
When observed at low resolution, the distribution and kinematics of its neutral interstellar medium suggest that the H I in NGC 5253 either rotates about the minor axis or flows radially along the minor axis (Kobulnicky & Skillman, 1995). Turner, Beck, & Hurt (1997) and Meier et al. (2002) report the detection of molecular gas clouds having kinematics consistent with infall along the minor axis dust lane. These peculiar gas kinematics may hold clues to the mechanism that triggered the present burst of star formation.
In this paper we present 21-cm aperture synthesis observations from the National Radio Astronomy Observatory’s Very Large Array222The National Radio Astronomy Observatory is operated by Associated Universities, Inc. (AURA) under cooperative agreement with the National Science Foundation. (VLA) and the Parkes 64 m radio telescope to investigate the conditions in the interstellar medium that have produced such extreme star formation. NGC 5253 is an ideal environment to seek the causes of extreme star formation because the burst is so young and, presumably, feedback from the energetic star clusters has not yet had a dramatic impact on the surrounding ISM.
The distance to NGC 5253 is somewhat controversial and has been measured in many studies including Saha et al. (1995) (4.1 0.5 Mpc), Gibson et al. (2000) (3.3 Mpc), Freedman et al. (2001) (3.250.2 Mpc), Karachentsev et al. (2002) (3.90.5 Mpc), Thim et al. (2003) (4.00.3 Mpc), and Sakai et al. (2004) (3.8 0.2 Mpc). The distances based on Cepheid variables strongly depend on the sample selection (Gibson et al., 2000; Thim et al., 2003) and so we prefer the TRGB distance of 3.8 Mpc (Sakai et al., 2004) which implies an angular scale of 18.4 pc arcsec-1.
2 Observations
2.1 VLA
NGC 5253 was observed in the 21-cm line of neutral hydrogen using the for approximately 6 hours in the BnA configuration on 1995 September 25, 3 hours in the CnB configuration on 1996 January 28, and 2 hours in the DnC configuration on 1996 June 10. The 2IF correlator configuration with Hanning smoothing yielded a total bandwidth of 1.56 MHz (327 km s-1) and 128 12.2 kHz (2.58 km s-1) spectral channels. Intermittent observations of the compact radio source 1316-336 were used to phase calibrate the data, and observations of 3C286 were used for flux calibration. The data were reduced with NRAO’s package following standard procedures for editing bad time ranges and performing phase, flux, and bandpass calibrations. The radio continuum flux was subtracted in the UV plane using offline channels to produce a continuum-free 21-cm line UV dataset. Data from each configuration were calibrated separately, and then the UV data were combined after subtracting continuum. These combined data were then used to map the emission from the 1420 MHz transition of neutral hydrogen with greatly enhanced angular resolution and sensitivity compared to the 45-minute DnC configuration observations presented by Kobulnicky & Skillman (1995).
The UV data were mapped to the image plane at two different resolutions and CLEANed (Clark, 1980; Högbom, 1974) with resulting clean synthesized beamsizes of 9.0″7.6″ and 17″15″ to emphasize both the small scale structures and diffuse H I features, respectively. The RMS noise levels in these maps are 1.2 mJy beam-1 and 1.7 mJy beam-1, respectively, slightly larger than the theoretical noise of 1.0 mJy. Because the angular extent of H I in NGC 5253 (′; Kobulnicky & Skillman (1995)) is much smaller than the primary beam size at 21 cm, no primary beam correction was applied. The low-resolution cube was used as a template in which regions having emission exceeding 2 in at least two adjacent channels were marked. The low resolution cube was then used to blank the higher resolution cube on a channel-by-channel basis outside the areas of probable emission. This approach preserves low-level 1–2 emission peaks, many of them real, in the final high-resolution data cube used for subsequent analysis.
2.2 Parkes
NGC 5253 was observed with the Parkes 64 m radio telescope in the 21-cm line of neutral hydrogen on 1997 February 12 using a total bandwidth of 8 MHz (1600 km s-1) and 2048 channels of 0.0039 MHz (0.82 km s-1) centered at km s-1. The primary beam angular diameter is 16′. We interleaved on-band spectra with frequency-switched off-band spectra centered at km s-1 to obtain emission-free H I profiles. A 9-pointing (3x3) grid with 14′ spacings centered on NGC 5253 was used to search for extended emission surrounding NGC 5253, but only the central position showed a strong 21-cm detection. The data for left and right circular polarizations were reduced by subtracting the frequency-switched reference spectrum from the source and fitting a low-order polynomial to remove any residual baseline. The system temperature averaged 33 K and the mean rms noise in the resulting spectra is 0.06 K per channel. We observed the Galactic H II region S8 as a flux calibration standard and scaled the observed temperatures to match the 76 K reported by Kalberla et al. (1982).
3 Analysis of the New H I Observations
3.1 Total H I and Line Profiles
Figure 1 shows the 21-cm emission line profile (top panel) of NGC 5253 from the Parkes 64 m telescope (dotted line), the D configuration short-baseline data (solid line) and the B+C configuration high-resolution data cube (dashed line) as described above. The lower panel shows the 21-cm absorption line profile from the longest baselines of the B configuration against the compact thermal radio continuum source associated with the super star cluster in the nucleus (Turner et al., 1998). The integrated single-dish H I flux is 43.9 Jy km s-1, equivalent to a neutral hydrogen mass of M⊙ at a distance of 3.8 Mpc, assuming,
| (1) |
The D configuration data recovers 77% of this total, implying the presence of some M⊙ of neutral hydrogen distributed smoothly on scales larger than ′, the largest structures visible in 2 hours to the at 21 cm in the D configuration (Ulvestad et al., 2006). The high-resolution data cube contains 42% of the single-dish flux, or about M⊙. Therefore, H I column densities measured from this cube will be lower limits to the true values which may be larger by a factor of order .
The 21-cm absorption spectrum in the lower panel of Figure 1 shows a broad absorption line spanning at least 80 km s-1 with a maximum optical depth of near km s-1. The velocity of maximum optical depth is redshifted km s-1 compared to the 21-cm emission profile peak at km s-1. This is consistent with the central radio supernebula lying behind the bulk of the cool atomic gas and the latter having a net radial velocity toward the nucleus, as suggested from the kinematics of the cold molecular clouds by Meier et al. (2002). Adopting (Dickey & Lockman, 1990),
| (2) |
where is the 21-cm optical depth, is the spin temperature and is the velocity full width at half maximum of the 21-cm absorption line, we can estimate the column density, , of neutral hydrogen in front of the compact nuclear radio supernebula. Because the solid angle probed by the absorption and emission spectra are vastly different, we do not have an estimate of the spin temperature for this gas, so we adopt a lower limit of K (Dickey & Lockman, 1990). The overall width of the feature is consistent with an abundance of cold H I clouds in front of the nucleus over a range of velocities km s-1. Therefore, we adopt a lower limit of km s-1. The resulting H I column densities are cm-2 at this location.
3.2 The H I Distribution at High Resolution
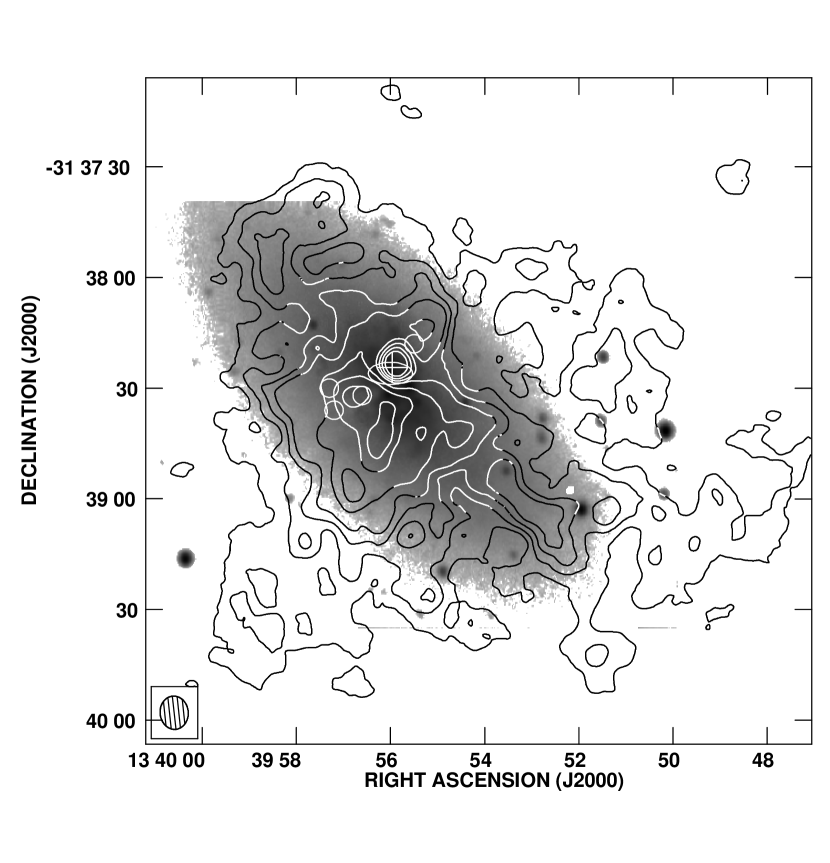
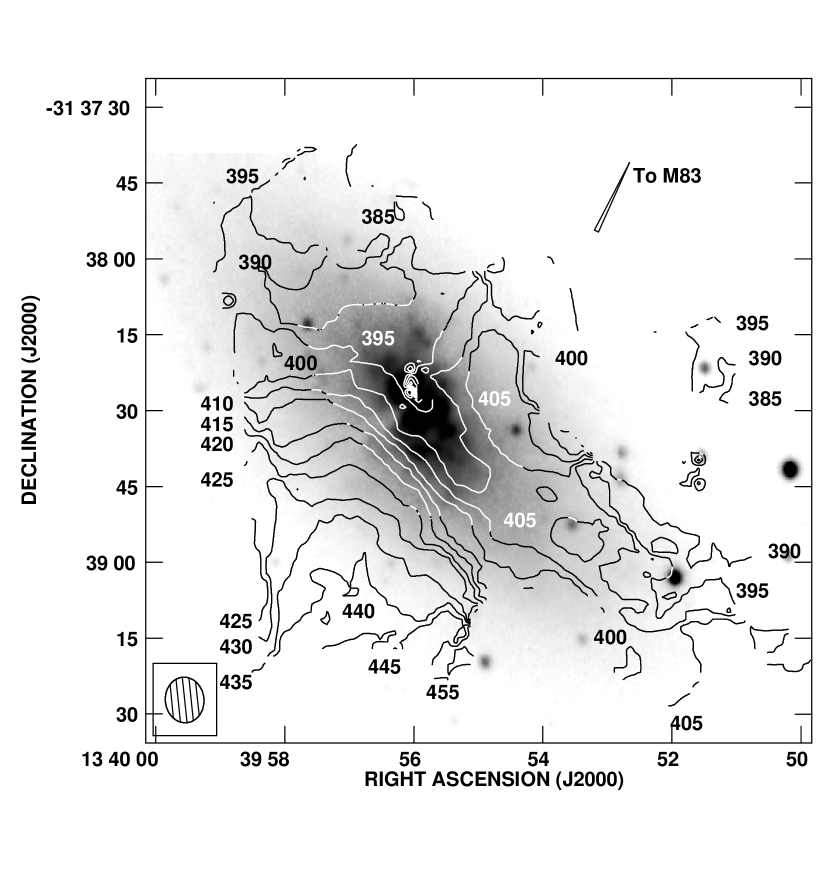
Figure 2 shows the integrated H I column density (contours) overlaid on a 6450 Å optical continuum image of NGC 5253 (greyscale). The inset at lower left depicts the 9.0″7.6″ synthesized beam. Contours show 21-cm line fluxes of 0.04, 0.08, 0.12, 0.16, 0.24, 0.36, and 0.40 Jy km s-1 corresponding to beam-averaged H I column densities of 6, 12, 18, 24, 36, 52, and 64 cm-2. A cross marks the location of the dominant embedded star cluster and thermal radio supernebula (Turner et al., 1998) where H I appears in absorption. The H I column density peaks near 6.4 cm-2 at 15″ (270 pc) south-southeast of radio supernebula and near the dust lane which coincides with the position of several molecular clouds (Meier et al., 2002).
As noted by Kobulnicky & Skillman (1995), the H I distribution in NGC 5253 does not closely follow the optical morphology. Rather, the H I is extended along the minor axis to the southeast and northwest. Note that at this higher resolution, it is clear that the extended gas is not symmetrically placed along the minor axis. The extension to the southeast is a much more prominent feature, and we designate this as the H I “plume”. These new data also reveal arc-like extensions of H I to the west of the nucleus, suggestive of a partial shell or bubble of neutral hydrogen. There are also extensions of H I to the NE and SW that generally follow the optical major axis.
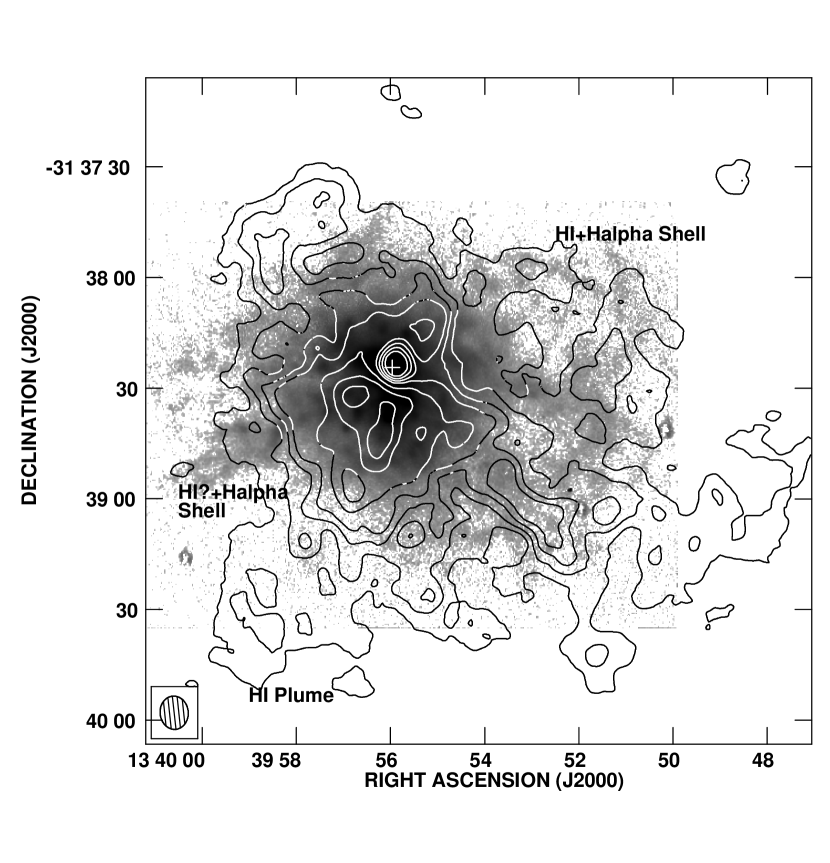
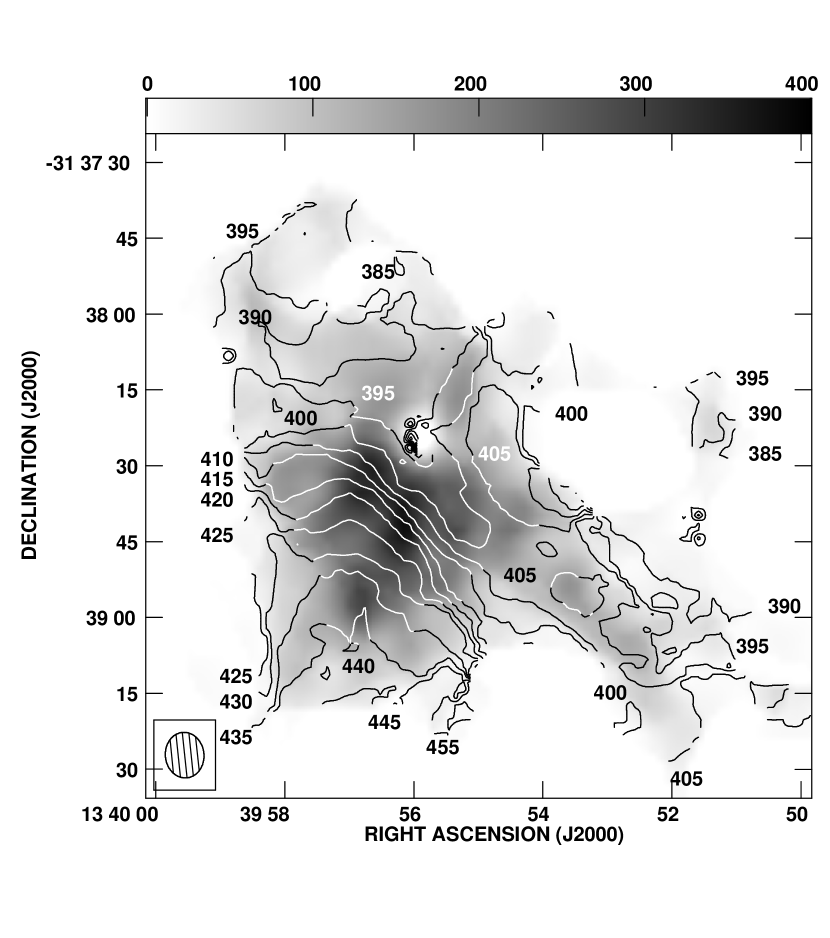
Figure 3 depicts the integrated H I column density (contours) overlaid on an image (greyscale). Here we note that the morphology of the H I shell to the west corresponds closely to the morphology of the shell at position angle of about 70° as seen from the central radio supernebula. The morphology of the H I to the east appears to mimic the H emission in the inner parts of the galaxy where the H I peak column densities coincide with the H peaks. Also in the east, similar to in the west, there is an H extension that appears to be outlined in H I (at a position angle of about 100°). However, further from the center, this correlation breaks down. Specifically, the bright H I plume, at a position angle of about 140° does not have a corresponding strong H emission feature.
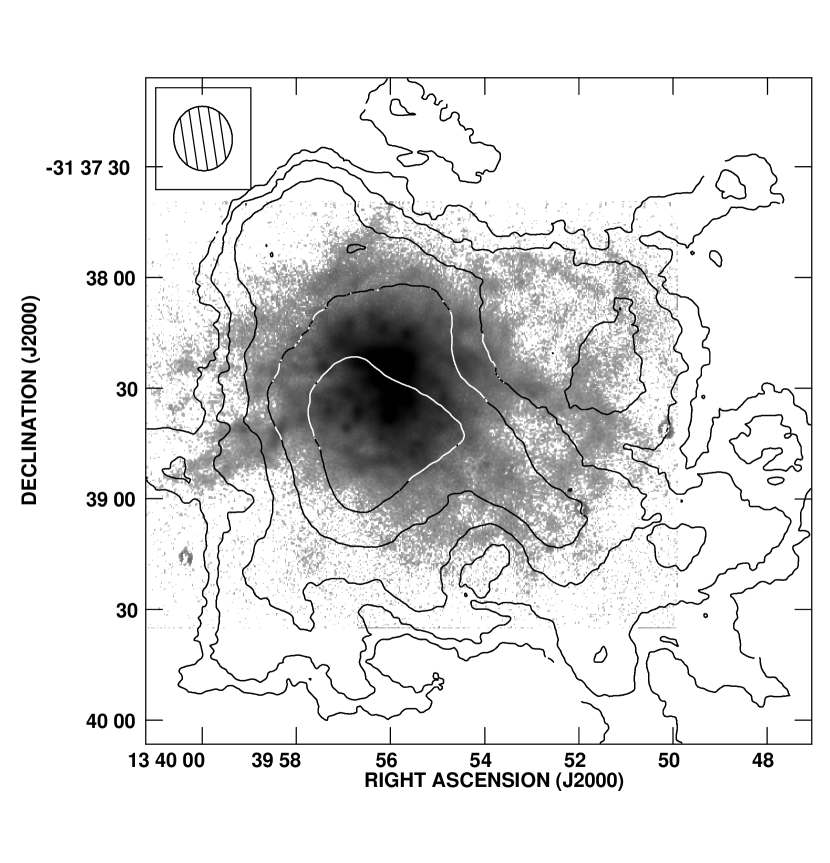
Figure 4 depicts the integrated H I column density (contours and greyscale) at a lower resolution of 16″ useful for identifying lower column density features. A few additional features appear in this figure. The H I extension to the west now appears more clearly and shows the same open shell geometry as the H. At this lower resolution, it is now possible to see that there is H I at a large radius from the center but on the same position angle as the center of the western open shell. This looks reminiscent of simulations of bubbles that achieve break-out (Mac Low & Ferrara, 1999). Also, at lower resolution, the eastern extension looks more like the same open shell morphology and also follows the H.
In summary, the integrated H I maps reveal three neutral gas components that will become more clear in the velocity channel maps below: 1) extensions to the NE and SW that follow the optical major axis, 2) an H I plume to the SE that extends well beyond the optical extent of the galaxy, and 3) open shells in the west and east, and
3.3 The H I Kinematics
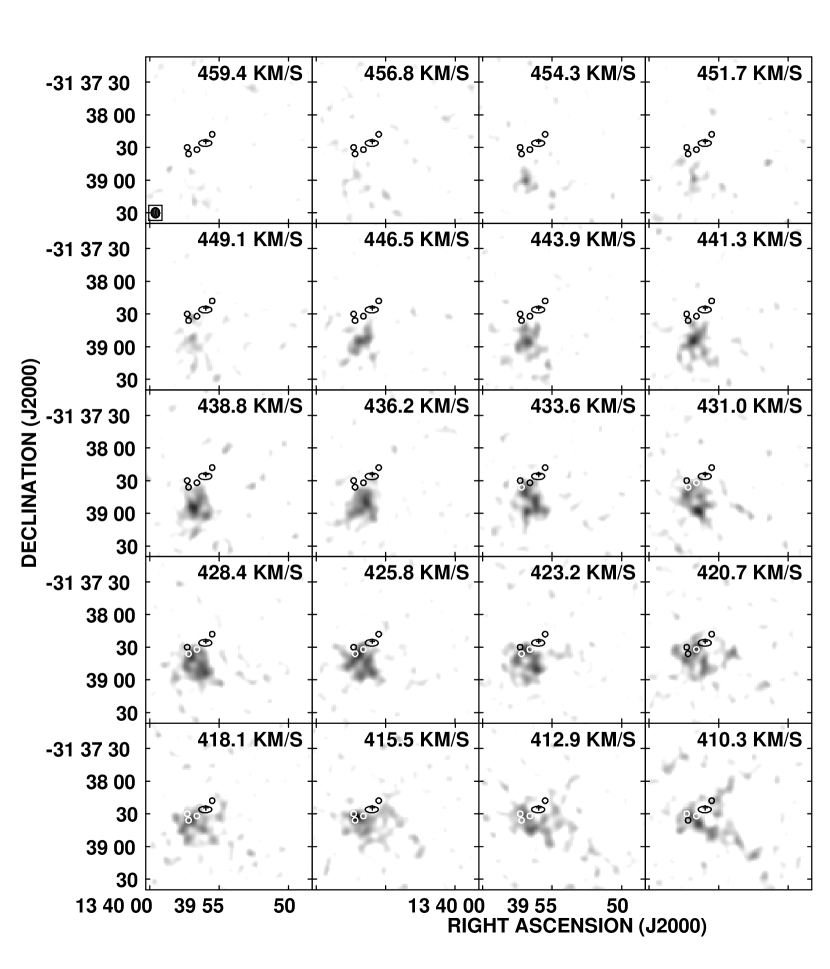
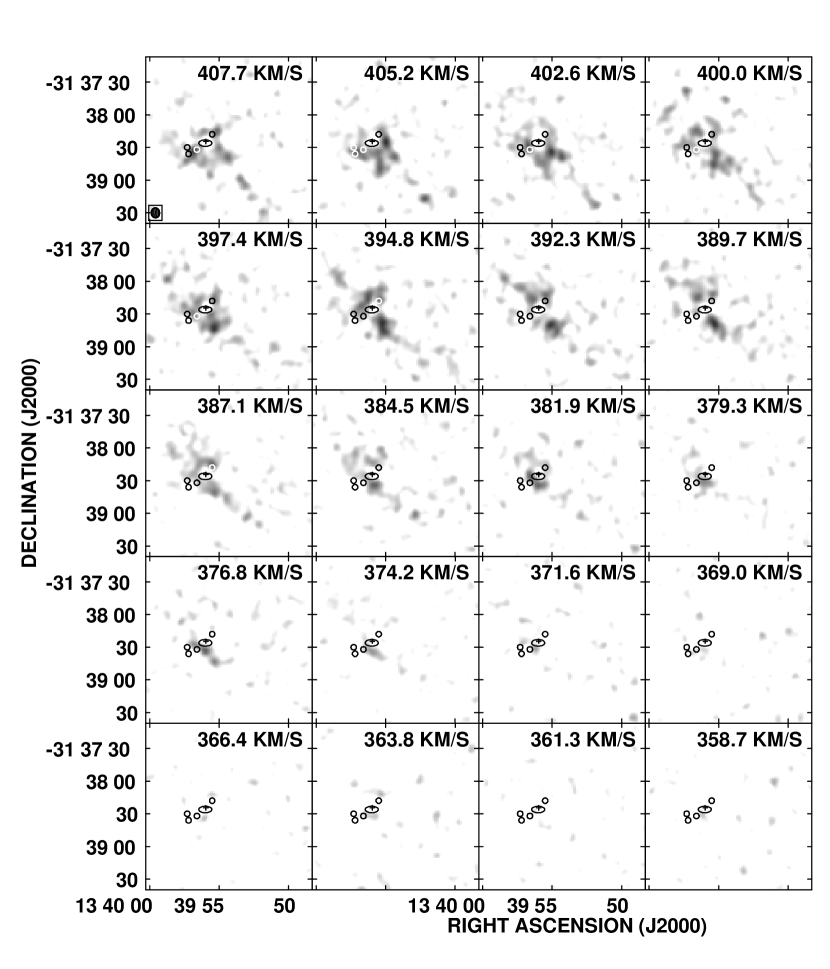
Figure 5 shows 21-cm maps of NGC 5253 in every 2.58 km s-1 velocity channel containing emission from to km s-1. The greyscale range shows beam-averaged column densities of 1.0 cm-2 (white), equivalent to 2 the rms noise, to 5.0 cm-2 (black). The cross marks the location of the central super star cluster and radio supernebula. Ellipses indicate the positions of the molecular clouds A through E (from left to right, in decreasing Right Ascension) identified by Meier et al. (2002). In Figure 5, the southeast H I plume is the dominant feature at higher velocities (450 - 420 km s-1), while the H I aligned with the stellar distribution is found primarily at velocities between 420 and 380 km s-1.
The kinematics of individual H I features relative to the ionized gas can be better seen in Figure 6 which shows H I column density channel maps (contours) overlaid on an image (greyscale). Every second 2.58 km s-1 channel is plotted. The contours show fluxes of 2.4, 3.6, 6.0, and 8.4 mJy beam-1, equivalent to beam-averaged H I column densities of 1.0, 1.5, 2.5, and 3.5 cm-2. Again, it can be seen that the highest velocity gas at km s-1 (upper 2 rows of panels) is located to the southeast of the nucleus. Gas at intermediate velocities km s-1 near the systemic velocity of km s-1 has a circularly symmetric morphology similar to that of the . At these velocities there are also lower column density H I extensions along the major axis of the galaxy to the northeast, southwest and also in the direction of the H shell to the west. At the lowest velocities, km s-1, the H I morphology becomes elongated along the galaxy’s major axis.
Figures 3 and 6 also show H I extensions to the northeast and southwest along the galaxy’s major axis. The H I protrusion to the northeast appears at velocities km s-1 and does not unambiguously form a coherent shell or bubble. The H I extension to the southwest appears over a similar velocity range with more gas closer to the systemic velocity. The spatial and kinematic symmetry of these extensions along the major axis is consistent with low amplitude rotation, in the canonical manner, about the galaxy’s minor axis, but the pattern is, by no means, obvious.
Figure 7 shows a 21-cm intensity-weighted velocity map ( 1st moment; contours) overlaid on a stellar continuum 6450 Å image (greyscale). Isovelocity contours are labeled in km s-1. This figure shows a steep kinematic velocity gradient along the southeast H I plume.333The gradient is nearly parallel to the projected direction toward the much larger group member M 83, and van den Bergh (1980) suggested a recent interaction between the two. However, the line-of-sight separation exceeds 1 Mpc given the current distance determinations of 3.80.2 Mpc for NGC 5253 and 5.16 Mpc for M 83 (Karachentsev et al., 2007), effectively precluding any recent interaction. The contours show the largest radial velocities of km s-1 at a distance 1′ to the south-southeast of the nucleus. Radial velocities approach the systemic velocity of km s-1 near the nucleus. Along the major axis to the northeast and southwest of the nucleus, the velocity field is disordered and shows a small velocity spread, ranging between in the northeast and km s-1 in the southwest.
Kobulnicky & Skillman (1995) concluded, on the basis of low-resolution (45″) H I maps, that the neutral atomic medium in NGC 5253 rotates about the major axis, as in polar ring galaxies. However, these new high-resolution H I data reveal a strong asymmetry in the H I distribution and velocity field, making the rotation scenario improbable. These new data are more consistent with an either an inflow or outflow of neutral gas along the minor axis from the south and east of the nucleus. Inflow, was considered by Kobulnicky & Skillman (1995) and propounded by Turner, Beck, & Hurt (1997) and Meier et al. (2002) on the basis of observations.
Figure 8 shows the 21-cm intensity-weighted velocity (1st moment) map as in Figure 7 (contours) overlaid on an H I total intensity map (0th moment; greyscale). The scale bar shows H I surface brightness in units of Jy beam-1 m s-1. A peak flux of 400 Jy beam-1 m s-1 corresponds to H I column densities of 6.4 cm-2. The peak H I column densities occur where the velocity gradient is the steepest. The majority of the H I by mass is located to the south-southeast and in the circumnuclear region. H I extensions to the west, southwest, and northeast have comparatively low total column densities and low line-of-sight velocity dispersions, consistent with gas associated with the main body of the galaxy.
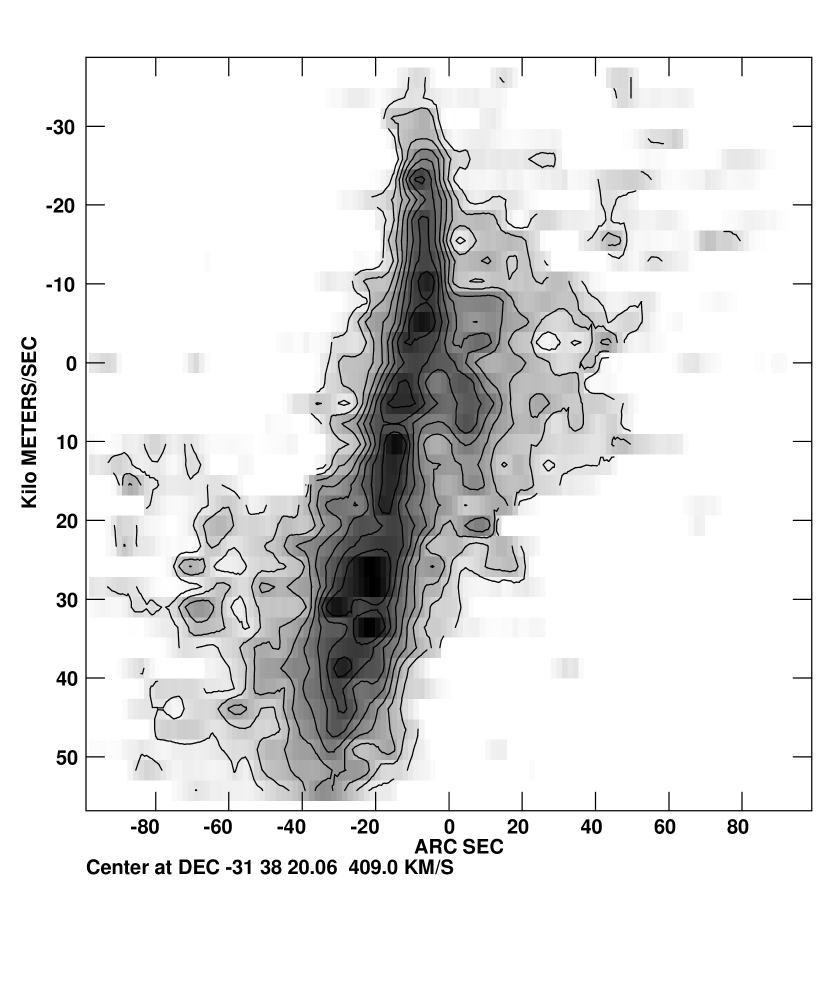
Position-velocity diagrams allow another perspective on the observations. Figure 9 shows a position-velocity diagram of the H I emission taken along the optical major axis at position angle 50°. Although the diagram is quite complex, two main features stand out. First, there is a large velocity range in the central parts. Here one can appreciate the asymmetry in the field. Redshifted H I gas extends out to 50 km s-1 from the systemic velocity, while blueshifted gas extends out only 30 km s-1. The second notable component is the gas at roughly the systemic velocity showing a slow drift in central velocity across the spatial distribution with an amplitude of roughly 20 km s-1, consistent with that expected for such a low-mass galaxy.
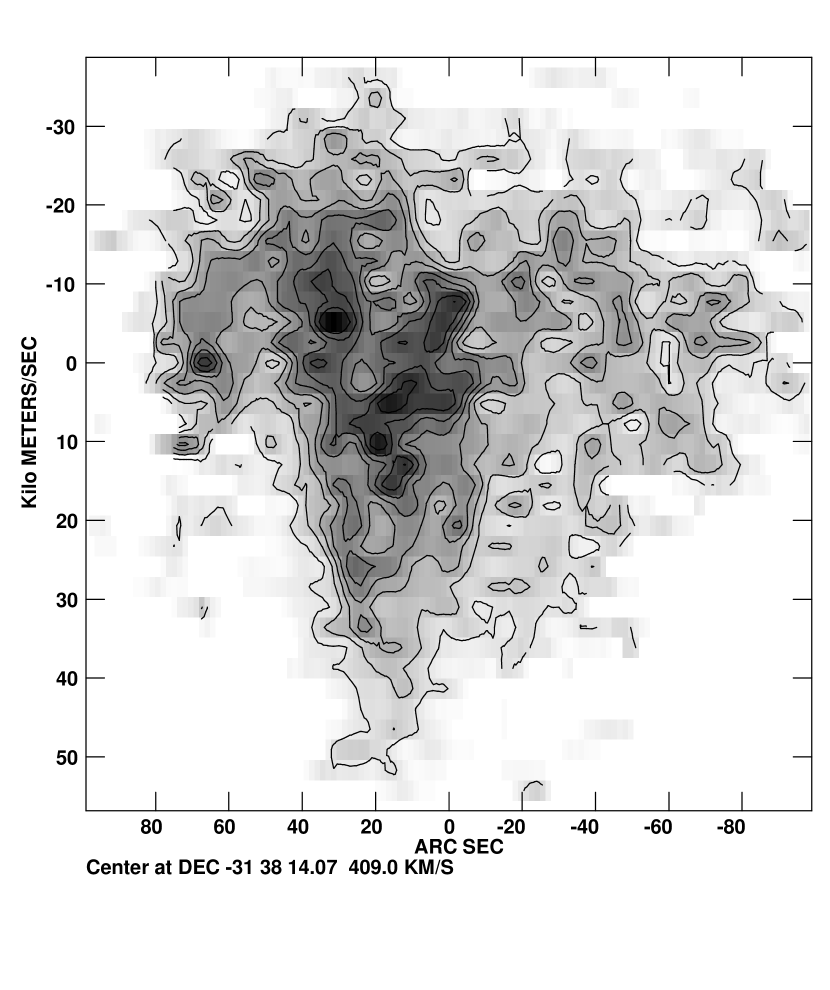
Figure 10 shows a position-velocity diagram of the H I emission taken along the optical minor axis at position angle 140°. Here we again see a large range in velocities over a relatively small spatial extent. It is interesting that in this projection, the gas appears continuous in velocity from the extreme of the redshifted gas to the extreme of the blueshifted gas.
4 Interpretation of Major H I Components in NGC 5253
Here we will try to draw a coherent picture of the three major components of the H I distribution: the H I associated with the stellar distribution, the southeast H I plume, and the open shells to the west and east.
4.1 H I Along the Major Axis
It is interesting to compare these new H I observations of NGC 5253 to those of NGC 625 (Cannon et al., 2004), another dwarf starburst galaxy at a similar distance. Côté et al. (2000) showed that NGC 625 also has the dominant H I velocity gradient along the minor axis. Cannon et al. (2004) showed that this large velocity gradient was due to outflowing H I gas from the central starburst. This outflowing gas is also detected in the warm and hot phases of the ISM (Cannon et al., 2005).
This similarity with NGC 625 motivates a second look at the H I component in NGC 5253 that is aligned with the optical galaxy. In NGC 625, the signature of rotation along the major axis was swamped by the presence of the strong H I outflow. However, the position velocity diagrams revealed the low amplitude rotation curve present in the H I. It is probable that we are seeing the same effect in NGC 5253. Although the H I in NGC 5253 is quite disturbed, the overall trend for higher velocities in the southwest and lower velocities in the northeast suggest a pattern of rotation. This is also seen in the stellar velocities measured by Caldwell & Phillips (1989) (their Figure 10) and the H major-axis velocity map of Martin (1998) (her Figure 9). It is not straightforward to calculate the expected amplitude of the rotation curve for NGC 5253; comparing to the luminosity requires a significant correction for the small M/L ratio expected for a starburst galaxy. Nonetheless, after applying a small ( 20%) correction for inclination, the amplitude of 10 km s-1 is not out of line with what could be expected for NGC 5253. Note that the H I study of the similar dwarf starburst galaxy NGC 1569 by Stil & Israel (2002) also found only small evidence of normal rotation in the inner parts of NGC 1569, but that the H I along the major axis in the outer parts confirmed this rotation signature.
4.2 The H I Plume
These new high resolution H I observations preclude rotation along the minor axis as a viable interpretation for the southeast plume. Either inflow, outflow, or some kind of tidal interaction remnant feature seem more likely. Based on CO observations, Turner, Beck, & Hurt (1997) favored infall of metal poor gas. The radial velocities of the CO clouds 200 pc east of the nucleus are slightly higher than the systemic velocity, consistent with inflow or possibly rotation about the major axis within the innder few hundred pc. The H I velocities at this location could also be consistent with major-axis rotation within the nuclear regions. Many galaxies are known to have counter-rotating or decoupled dynamical components in the inner regions, and close grvitational interactions are often invoked as the causes of such kinematics.
That an accretion event may have triggered the current starburst has been suggested several times (van den Bergh, 1980; Graham, 1981; Caldwell & Phillips, 1989). Turner, Beck, & Hurt (1997) identify three points in favor of the infall hypothesis. First, the weak CO emission associated with a strong starburst favors low metallicity gas. Second, the non-central position of the CO suggests a transient feature. Third, the redshift of the CO relative to the galaxian systemic velocity could be indicative of inflow. Meier et al. (2002) further note that since the dust lane that is associated with the CO and H I emission in the southeast plume appears to be in front of the galaxy, the geometry (redshift) favors infall.
A close look at the relative locations of the CO clouds, dust lane, and H I peaks along the southeast minor axis reveals, in fact, two different gaseous components in this direction. These two components are resolved both spatially and kinematically by the new H I observations, and a comparison with the extinction maps of Calzetti et al. (1997) shows that these are intrinsically different components — not two maxima of the same feature.
Figure 11 shows a greyscale representation of the dust reddening () computed from the ratio maps of Calzetti et al. (1997) assuming . The inferred extinctions range from near zero to . The cross and ellipses show the locations of the central thermal radio supernebula and the CO clouds, as in previous figures. Contours in Figure 11 show the extinction derived from the neutral hydrogen column densities assuming a Galactic ratio of gas to dust (Bohlin et al., 1978),
| (3) |
For a standard Galactic ratio of total to selection extinction, , this is equivalent to,
| (4) |
Here, we have ignored, for the moment, any contribution from molecular gas, and we remind the reader that the H I column densities inferred from the high-resolution interferometer maps may be underestimates of the true column densities by up to a factor of two, owing to the insensitivity of the to emission on large angular scales. Hence, the estimated H I column densities and extinctions are lower limits. The contours in Figure 11 correspond to 4, 3.5, 3, 2.5, 2, 1.5, 1 and 0.5 mag.
Figure 11 shows that the extended region of high extinction indicated by the Balmer decrement coincides with a local maximum in the neutral hydrogen column density and the locus of the positions of the CO detections. The ratio in this region , consistent with the expectation that some of the H I lies behind the region of ionized gas, and with the expectation that some of the diffuse H I may be unseen in the interferometer maps. More precise estimates are not possible because of the large disparity in beamsize between the H I data (8″) and the Calzetti et al. (1997) maps (0.3″). Nevertheless, the correlation between both extinction measures at this location is consistent with the majority of the H I (and molecular gas?) lying in the foreground of the ionized medium. The high H I column density in this feature probably continues into the region surrounding the central radio supernebula and super star cluster, but measurements are unreliable at this location owing to the strong H I absoprtion.
By contrast, the maximum H I column density, corresponding to mag, is located in the H I plume 15″ to the southwest of the region with the largest . At this location there is no pronounced peak in and there are no CO detections. Figure 5 shows that the gas responsible for this primary peak in N(H I) occurs at velocities km s-1 and is kinematically and spatially distinct from the neutral gas at the location of the molecular clouds. Thus, what we are calling the H I plume appears to have no physical relation to the region of high extinction in the dust lane, with the possible exception of a tenuous connection at velocities km s-1.
The very high ratio of H I column density to extinction in the plume implies that either the plume gas is located on the far side of NGC 5253, or that the gas is extremely metal-poor and has a very large gas-to-dust ratio. The metal-poor ISM in dwarf galaxies does exhibit gas-to-dust ratios 2–5 times higher than in the Milky Way (Draine et al., 2007), so equation 4 could require a correction factor of this order. However, the mean ratio in the vicinity of the plume compared to near the dust lane suggests that the plume and the dust lane are distinct entities. Even if we allow that, statistically, half of the neutral medium may lie behind the star-forming ionized gas, the inferred extinctions are factors of 2–3 larger from the H I column density than from the Balmer decrement. The real ratio may be even larger because, as described above, the H I column density estimates should be regarded as lower limits and a molecular component is not included.
The true nature of this low-extinction, high-column-density, redshifted H I plume is difficult to pin down. One possible explanation is that the H I plume may be outflowing gas such as commonly observed in dwarf starbursts like NGC 1705 (Meurer et al., 1998) and NGC 625 (Cannon et al., 2004). The main difference between NGC 5253 and NGC 625 is the asymmetry of the H I distribution seen here. The symmetrical H I distribution in NGC 625 was taken as strong evidence against infall of gas, but the H I plume in NGC 5253 does not show a similar symmetry. Figure 10 shows that there is continuity from the strongly redshifted gas ( +50 km s-1) through to blueshifted gas ( 30 km s-1), which would be the signature of somewhat asymmetric outflow. The “spur” of outflowing gas in NGC 1705 is one-sided, and Meurer et al. (1998) note that this is to be expected when the source of the outflow is displaced relative to the midplane (Mac Low et al., 1989). However, the plume in NGC 5253 contains 20–30% of the H I seen in the interferometer maps, depending on the spatial and velocity boundaries adopted. Such a fractionally massive outflow of neutral gas over a fairly small solid angle without any ionized gas counterpart makes the outflow interpretation less plausible in this galaxy.
Radial inflow, suggested by Meier et al. (2002) on the basis of the kinematics of CO clouds within the minor axis dust lane, is another possibility. The geometry of the isovelocity contours in the redshifted H I plume can help distinguish whether the inflow could be on the near or far side of NGC 5253. The most redshifted contours (455 km s-1) lie farthest from the galaxy and are 50 km s-1 larger than the systemic velocity of 400 km s-1. An infalling stream is expected to accelerate as it approaches the galaxy. Thus, if the plume were infalling gas on the near side, the isovelocity contours closer to the galaxy ought to exceed 455 km s-1. Instead, we observe that they approach the systemic velocity. Inflow from the far side of NGC 5253 might, however, produce the observed signature. Such a background geometry would simultaneously explain the lack of extinction seen toward the high column density peaks in the plume.
Finally, and perhaps most plausibly, the H I plume may be a kinematically distinct remnant from a recent gravitational interaction with another member of the Centarus A subgroup of the Centarus A/M 83 complex. It is difficult to prove or rule out this possibility. In this scenario, the H I asymmetry is easily understood as a chance projection against the main body of NGC 5253, and there is no need for the tidal tail to be symmetrically placed in either space or velocity. The galaxy density within the Centarus A subgroup is high, and interactions are to be expected. Many of these systems are dynamically disturbed systems, suggestive of a history fraught with close encounters. A perturbing, but not destructive, close encounter would simultaneously provide an explanation for the H I plume as a tidal feature and provide a cause for the recent burst of star formation seen throughout the galaxy, most exceptionally in the nucleus.
Karachentsev et al. (2007) have provided a three dimensional picture of the Cen A/M83 complex, and NGC 5253 is located in the periphery. Using radial velocities and accurately measured distances, Karachentsev et al. (2007) have identified NGC 5253 with the Cen A sub-group based on a positive tidal index. This is because, even though NGC 5253 is within 2 degrees of M 83 in projection on the sky, it is 1.4 Mpc closer than M83 and nearly identical in distance to Cen A. Note, however, that NGC 5253 is separately by roughly 12 degrees in projection from Cen A, corresponding to roughly 800 kpc. Thus NGC 5253 is currently far from the strong gravitational influence of either of the largest galaxies in the complex. Despite being a member of a very populous complex, NGC 5253 appears to be relatively isolated. In fact, the next nearest known galaxy, ESO 383-087, appears to be over 400 kpc away. It is not clear which member of the group might have interacted recently with NGC 5253.
In some ways, the H I plume in NGC 5253 is reminiscent of some of the extended filaments of gas surrounding IC 10 (Shostak & Skillman, 1989; Wilcots & Miller, 1998) or the giant H I cloud in Virgo, H I 1225+0146 (McMahon et al., 1990). In IC 10, H I “plumes” and “streamers” have velocity gradients that show little relation to the overall rotation of the galaxy. The true nature of the extended H I features in IC 10 is also not yet understood, but interaction with these H I features is generally thought to have provoked the present starburst. Taylor (1997) finds that starbursting dwarf galaxies like NGC 5253 are found preferentially to have close companions, so the interaction hypothesis is a reasonable one.
One very important point is that the large range of velocities observed in the H I in NGC 5253 is associated with the southeast plume. It is common practice in the literature to apply the FWHM of the gas velocity distribution as indicative of internal dynamics to estimate dynamical mass (Harris et al., 2004) or a stellar crossing time (Calzetti et al., 1997). Regardless of whether the large-scale velocity gradient seen in the H I plume is due to infall, outflow, or tidal debris, the resulting large velocity dispersion should not be used as an internal dynamical indicator.
4.3 The H I Shells and Bubbles
The main question concerning the open shells on the west and the east is whether those shells represent events centered at the currently indicated positions or if they are also the result of centrally energized outflows that give rise to shell geometries as they emerge from the galaxy. The centers of the western and eastern open shells lie well outside of the main stellar distribution and far from the current, centrally concentrated star formation. Comparison with simulations of outflows (Mac Low & Ferrara, 1999) and real outflows observed in H and X-rays (Strickland et al., 2004) show that open-shell morphologies can be created where the centers of the shells are far from the source of the energy. Is it possible that this is what we are seeing in NGC 5253?
How likely is it that star formation events capable of creating large H I shells could have occurred on the periphery of the present stellar distribution? Our view of the spatially resolved star formation history of NGC 5253 has evolved with time (van den Bergh, 1980; Caldwell & Phillips, 1989; Calzetti et al., 1997; Tremonti et al., 2001; Harris et al., 2004). The most recent work by Harris et al. (2004) emphasizes the very young ages ( 20 Myr) for all of the clusters that they studied (in agreement with the work by Tremonti et al., 2001). However, Harris et al. (2004) required detection in the UV for inclusion, so their sample should be strongly biased toward the youngest clusters (only the brightest of the older clusters would be detected - see their Figure 15). The earlier study by Calzetti et al. (1997) derived ages of order 50 Myr for some of the clusters, the colors of the core required starburst activity within the last 100 Myr, and Caldwell & Phillips (1989) deduced a range in cluster ages with an upper limit of 109 years. From the above, it is not clear whether strong star formation events in the periphery of its stellar distribution in the recent past are consistent with the star formation history of NGC 5253. A star formation history derived from the field stars, while challenging owing to the distance and the presence of differential extinction, would be a valuable study.
Figure 3 depicts the integrated H I column density (contours) overlaid on an image (greyscale). The morphology of the H I shell to the west corresponds closely to the morphology of the shell at position angle of about 70° as seen from the central radio supernebula. The shell has an angular diameter of 45″ or about 830 pc. This H feature lies along echelle slit #2 of Martin (1998) who noted the absence of kinematic splitting in that would normally demarcate an expanding ionized shell. Martin (1998) characterizes this as a quiescent shell. The mass of neutral hydrogen in this H I feature is M⊙ as measured by summing emission in the high-resolution data cube from this feature. Such a significant mass of neutral gas could be responsible for stalling the shell’s expansion and preventing “blowout”. Calzetti et al. (2004) show emission-line ratio maps for the ionized gas in this vicinity, and they concluded on the basis of high [S II]/H ratios that the numerous shells and radial filaments to the south and west are shock ionized, consistent with starburst powered shells. However, a softer radiation field, characteristic of the diffuse ionized gas at large distances from star forming regions, could also explain these line ratios (Martin, 1997; Hunter & Gallagher, 1990).
In Figure 6 it can be seen that the H I coincident with the western shell spans a range of velocities km s-1. However, the fragmentary morphology of the neutral gas at these velocities does not provide clear evidence of a single coherent structure. The velocity range (30 km s-1) of the H I near this H shell is comparable to that found in the ionized gas, consistent with slow or stalled expansion. The lack of X-ray emission inside this bubble (Summers et al., 2004) is also consistent with it being an older, cooler, quiescent remnant from bygone era of star formation. If we take the mass of the H I bubble to be M⊙ and the radial expansion speed to be 20 km s-1 the kinetic energy contained in this structure is erg. The implied expansion timescale for this 1 kpc diameter structure is 40 Myr, making it unlikely that the current 3 Myr old burst produced this bubble. It is probably a product of the older episodes of star formation from the previous 50 Myr. Marlowe et al. (1995) estimate the mechanical energy injection rate for NGC 5253 to be erg s-1, or about erg over the last 5 Myr. Even though star formation and its effects are distributed throughout NGC 5253, this energy injection rate is more than sufficient to power the observed H I shell, presuming that such an injection rate has persisted for at least 50 Myr—the ages of the clusters studied by Calzetti et al. (1997).
5 Comparison of the H I with Other Gas Phases
5.1 Comparison with the Molecular Gas
Figure 5 shows the positions of CO detections identified by Meier et al. (2002) as molecular clouds A through E (from left to right, in decreasing Right Ascension). Molecular cloud D is nearly coincident with the central radio supernebula (marked by a cross). H I appears in absorption at this location, so it is not possible to identify molecular cloud D with a particular 21-cm feature. Molecular clouds B ( km s-1) and C ( km s-1) have probable H I counterparts seen in Figure 5 between km s-1 and km s-1.444In the direction of NGC 5253, the radial velocity in the heliocentric velocity frame is nearly identical (within 1 km s-1) to the Local Standard of Rest frame, so we do not explicitly transform our 21-cm data into the LSR frame used by Meier et al. (2002). Molecular cloud A ( km s-1) has no apparent 21-cm counterpart in a similar velocity range. However, H I emission is present at that location over the velocity range km s-1. Molecular cloud E ( km s-1) has no corresponding H I counterpart in a similar velocity range. Detectable 21-cm emission is present at velocities km s-1. Meier et al. (2002) note that clouds D and E are tentative detections at the 3–5 level of significance, and they may not be real. The lack of an H I counterpart at the velocity of cloud E is consistent with it being noise in the CO data.
The peak H I column density of 6.4 cm-2 measured here can be used together with the peak column density measurement of Meier et al. (2002) to make a better estimate the extinction, , toward the dust lane, as described above. The column density of molecular hydrogen can be estimated from the integrated emission, , assuming that (Meier et al., 2001), and adopting (Bloemen et al., 1986; Scoville et al., 1987),
| (5) |
In terms of the CO flux, ,
| (6) |
where is the effective gain of the aperture synthesis beam, approximately 0.46 K Jy-1 for the beamsize and frequency of the Meier et al. (2002) Owens Valley Radio Observatory () data at 230 GHz. The peak CO fluxes for the four molecular clouds to the east of the nucleus measured by Meier et al. (2002) range from 6.9 – 16.9 Jy km s-1, corresponding to molecular hydrogen column densities – cm-2. This may be a lower limit to the true molecular column density if the CO-to- conversion factor in the low-metallicity gas of NGC 5253 is larger than in the Milky Way, i.e., (e.g., Maloney & Black, 1988; Verter & Hodge, 1995; Israel & Burton, 1986). The maximum implied visual extinctions, based on peak 8″ beam-averaged H I and column densities are – . However, as noted by Calzetti et al. (1997) and evidenced by Figure 11, the extinction derived from optical emission line ratio reddening maps is highly variable over small scales. These values range from mag to mag toward most of the star clusters. may be mag toward the central embedded cluster, consistent with estimates of mag mag from the 9.7 m silicate feature optical depth (Aitken et al., 1982). Because the H I and CO interferometer measurements provide only beam-averaged extinction estimates over pc scales, localized regions may exhibit larger extinctions than the 4.4 – 5.9 mag obtained from this approach.
5.2 Comparison with the Hot Ionized Gas
Figure 12 is a composite 3-color plus contour image of NGC 5253 depicting the optical 6450 Å stellar continuum (blue), 0.3-8 keV X-rays (green), H (red) and total H I column density (contours, as in Figure 2). The X-ray data, previously published in Summers et al. (2004), was retrieved from the Chandra X-ray Observatory archives (proposal number 02600546) and adaptively smoothed to a minimum signal-to-noise ratio of 2 for presentation. Figure 12 reveals the relative morphologies of the stars and the cold, warm ionized, and hot phases of the ISM in NGC 5253. The X-ray, H, and H I emission extend preferentially to the south and west of the nucleus, suggesting expansion of starburst heated material along these directions. If the H I plume is inflowing or interacting from the southeast, it may inhibit expansion in that direction.
6 Conclusions
Radio-wave aperture synthesis observations in the 21-cm line of neutral hydrogen at 8″ resolution have revealed a complex non-axisymmetric gas distribution and velocity field in NGC 5253. The total neutral atomic content of the galaxy is M⊙ from single-dish observations for a distance of 3.8 Mpc. The neutral medium in NGC 5253 may be characterized as consisting of three components: a component containing the majority of the neutral medium distributed along the stellar distribution and showing evidence for low-amplitude rotation at the level of 15–20 km s-1; a redshifted H I plume extending to the south-southeast along the minor axis containing 20–30% of the H I; and kinematically cold H I shells or filaments extending along the minor axes and to the southwest, containing 10% of the neutral gas mass. Taken together, these different components result in very complex velocity structures. Here we will try to summarize out best understanding of these structures, starting with the relatively enigmatic H I plume.
6.1 The Nature of the H I Plume
The kinematically distinct H I plume consists of a significant fraction of the total H I emission from NGC 5253. In this paper we have discussed three possible origins for the H I plume: outflowing gas, inflowing gas, and a separate H I cloud which is interacting with NGC 5253.
The possibility of outflow was motivated by similarity with velocity fields observed in other dwarf starburst galaxies showing H I outflow (e.g., NGC 1569, NGC 625, NGC 1705). However, the large fraction of H I (25%) in the anamalous velocity gas in NGC 5253 is exceptional. Furthermore, strong outflows are usually accompanied by H and X-ray emission which is not observed at this location. Such a massive outflow confined to a small solid angle without corresponding signatures in the ionized gas seems unlikely.
The possibility of inflow was motivated by the radial velocities of CO clouds within the minor-axis dust lane (Meier et al., 2002). Our high resolution H I observations indicate that the plume is a kinematically distinct feature from the H I associated with the molecular gas. The most compelling argument for inflow is the near coincidence in velocity of the H I plume with the galaxy’s systemic velocity in the region where the two are spatially coincident. If the H I plume is infalling, it must be from the far side of NGC 5253 given the plume’s velocity field (i.e., the most redshifted gas lies farthest from the galaxy), consistent with the lack of extinction observed in this vicinity despite the high H I column density.
Finally, we have the possibility that the H I plume is a distinct structure, perhaps a remnant from a recent interaction, seen in projection against the main body of NGC 5253. In this scenario, a recent gravitational encounter, perhaps with another dwarf galaxy in the same group, produced the H I plume and provided the trigger for the current extreme burst of star formation. Other dwarf galaxies, both bursting and non-bursting are accompanied by pure H I structures. Given the relatively large gas mass associated with the H I plume, this would appear to be the most likely explanation.
6.2 A Comprehensive View of the H I in NGC 5253
Our high resolution view of NGC 5253 has shown us that NGC 5253 has many similarities to the best studied dwarf starburst galaxies. H I concentrations near the minor axis dust lane are coincident in location and velocity with at least two of the molecular clouds seen in 12CO (Meier et al., 2002). The H I extension to the south-southeast, designated here the H I plume, appears to be spatially and kinematically distinct from the gaseous medium surrounding the dust lane molecular clouds along the southeast minor axis. We present evidence that the redshifted H I plume is likely to be either a dynamically distinct tidal remnant or an inflow on the far side of the galaxy. H I extensions to the east, west, and southwest show remarkably similar morphologies as the H shells and filaments. In particular, there is a close morphological similarity between the “quiescent” H shell to the west of the nucleus noted by Martin (1998) and an 800 pc diameter shell-like feature seen in H I. This may be an example of a starburst-powered shell stalled by the mass of surrounding neutral gas.
These complex H I features and kinematic signatures, when considered together with distributions of the molecular, ionized, and hot coronal media, are consistent with a starbursting low-mass galaxy in the initial phases of generating a galactic wind. Unlike more massive galaxies such as M 82 or NGC 3079 which show monolithic, well-collimated outflows (e.g., Strickland & Heckman, 2007; Cecil et al., 2002, and references therein) several non-co-spatial star formation events over the last Myr appear to be required to explain the multiple outflows observed in NGC 5253 (Summers et al., 2004; Strickland & Stevens, 1999; Caldwell & Phillips, 1989). The initiating and sustaining cause of the recent star formation activity may be an inflow or interaction of atomic gas along the “plume”, identified here for the first time. As such, NGC 5253 joins a long list of starburst galaxies where recent gravitational interactions are implicated as the trigger for extreme star formation bursts.
References
- Aitken et al. (1982) Aitken, D. K., Roche, P. F., Allen, M. C., & Phillips, M. M. 1982, MNRAS, 199, 31P
- Alonso-Herrero et al. (2004) Alonso-Herrero, A., Takagi, T., Baker, A., Rieke, G. H., Rieke, M. J., Imanishi, M., & Scoville, N. Z. 2004, ApJ, 612, 222
- Beck et al. (1996) Beck, S. C., Turner, J. L., Ho, P. T. P., Lacy, J. H., & Kelly, D. M. 1996, ApJ, 457, 610
- Bloemen et al. (1986) Bloemen, J. B. G. M., Strong, A. W., Blitz, L., Cohen, R. S., Dame, T. M., Grabelsky, D. A., Hermsen, W., Lebrun, F., Mayer-Hasselwander, H. A., & Thaddeus, P. 1986, A&A, 154, 25
- Bohlin et al. (1978) Bohlin, R. C., Savage, B. D., & Drake, J. F. 1978, ApJ, 224, 132
- Caldwell & Phillips (1989) Caldwell, N., & Phillips, M. M. 1989, ApJ, 338, 789
- Calzetti et al. (1997) Calzetti, D., Meurer, G. R., Bohlin, R. C., Garnett, D. R., Kinney, A. L., Leitherer, C., & Storchi-Bergmann, T. 1997, AJ, 114, 1834
- Calzetti et al. (1999) Calzetti, D., Conselice, C. J., Gallagher, J. S. III, & Kinney, A. 1999, AJ, 118, 797
- Calzetti et al. (2004) Calzetti, D., Harris, J., Gallagher, J. S., III, Smith, D. A., Conselice, C. J., Homeier, N., & Kewley, L. 2004, AJ, 127, 1405
- Cannon et al. (2003) Cannon, J. M., Dohm-Palmer, R. C., Skillman, E. D., Bomans, D. J., Côté, S., & Miller, B. W. 2003, AJ, 126, 2806
- Cannon et al. (2004) Cannon, J. M., McClure-Griffiths, N. M., Skillman, E. D., & Côté, S. 2004, ApJ, 607, 274
- Cannon et al. (2005) Cannon, J. M., Skillman, E. D., Sembach, K. R., & Bomans, D. J. 2005, ApJ, 618, 247
- Cecil et al. (2002) Cecil, G., Bland-Hawthorn, J., & Veilleux, S. 2002, ApJ, 576, 745
- Clark (1980) Clark, B. G. 1980, A&A, 89, 377
- Côté et al. (2000) Côté, S., Carignan, C., & Freeman, K. C. 2000, AJ, 120, 3027
- Dickey & Lockman (1990) Dicky, J. M., & Lockman, F. J. 1990, ARAA, 28, 215
- Draine et al. (2007) Draine, B. T., Dale, D. A., Bendo, G. et al. 2007, ApJ, in press
- Freedman et al. (2001) Freedman, W., Madore, B. F., Gibson, B. K., Ferrarese, L., Kelson, D. D., Sakai, S., Mould, J. R., Kennicutt, R. C., Jr., Ford, H. C., Graham, J. A., Huchra, J. P., Hughes, S. M. G., Illingworth, G. D., Macri, L. M., Stetson, P. B. 2001, ApJ, 553, 47
- Gibson et al. (2000) Gibson, B. K., et al. 2000, ApJ, 529, 723
- Gonzalez-Riestra et al. (1987) González-Riestra, R., Rego, M., & Zamorano, J. 1987, A&A, 186, 64
- Gorjian et al. (2001) Gorjian, V., Turner, J. L., & Beck, S. C. 2001, 554, L29
- Graham (1979) Graham, J. A. 1979, ApJ, 232, 60
- Graham (1981) Graham, J. A. 1981, PASP, 93, 552
- Harris et al. (2004) Harris, J., Calzetti, D., Gallagher, J. S. III, Smith, D. A., & Conselice, C. J. 2004, ApJ, 603, 503
- Hodge (1966) Hodge, P. W. 1966, ApJ, 146, 593
- Högbom (1974) Högbom, J. 1974, ApJS, 15, 417
- Huchtmeier & Bohnenstengel (1981) Huchtmeier, W. K., & Bohnenstengel, H.-D. 1981, AA, 100, 72
- Hunter & Gallagher (1990) Hunter, D. A. & Gallagher, J. S. III, 1990, ApJ, 362, 480
- Israel & Burton (1986) Israel, F. P., & Burton, W. B. 1986, A&A, 168, 369
- Kalberla et al. (1982) Kalberla, P. W. M., Mebold, U., & Reif, K. 1982, A&A, 106, 190
- Karachentsev et al. (2007) Karachentsev, I. D., et al. 2007, AJ, 133, 504
- Karachentsev et al. (2002) Karachentsev, I. D., Sharina, M. E., Dolphin, A. E., Grebel, E. K., Geisler, D., Guhathakurta, P., Hodge, P. W., Karachentseva, V. E., Sarajedini, A., Seitzer, P. 2002, A&A, 385, 21
- Kobulnicky & Skillman (1995) Kobulnicky, H. A., & Skillman, E. D. 1995, ApJ, 454, L121
- Kobulnicky & Johnson (1999) Kobulnicky, H. A., & Johnson, K. E. 1999, ApJ, 454, 527, 154
- Kobulnicky et al. (1997) Kobulnicky, H. A., Skillman, E. D., Roy, J–R., Walsh, J., & Rosa, M. 1997, ApJ, 477, 679
- López-Sánchez et al. (2007) López-Sánchez, Á. R., Esteban, C., García-Rojas, J., Peimbert, M., & Rodríguez, M. 2007, ApJ, 656, 168
- Mac Low et al. (1989) Mac Low, M.-M., McCray, R., & Norman, M. L. 1989, ApJ, 337, 141
- Mac Low & Ferrara (1999) Mac Low, M.-M., & Ferrara, A. 1999, ApJ, 513, 142
- Maloney & Black (1988) Maloney, P., & Black, J. H. 1988, ApJ, 325, 389
- Marlowe et al. (1995) Marlowe, A. T., Heckman, T. M., Wyse, R. M., & Schommer, R. 1995, ApJ, 438, 563
- Martin (1997) Martin, C. L. 1997, ApJ, 491, 561
- Martin (1998) Martin, C. L. 1998, ApJ, 506, 222
- Martin & Kennicutt (1995) Martin, C. L., & Kennicutt, R. C., Jr. 1995, ApJ, 447, 171
- Martín-Hernández et al. (2005) Martín-Hernández, N. L., Schaerer, D., & Sauvage, M. 2005, A&A, 429, 449
- McMahon et al. (1990) McMahon, R. G., Irwin, M. J., Giovanelli, R., Haynes, M. P., Wolfe, A. M., & Hazard, C. 1990, ApJ, 359, 302
- Meier et al. (2002) Meier, D. S., Turner, J. L., & Beck, S. C. 2002, AJ, 124, 877
- Meier et al. (2001) Meier, D. S., Turner, J. L., Crosthwaite, L. P., & Beck, S. C. 2001, AJ, 121, 740
- Meurer et al. (1998) Meurer, G. R., Staveley-Smith, L., & Killeen, N. E. B. 1998, MNRAS, 300, 705
- Mohan et al. (2001) Mohan, N. R., Anantharamaiah, K. R., & Goss, W. M. 2001, ApJ, 557, 659
- Moorwood & Glass (1982) Moorwood, A. F. M., & Glass, I. S. 1982, A&A, 115, 84
- Saha et al. (1995) Saha, A., Sandage, A., Labhardt, L., Schwengeler, H., Tammann, G. A., Panagia, N., & Macchetto, F. D. 1995, ApJ, 438, 8
- Sakai et al. (2004) Sakai, S., Ferrarese, L., Kennicutt, R. C., Jr., & Saha, A. 2004, ApJ, 608, 42
- Scoville et al. (1987) Scoville, N. Z., Yun, M. S., Clemens, D. P., Sanders, D. B., & Waller, W. H. 1987, ApJS, 63, 821
- Shostak & Skillman (1989) Shostak, G. S., & Skillman, E. D. 1989, A&A, 214, 33
- Stil & Israel (2002) Stil, J. M., & Israel, F. P. 2002, A&A, 392, 473
- Strickland & Heckman (2007) Strickland, D. K., & Heckman, T. M. 2007, ApJ, 658, 258
- Strickland & Stevens (1999) Strickland, D. K., & Stevens, I. R. 1999, MNRAS, 306, 43
- Strickland et al. (2004) Strickland, D. K., Heckman, T. M., Colbert, E. J. M., Hoopes, C. G., & Weaver, K. A. 2004, ApJ, 606, 829
- Summers et al. (2004) Summers, L. K., Stevens, I. R., Strickland, D. K., & Heckman, T. M. 2004, MNRAS, 351, 1
- Taylor (1997) Taylor, C. L. 1997, ApJ, 480, 524
- Thim et al. (2003) Thim, F., Tammann, G. A., Saha, A., Dolphin, A., Sandage, A., Tolstoy, E., Labhardt, L. 2003, ApJ, 590, 526
- Tremonti et al. (2001) Tremonti, C. A., Calzetti, D., Leitherer, C., & Heckman, T. M. 2001, ApJ, 555, 322
- Turner, Beck, & Ho (2000) Turner, J. L., Beck, S. C., & Ho, P. T. P. 2000, ApJ, 532, L109
- Turner et al. (1998) Turner, J. L., Ho, P. T. P., & Beck, S. C. 1998, AJ, 116, 1212
- Turner, Beck, & Hurt (1997) Turner, J. L., Beck, S. C., & Hurt, R. L. 1997, ApJ, 474, L11
- Ulvestad et al. (2006) Ulvestad, J. S, Perley, R. A., & Taylor, G. B. 2006, The VLA Observational Status Summary,
- van den Bergh (1980) van den Bergh, S. 1980, PASP, 92, 122
- Vanzi & Sauvage (2004) Vanzi, L., & Sauvage, M. 2004, A&A, 415, 509
- Verter & Hodge (1995) Verter, F., & Hodge, P. 1995
- Walsh & Roy (1989) Walsh, J. E., & Roy, J-R. 1989, MNRAS, 239, 297
- Wilcots & Miller (1998) Wilcots, E. M., & Miller, B. W. 1998, AJ, 116, 2363
- Wood & Churchwell (1989) Wood, D. O., & Churchwell, E. B. 1989, ApJS, 69, 831