Deep-Survey Constraints on X-ray Outbursts from Galactic Nuclei
Abstract
Luminous X-ray outbursts with variability amplitudes as high as have been detected from a small number of galactic nuclei. These events are likely associated with transient fueling of nuclear supermassive black holes. In this paper, we constrain X-ray outbursts with harder spectra, higher redshifts, and lower luminosities than have been studied previously. We performed a systematic survey of optical galaxies in the Chandra Deep Fields to search for such X-ray outbursts; the median redshift of these galaxies is . The survey spans days for the Chandra Deep Field-North, and days for the Chandra Deep Field-South. No outbursts were found, and thus we set upper limits on the rate of such events in the Universe, which depend upon the adopted outburst X-ray luminosity. For an outburst with X-ray luminosity ergs and a duration of 6 months, the upper limit on its event rate is galaxy-1 yr-1, roughly consistent with theoretical predictions. Compared to previous survey results, our harder-band and deeper survey suggests that the outburst rate may increase by a maximum factor of 10 when considering both obscured X-ray outbursts and redshift evolution from to . Our results also suggest that the X-ray luminosity function for moderate-luminosity active galactic nuclei is not primarily due to stellar tidal disruptions.
1 INTRODUCTION
X-ray observations, mainly with ROSAT, have found about six transient, large-amplitude X-ray outbursts from galactic nuclei (e.g., Donley et al. 2002; Komossa 2002; Komossa et al. 2004; Vaughan, Edelson, & Warwick 2004; and references therein). These events have variability factors of –1 000, peak keV X-ray luminosities comparable to those of local Seyfert galaxies (– erg s-1), decay timescales of months, and soft X-ray spectra. They have been observed in both active and inactive galaxies (i.e., galaxies with and without a persistently accreting supermassive black hole, respectively). The estimated event rates of these outbursts suffer from large systematic and statistical uncertainties. In nearby inactive galaxies the event rate is galaxy-1 yr-1, while in active galaxies the event rate appears to be times higher (e.g., Donley et al. 2002). At least some of these outbursts induce accompanying optical nuclear variability (e.g., Brandt, Pounds, & Fink 1995; Grupe et al. 1995). Recently, five new candidate X-ray outbursts were found in the XMM-Newton Slew Survey (Esquej et al., 2007), and one outburst has been detected in the ultraviolet and is thought to have the same origin as X-ray outbursts (Gezari et al., 2006).
The physical origin of nuclear X-ray outbursts remains mysterious. The most likely explanation is that they are caused by transient fueling events of nuclear supermassive black holes (SMBHs). Since SMBHs are thought to be ubiquitous in nucleated galaxies (e.g., Ferrarese & Ford 2005 and references therein), fueling events seem inevitable in crowded galactic centers. Fueling may occur when a star, planet, or gas cloud is tidally disrupted and partially accreted (e.g., Rees 1990; Ulmer 1999; Li, Narayan, & Menou 2002). The predicted event rate for stellar tidal disruptions (e.g., Magorrian & Tremaine, 1999; Syer & Ulmer, 1999) is roughly consistent with the poorly constrained rate of large-amplitude X-ray outbursts in inactive galaxies. However, Wang & Merritt (2004) predicted a rate that was a factor of higher than earlier results, mainly due to downwardly revised black-hole masses. This predicted rate, apparently in excess of the observed rate of X-ray outbursts, may indicate that a large fraction of tidal-disruption events do not exhibit expected X-ray outburst characteristics, perhaps due to short durations of the events or X-ray obscuration. In some cases, transient fueling could be due to accretion-disk instabilities (e.g., Siemiginowska, Czerny, & Kostyunin 1996). Some outbursts could also perhaps be explained by X-ray afterglows of gamma-ray bursts (GRBs), though no simultaneous GRBs were reported for the known X-ray outbursts (e.g., Komossa & Bade, 1999).
Aside from the innate scientific interest of nuclear X-ray outbursts, determining the rate and properties of such events is relevant to planning future missions such as the Black Hole Finder Probe (BHFP), Lobster, and eROSITA. The BHFP, for example, is likely to observe in the hard X-ray band, and the large sky coverage of this mission will allow intrinsically rare transient events to be studied (e.g., Grindlay 2005). Facilities such as the Large Synoptic Survey Telescope, the Joint Dark Energy Mission, and the Laser Interferometer Space Antenna should also allow the accompanying optical (e.g., Brandt 2005) and gravitational-wave (e.g., Kobayashi et al. 2004) outbursts to be studied.
Previous studies of X-ray outbursts from galactic nuclei have delivered fascinating results but require extension so that this phenomenon can be better understood. For example, advances are required in the following directions:
-
1.
Outbursts with harder X-ray spectra. As noted above, the outbursts discovered to date have generally had soft X-ray spectra with effective 0.2–2.0 keV power-law photon indices of –5. However, this may partially be a selection effect owing to the soft X-ray bandpass of the ROSAT satellite. Transient fueling events of SMBHs should be capable of generating harder X-ray spectra (–2.2) via Compton upscattering in the accretion flow; such spectra are observed from most active galactic nuclei (AGNs) as well as from transient Galactic black holes. Indeed, one X-ray outburst has shown evidence for spectral hardening as it declined (Komossa et al. 2004). In addition, obscuration can harden the observed X-ray spectra of an outburst, which would make it more difficult to detect in the current outburst surveys. A fairly small column density of cm-2 reduces the expected 0.2–2.0 keV flux from a soft-spectrum outburst by a factor of .
-
2.
Higher redshift outbursts. The X-ray outbursts discovered to date are at low redshift with –0.15. Since only a small fraction of cosmic time is spanned by this redshift range and the source statistics are limited, little is known about the redshift evolution of their frequency. It is plausible that the X-ray outburst rate could show evolution over cosmic time, considering that AGNs and galaxies both show strong evolution. The number densities of comparably X-ray luminous AGNs evolve upward by factors of –30 out to (e.g., Brandt & Hasinger 2005 and references therein), and Milosavljević, Merritt, & Ho (2006) have suggested that a significant portion of the X-ray luminosity function of such AGNs may be comprised of sources powered by tidal disruptions.
-
3.
Lower luminosity outbursts. Transient phenomena in complex natural systems often follow power-law distributions in frequency of occurrence, such that low-amplitude events are more common than high-amplitude events (e.g., earthquakes, avalanches, solar flares, and ecological extinctions). It is plausible that such a distribution applies for X-ray outbursts in galactic nuclei. Low-mass fueling events, such as partial tidal disruptions or the accretion of brown dwarfs, planets, or small gas clouds, would then be more common than high-mass fueling events.
In this paper, we utilize data from the Chandra Deep Fields (see Brandt & Hasinger 2005 for a review) to constrain the rate of X-ray outbursts with harder X-ray spectra, higher redshifts, and lower luminosities than those studied to date. Observations of the Chandra Deep Fields were made in several well-separated and individually sensitive “epochs,” allowing effective constraints to be placed upon X-ray outbursts that evolve on timescales of months in the rest frame. Some variability work has been performed on the Chandra Deep Field sources. For example, Paolillo et al. (2004) studied the X-ray variability of sources detected in the Chandra Deep Field-South (CDF-S), but this work has not been optimized to detect and to constrain systematically X-ray outbursts of the type relevant here.
We adopt km s-1 Mpc-1, = 0.3, and = 0.7 throughout this paper. All coordinates are J2000. The relevant Galactic column densities are cm-2 for the Chandra Deep Field-North (CDF-N; Lockman 2004) and cm-2 for the CDF-S (Stark et al. 1992). All X-ray fluxes and luminosities quoted throughout this paper have been corrected for Galactic absorption using these column densities.
2 THE SURVEY
In this survey, we focused on optically detected galaxies in the CDF-N (Brandt et al., 2001; Alexander et al., 2003) and the CDF-S (Giacconi et al., 2002; Alexander et al., 2003). An optical galaxy sample was compiled from several catalogs, with the redshifts collected from literature. We grouped the Chandra observations into several well-separated “epochs”. The five epochs for the CDF-N span days, and the four epochs for the CDF-S span days. At the median redshift of for the galaxies in our sample, the rest-frame coverage would be days for the CDF-N and days for the CDF-S. X-ray count rates or upper limits for every optical galaxy were measured for each epoch in three standard Chandra bands: 0.5–8.0 keV (full band; FB), 0.5–2.0 keV (soft band; SB), and 2–8 keV (hard band; HB). These measurements were then analyzed to search for any X-ray outburst candidates. Here we define “X-ray outbursts” to be transient events in galaxy nuclei that cause the count rate to vary by a minimum factor of 20 in one of the three standard bands. A minimum variability factor of 20 was chosen to discriminate against normal AGN variability, which typically has variability factors of 2–5 but can be as large as 10–15 (e.g., Paolillo et al. 2004).
2.1 Optical Galaxy Sample
Optical galaxies were selected from the catalog of Capak et al. (2004) for the CDF-N, and from the COMBO-17 catalog (Wolf et al., 2004) for the CDF-S. To ensure that these galaxies were covered by either the CDF-N or the CDF-S, we used the 0.5–8.0 keV exposure maps of the 2 Ms CDF-N and 1 Ms CDF-S as filters. A small portion () of the CDF-N was not covered by the Capak catalog, so the coverage of this survey is 418 for the CDF-N and 391 for the CDF-S. We only chose optical galaxies with AB magnitudes , to optimize our selection of a large galaxy sample with redshift measurements. We examined manually those sources with and removed some false sources, which were generally around bright objects. Galaxies in the COMBO-17 catalog with values for photometry flags were ignored, as suggested by the creators of that catalog. In this way, we selected galaxies in the CDF-N and galaxies in the CDF-S.
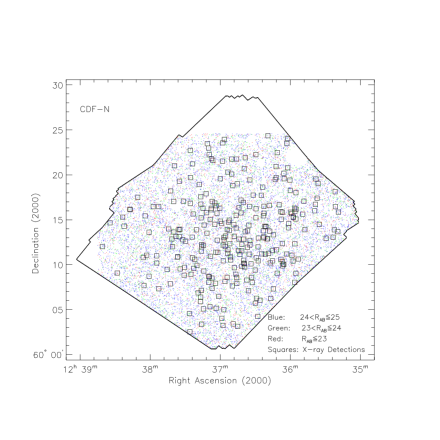
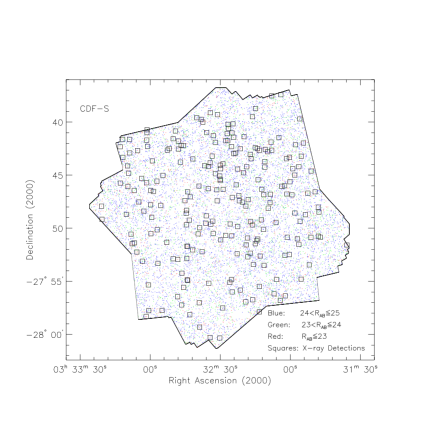
We searched the literature for redshift measurements for this optical galaxy sample. Spectroscopic redshifts were obtained from the spectroscopic surveys of Cowie et al. (2004), Reddy et al. (2006), and the “Team Keck” Treasury Redshift Survey (Wirth et al., 2004) in the CDF-N, and from the VIMOS VLT Deep Survey (Le Fèvre et al., 2004) and the VLT/FORS2 spectroscopic survey (Vanzella et al., 2005, 2006) in the CDF-S. Photometric redshifts were obtained from Capak et al. (2007) in the CDF-N, and from Mobasher et al. (2004) and Wolf et al. (2004) in the CDF-S. A matching radius of was used when cross correlating different optical catalogs. We did not find redshift measurements for 108 faint galaxies in the CDF-S. After removing these sources our final optical galaxy sample contained and galaxies in the CDF-N and CDF-S, respectively. The spatial distributions of these galaxies in the CDF-N and CDF-S are shown in Figure 1. We found spectroscopic redshifts for galaxies in the CDF-N and galaxies in the CDF-S, with the remaining sources having photometric redshifts. The redshift distributions are shown in Figure 2. To test the reliability of the photometric redshifts, we examined sources with both photometric and spectroscopic redshift measurements, and we studied the offset distribution of these two types of redshifts in the CDF-N and CDF-S separately. In both fields, the median offsets approach 0. The interquartile ranges are only 0.11 in the CDF-N and 0.20 in the CDF-S. The “stellarity index” (class_star parameter in SExtractor) is a robust galaxy identifier, with 0 for confirmed galaxies, and 1 for confirmed stars (e.g., Groenewegen et al., 2002). Less than 2.5% of these galaxies had stellarity indices , so stars were well removed from this sample.
This sample of galaxies contains a representative mix of field galaxies. Only of the galaxies are X-ray detected, and thus the AGN fraction is small. Lehmer et al. (2007) constructed a similar galaxy sample in the Chandra Deep Fields, with and –1.4. They studied the rest-frame optical colors as well as the Sérsic indices (e.g., Häussler et al., 2007) of galaxies in their sample, finding late-type galaxies and early-type galaxies out of galaxies. Our sample should have a similar composition in terms of galaxy morphology. Recent close-pair studies have suggested that the merger rate of field galaxies remains fairly small out to (e.g., Bundy et al., 2004, infrared-selected pairs). Elmegreen et al. (2007) examined the GEMS (Galaxy Evolution from Morphology and SEDs) and the southern GOODS (Great Observatories Origins Deep Survey) fields, which overlap with the CDF-S, and identified interacting galaxies to out of over optical galaxies. Thus our sample should also be dominated by non-interacting galaxies.

2.2 X-ray Data
X-ray data analyses were performed on the CDF-N, CDF-S, and the Extended Chandra Deep Field-South (E-CDF-S; Lehmer et al., 2005). There are 20 observations for the CDF-N, 11 observations for the CDF-S (Alexander et al., 2003), and 9 observations for the E-CDF-S (Lehmer et al., 2005). We grouped these into “epochs” according to their observation dates, five epochs for the CDF-N and four epochs for the CDF-S (see Table 1). The E-CDF-S observations took place years after the last CDF-S observation and were counted as the fourth epoch for the CDF-S. The E-CDF-S covered the entire CDF-S and consisted of four distinct observational fields with different observation dates. We list these fields separately in Table 1. We created images of each epoch from the reduced and cleaned level 2 event files (Alexander et al., 2003; Lehmer et al., 2005), using the standard ASCA grade set (ASCA grades 0, 2, 3, 4, and 6) for the three standard bands. There were thus 15 CDF-N images, 9 CDF-S images, and 12 E-CDF-S images. The aim point for a given image was taken to be the average value over its observations weighted by exposure time.
To construct X-ray source lists, we ran wavdetect (Freeman et al., 2002) on the 24 images in the CDF-N and CDF-S using a “ sequence” of wavelet scales (i.e., 1, , 2, 2, 4, 4, and 8 pixels). The false-positive probability threshold in each wavdetect run was set to . Source lists for the E-CDF-S were taken directly from Lehmer et al. (2005) because their source-detection method is the same as that used here. To improve the accuracy of the X-ray source positions, we matched the optical and X-ray source lists with a matching radius of and centered the distributions of offsets in right ascension and declination between the optical and X-ray source positions. This resulted in small () image-dependent astrometric shifts for all X-ray sources. Compared to the main Chandra X-ray source catalogs in Alexander et al. (2003), our X-ray source lists give new sources for each image, due to the less-conservative false-positive probability threshold we were using or the variability of some sources.
We are interested in the X-ray properties of the optical galaxies selected in §2.1, so we searched for X-ray counterparts of these galaxies by cross-correlating the optical and X-ray source lists with a matching radius of for sources within of the average aim point and for larger off-axis angles. In 47 cases where there is more than one optical galaxy associated with an X-ray source, the closest one is selected. None of the galaxies is associated with more than one X-ray source. A summary of these findings is given in Table 1. Around one third of the X-ray sources do not have counterparts in the galaxy sample, either because their magnitude is fainter than 25 or they are stars. We also estimated the expected number of false matches by artificially offsetting the X-ray source coordinates in right ascension and declination by (both positive and negative shifts) and re-correlating with the optical sources. On average, the number of false matches is only of the total matches in our sample for both the CDF-N and CDF-S.
| Exposure Time | Obs. DateaaObservations within each epoch only lasted for a few days, so we neglected the length of the epochs and only show the average observation dates weighted by exposure time. | Number of SourcesbbNumber of galaxies in the sample that are X-ray detected in this epoch for the particular band: 0.5–8.0 keV (FB), 0.5–2.0 keV (SB), or 2–8 keV (HB). | ||||
|---|---|---|---|---|---|---|
| Epochs | Obs. IDs | (ks) | FB | SB | HB | |
| CDF-N Epoch 1 | 580, 967, 966, 957 | 221.6 | 1999 Dec 12 | 131 | 105 | 73 |
| CDF-N Epoch 2 | 2386, 1671, 2344 | 267.4 | 2000 Nov 22 | 125 | 100 | 76 |
| CDF-N Epoch 3 | 2232, 2233, 2423, 2234, 2421 | 488.2 | 2001 Feb 26 | 142 | 118 | 96 |
| CDF-N Epoch 4 | 3293, 3388, 3408, 3389 | 385.7 | 2001 Nov 17 | 138 | 115 | 82 |
| CDF-N Epoch 5 | 3409, 3294, 3390, 3391 | 581.7 | 2002 Feb 17 | 147 | 128 | 92 |
| CDF-S Epoch 1 | 1431-0, 1431-1 | 114.7 | 1999 Nov 15 | 77 | 68 | 48 |
| CDF-S Epoch 2 | 441, 582 | 186.5 | 2000 Jun 01 | 83 | 68 | 53 |
| CDF-S Epoch 3 | 2406, 2405, 2312, 1672, 2409, 2313, 2239 | 638.2 | 2000 Dec 18 | 136 | 124 | 81 |
| CDF-S Epoch 4 F01ccObservational fields of the E-CDF-S. Note that a large fraction of each of these fields extends outside the region of our outburst survey. | 5015, 5016 | 240.1 | 2004 Mar 01 | 52 | 44 | 39 |
| CDF-S Epoch 4 F02ccObservational fields of the E-CDF-S. Note that a large fraction of each of these fields extends outside the region of our outburst survey. | 5017, 5018 | 227.4 | 2004 May 15 | 40 | 36 | 29 |
| CDF-S Epoch 4 F03ccObservational fields of the E-CDF-S. Note that a large fraction of each of these fields extends outside the region of our outburst survey. | 5019, 5020 | 240.7 | 2004 Nov 17 | 22 | 18 | 13 |
| CDF-S Epoch 4 F04ccObservational fields of the E-CDF-S. Note that a large fraction of each of these fields extends outside the region of our outburst survey. | 5021, 5022, 6164 | 246.0 | 2004 Nov 16 | 26 | 24 | 18 |
2.3 Source Characterization and Outburst Searching
We measured the X-ray counts coincident with every optical galaxy in all 36 images using circular-aperture photometry. We have chosen the aperture radii based on the encircled-energy function of the Chandra PSF, which was calculated using MARX (Model of AXAF Response to X-rays111See http://space.mit.edu/CXC/MARX) simulations. The 90% encircled-energy radius of the PSF was used. The circular aperture was centered at the position of every optical galaxy or its X-ray counterpart if it was X-ray detected. If a galaxy was not fully covered by a certain image, then it was marked as undetectable for this image.
The local background was determined in an annulus outside of the source-extraction region using background maps with known X-ray sources carefully removed to avoid possible contamination from adjacent sources. To create a background map for a given image, we first merged our Chandra X-ray source list from this image to the main Chandra catalogs (Alexander et al., 2003) to get a combined source list, using a matching radius of for sources within of the average aim point and for larger off-axis angles. Then we masked out these sources using apertures with radii twice that of the 90% PSF encircled-energy radius. We filled the masked regions for each source with a local background estimated by making a probability distribution of counts using an annulus with inner and outer radii of 2 and 4 times the 90% PSF encircled-energy radius, respectively. The local background for every optical galaxy was then determined using the same annulus on this background map.
When an optical galaxy was X-ray detected (i.e., had an X-ray counterpart) in a given image, the net number of source counts was calculated by subtracting the expected number of background counts from the number of counts in the aperture. Poisson errors were calculated following Gehrels (1986) and were propagated through this calculation. When an optical galaxy was not detected, an upper limit was calculated. If the number of counts in the aperture was , the upper limit was calculated using the Bayesian method of Kraft, Burrows, & Nousek (1991) for 99.87% confidence. For a larger number of counts in the aperture, a upper limit was set by multiplying the square root of the number of background counts by three. The number of source counts was then divided by the effective exposure time, which was the average value within the aperture on the exposure map, to get the X-ray count rate (this procedure corrects the count rate for vignetting and other effects).
The E-CDF-S, which serves as the fourth epoch for the CDF-S, contains four observational fields, which overlap in a few areas over 50 . If an optical galaxy was detected in more than one field, we chose data from the field with greater source counts. If it was detected in only one field, we chose data from this field. If it was not detected in any field but was in the overlapping area, we chose data from the field with the longest effective exposure time.
We searched for outbursts following these steps:
-
1.
For every optical galaxy, we calculated its count rate or upper limit on count rate in each epoch and each energy band (i.e., each of the 36 images), unless it was not fully covered by a given image. A galaxy had coverage in up to five epochs if it was in the CDF-N and up to four epochs if it was in the CDF-S.
-
2.
For each energy band, we selected galaxies that were detected in at least one epoch. For each of these galaxies, we compared its highest count rate with its lowest count rate or upper limit on count rate. Thus we got either the variability factor or its lower limit for each source. If there was a variation of more than a factor of 20, then we considered that there was a candidate for an X-ray outburst in this galaxy.
3 RESULTS AND DISCUSSIONS
After systematically analyzing the count-rate variations, we found no outbursts in either the CDF-N or in the CDF-S. The distribution of the variability factors in the SB and HB is shown in Figure 3. The median relative uncertainty of these factors is . The count-rate variations of a few sources exceed a factor of 10. However, these are all off-axis sources and the significances of the variations are .


3.1 Upper Limits on the Outburst Event Rate
The nondetection of any X-ray outbursts in this survey can be used to constrain the rate of such outbursts in the Universe. Since the detectability of an outburst depends upon its luminosity, the constraints will have a luminosity dependence. Moreover, not all galaxies in this survey are capable of producing outbursts. Galaxies without a central SMBH (e.g., dwarf irregulars) cannot tidally disrupt stars, and a SMBH of mass will swallow stars whole (e.g., Frank & Rees, 1976). SMBH candidates with masses of a few in the centers of galaxies have been found (e.g., Greene & Ho, 2004; Peterson et al., 2005). Thus we consider that only galaxies with a SMBH mass greater than and less than can produce outbursts. SMBH masses were roughly estimated for all galaxies in this survey with the relation between and total galaxy luminosity in the band, . The relation was derived from the data for 27 low-redshift galaxies (10 late-type and 17 early-type galaxies) in Marconi & Hunt (2003). The intrinsic dispersion of this relation is 0.5 dex in log . Although there is evidence showing cosmic evolution of the - (SMBH mass and bulge velocity dispersion) relation and the bulge-to-SMBH mass ratio (e.g., Woo et al., 2006), the coexistent luminosity evolution makes the SMBHs at coincidently fall on nearly the same versus -band magnitude () relation (to 0.3 mag) as low-redshift galaxies (Peng et al., 2006). Thus we can expect that the - relation also holds approximately at for this galaxy sample. for the galaxies in this survey was extrapolated from -band magnitudes (10826 galaxies, Capak et al., 2004) or -band magnitudes (2873 galaxies, Capak et al., 2004) for the CDF-N, and from -band magnitudes (10167 galaxies, Caldwell et al., 2005) or -band magnitudes (802 galaxies, Wolf et al., 2004) for the CDF-S, using the spectral energy distribution for Sbc galaxies (Coleman, Wu, & Weedman, 1980). The resulting conversions from , , and magnitudes (AB system) to the standard magnitude were given by , , , and . Based on the dispersion of the - relation and the uncertainties in the color conversions, the derived is estimated to be good within an order of magnitude (as we show below, our main results are not sensitive to ). A comparison between the SMBH mass functions derived for the low-redshift galaxies in this sample and the local SMBH mass function for all galaxy types (Marconi et al., 2004) is shown in Figure 4. There is basic agreement between the shapes of these mass functions indicating that our mass measurements are reasonable.
There are galaxies in the CDF-N and galaxies in the CDF-S with in the range of . There will also be another constraint set by the physics of outburst production, i.e., a SMBH with a given mass cannot produce outbursts with arbitrarily high luminosities owing to, e.g., the Eddington limit. However, we ignore this constraint for now, as we would first like to present model-independent limits.


To determine the allowed rate of outbursts of X-ray luminosity greater than or equal to a certain value, we used the following “recipe”:
-
1.
For a given energy band (FB, SB, or HB), we picked an X-ray luminosity, , as the lower limit, and we derived the rate of outbursts of X-ray luminosities . Count rates or upper limits on count rates for all the galaxies in the survey were converted to luminosities based on their redshifts, using the Portable, Interactive, Multi-Mission Simulator (PIMMS) for a power-law photon index of . Galaxies generally have soft X-ray spectra during outburst and harder spectra in the their basal states. We thus considered a few choices of ranging from 2 to 5. The luminosity distributions for and are shown in Figure 5. Most of the luminosities are upper limits.
-
2.
We assumed that the typical duration of an outburst was . Theoretically predicted light curves of outbursts show a characteristic fast rise and slow decay. After the bulk of the material is accreted, which could be on a timescale of the order of months, the debris starts to form a radiation-pressure supported torus and the luminosity declines slowly as (Rees, 1988, 1990). This long-term decay could last for years and may have been observed (with large light-curve gaps) in a few outbursts (e.g., Komossa & Bade, 1999). The detailed luminosity evolution of outbursts, especially for the first few months, remains unknown, and likely varies greatly from event-to-event. For simplicity, we assumed that the luminosity is constant during the outburst, and after that the X-ray luminosity would drop by a minimum factor of 20. We then determined the total rest-frame time over which we are sensitive to outbursts of luminosity :
(1) where is the number of galaxies in the survey with , and is the rest-frame time over which we are sensitive to an outburst of luminosity for galaxy . can be expressed as:
(2) This integration is over all the rest-frame observation period, from time before the first epoch to the last epoch, and is our sensitivity “window function” to outbursts starting from time and with luminosity and duration . If we could detect such an outburst based on our searching criteria (step 2 in §2.3), then ; otherwise .
-
3.
The 90% confidence upper limit on 0 events is 2.303 from Gehrels (1986). Thus the 90% confidence upper limit on the event rate of outbursts is given by
(3) -
4.
Repeat the above steps for various values of and as well as different assumptions about outburst spectral shape.


The constraints set by Equation 3 depend significantly on the outburst duration and the lower luminosity limit , and they weakly depend on the spectral shape (we consider X-ray photon indices 2, 3, 4, or 5) and energy band (the SB or HB), as shown in Figures 6, 7 and 8. Longer outburst durations lead to tighter upper limits on the event rate. Photon indices affect the derived X-ray luminosities through the conversion from count rate to flux (from PIMMS) and the correction term . As increases, the conversion factor increases in the SB and decreases in the HB, while the correction term always increases and preferentially dominates over the conversion factor for high-luminosity sources since they generally have large redshifts. Thus the dependence of the upper limits on the spectral shape behaves differently in the SB and HB. Note that luminosities in the SB and HB are different, so the upper limits on the event rate in these energy bands cannot be compared to each other directly. Generally, assuming an outburst duration of 6 months, which was also adopted in Donley et al. (2002), the upper limit on the event rate is galaxy-1 yr-1, for an outburst with X-ray luminosity ergs .


3.2 Comparison with Previous Results
We compared these new constraints with the theoretical study by Wang & Merritt (2004) using a singular isothermal sphere, which analytically predicted a stellar tidal-disruption rate of
| (4) |
with being the SMBH mass, the velocity dispersion of the host galaxy, and and the mass and radius of the tidally disrupted stars. We added an “amplification” factor here to represent any redshift evolution of the rate. As the evolution of X-ray outbursts is unknown (see §1), we set for now. Utilizing the - relation from Ferrarese & Ford (2005):
| (5) |
Equation 4 becomes
| (6) |
As we are here comparing with a physical model, we modified our previous constraints on event rate by also considering the capability of a SMBH with a given mass to produce outbursts of high luminosities. We simply assumed that there was a narrow range for the outburst luminosity, which was around a fraction of the Eddington luminosity. , where is the outburst’s bolometric luminosity and ergs is the Eddington luminosity. We also assumed a bolometric correction , which was defined as . The constraint on is then
| (7) |
Applying this SMBH-mass requirement in addition to the requirement in step 2 of §3.1, we got weaker constraints on the event rate for high outburst luminosities, since the number of qualified galaxies is smaller. The derived upper limits as a function of for the SB and the HB are shown in Figures 9 and 10, respectively. Here we assume months, , and or 0.1. The event rate shows a dependence on the Eddington ratio, , since smaller will limit the number of galaxies that are capable of making bright outbursts. The new requirement on the SMBH mass does not affect the outburst rate at small , because all galaxies are capable of producing outbursts of such low X-ray luminosity.
To employ the formula for the theoretical tidal-disruption rate of a single galaxy (Equation 6) in our survey, we used calculated in §3.1. As the dependence of on is weak, there should not be a large error if our SMBH-mass estimation is not highly accurate; an error of a factor of 5 in only changes by a factor of 1.5. As we are only considering tidal disruptions of stars here, the disruption rate is dominated by subsolar stars according to the stellar mass function (Milosavljević et al., 2006). The radius of these stars follows the relation (e.g., Kippenhahn & Weigert, 1990). Thus the dependence on stellar mass and radius is weak, and we simply assumed solar mass and radius. For each , we took the average value of for all galaxies for which we are sensitive to an outburst of luminosity , which required . The predicted event rate for this survey as a function of is then given by
| (8) |
where if , and if .


as a function of for different spectral shapes and Eddington ratios is also plotted in Figures 9 and 10. Comparing these predictions with our survey constraints, we see that the upper limits derived in this survey are consistent with the predicted rates, except that around an X-ray luminosity of ergs , this deep-field survey sets a tighter constraint on the rate of Eddington-limited events than the theory (Figure 9a, Figure 10a). If we reduce to 0.1, the discrepancy decreases and almost disappears (Figure 9b, Figure 10b). There are other sources that may help to resolve this discrepancy: (1) As mentioned in §1, a tidal-disruption event may not exhibit the expected outburst characteristics, due to a short duration of the event or X-ray obscuration. It is then likely to be missed by current and previous surveys. (2) Equation 4 is derived under the assumption that the galactic nucleus is a singular isothermal sphere. For other kinds of density distributions, the predicted rate will become smaller according to Figure 5b of Wang & Merritt (2004), which gives the computed tidal-disruption rates and SMBH masses for all the galaxies in their sample. A straight-line fit to the data points in this plot gives
| (9) |
with a smaller rate and stronger dependence on SMBH mass. A comparison with the predicted tidal-disruption rate derived from this modified relation is shown in Figure 11. The revised rates are dex smaller and now are slightly below our observed upper limits for the full luminosity range. (3) The - relation in Equation 5 only holds for local SMBHs. The relation could evolve in the sense of velocity dispersion decreasing (Woo et al., 2006) with redshift for a fixed BH mass, making the predicted rate decrease at high redshift. All these effects may cause the upper limits on event rate given by this survey to be above the predicted stellar tidal-disruption rates. On the other hand, the galaxy sample in Wang & Merritt (2004) is a set of 61 elliptical galaxies, while our sample is dominated by late-type galaxies. By considering the contribution from the bulges of spirals, the predicted rates could be significantly increased (Wang & Merritt, 2004), as the masses of the bulges are smaller than the total masses of the galaxies that we were using. This could increase the discrepancy between the observations and theoretical predictions.


We employed the Eddington limit above based on the assumption that the X-rays come from a transient accretion disk and its corona. Alternatively, X-rays could instead come from tidal-stream collisions (e.g., Kochanek, 1994), in which case the luminosity could perhaps exceed the Eddington limit. If we remove the constraint on the SMBH mass set by Equation 7, the upper limits on the event rates get tighter for high X-ray luminosities and are the same as those in Figure 8, and the predicted rates also change due to their dependence on . The results are plotted in Figure 12, which shows the predicted rates from both the original relation (Equation 6) and its revision (Equation 9). Our survey constraints for ergs s-1 are dex tighter than the analytical predictions assuming isothermal stellar density distributions in galactic nuclei, and are consistent with the revised tidal-disruption rates derived from the full galaxy sample in Wang & Merritt (2004).
We have assumed in the above analyses, which represents no redshift evolution of the outburst rate. However, the rate of X-ray outbursts could increase with redshift owing to changes in galactic nuclei and SMBH masses. Milosavljević et al. (2006) have proposed that stellar tidal disruptions are largely responsible for the AGN X-ray luminosity function at luminosities below erg s-1. If this is indeed the case, then the order-of-magnitude increase in the comoving number density of such AGNs out to (e.g., Brandt & Hasinger 2005 and references therein) implies that the outburst rate must correspondingly increase. Scaling the Wang & Merritt (2004) rates upward by to account for the median redshift of our sample would lead to significant disagreement with our observational constraints, even if the revised rate (Equation 9) is adopted, suggesting that the X-ray luminosity function at luminosities below erg s-1 is not primarily due to stellar tidal disruptions.


On the observational side, Donley et al. (2002) performed a systematic survey for X-ray outbursts using the ROSAT database (although this survey had some substantial systematic uncertainties owing to complex selection effects). They detected five outbursts and placed the first constraints on the rate of such outbursts. The rate of large-amplitude X-ray outbursts from inactive galaxies in the local Universe is galaxy-1 yr-1, estimated from the survey volume and the galaxy space density. Compared to their results, our survey constraints are based on uniform observational data for optical galaxies which are less biased, and there are no uncertainties introduced in the estimation of survey volume or the galaxy space density. Moreover, we are able to probe X-ray outbursts with higher redshifts and in a harder X-ray band for the first time, and we derived luminosity-dependent rate constraints which offer insight into the low-luminosity regime. HB X-ray surveys are able to detect obscured outbursts which could have been missed in previous surveys; intrinsic column densities as low as cm-2, perhaps associated with gas from the tidally disrupted star, would greatly reduce the detectability of soft-spectrum outbursts in the ROSAT band. Here we adopted months, the same as in Donley et al. (2002). The SB and HB constraints are shown in Figure 8. From down to ergs s-1, the upper limit on the event rate increases from galaxy-1 yr-1 to galaxy-1 yr-1, mainly due to the limited sensitivity in the low-luminosity regime. Further observations are required to assess whether low-amplitude events, which could come from partial tidal disruptions or the accretion of brown dwarfs, planets, or small gas clouds, are truly more common than high-amplitude events, as for other transient phenomena in nature. When ergs , the upper limit on the event rate is galaxy-1 yr-1, either in the SB or the HB. Compared to the results in Donley et al. (2002), these constraints allow an amplification of the outburst rate up to a factor of 10 at most when considering obscured X-ray outbursts and redshift evolution from to .
4 CONCLUSIONS AND FUTURE WORK
In summary, we constructed a sample of optical galaxies in the CDF-N and CDF-S with redshifts obtained from the literature; the median redshift is . We analyzed exceptionally sensitive Chandra observations of these galaxies, which span days for the CDF-N and days for the CDF-S. We searched for X-ray outbursts with the criterion that the count rate varies by a minimum factor of 20 in one of three standard bands. No outbursts were found, and thus we set upper limits on the rate of such events in the Universe, which depend on the X-ray luminosity of outbursts. If we only consider those galaxies hosting SMBHs, and those with SMBHs not massive enough to swallow a whole star without disruption, we derive an upper limit on the rate of an outburst with ergs and months to be galaxy-1 yr-1 (Figure 8), without any other assumptions about the physical model producing X-ray outbursts. Compared to the survey by Donley et al. (2002), our survey probes both higher redshifts and harder X-ray energies. The outburst rate may increase by a maximum factor of 10 when taking into account both obscured X-ray outbursts and redshift evolution from to . We are able to set constraints on low-luminosity events down to ergs s-1, though at this luminosity the event rate is limited by sensitivity.
We also compared our constraints to the predicted tidal-disruption rates of Wang & Merritt (2004), exploring several possibilities in physical parameter space. If the outburst luminosity is limited by the Eddington luminosity with , or the predicted rate is computed from a modified relation which does not require isothermal stellar density distributions in galactic nuclei, our results are roughly consistent with theoretical predictions. Otherwise, our constraints are tighter than the predictions. Moreover, if stellar tidal disruptions are largely responsible for the AGN X-ray luminosity function at luminosities below erg s-1 as proposed by Milosavljević et al. (2006), the predicted rate should be scaled upward by to account for the median redshift of our sample. This scaling leads to significant discrepancies with our observational constraints, suggesting that the X-ray luminosity function at low luminosities is not likely to be dominated by stellar tidal disruptions.
The constraints set by this study could be significantly improved by further deep-field surveys and new missions. For example, the 1 Ms of additional CDF-S exposure starting in 2007 September will increase the monitoring baseline significantly and provide new observations which could be grouped into several additional epochs for outburst searching and other variability studies. Future missions such as Lobster and eROSITA in the soft X-ray band and the BHFP in the hard X-ray band will also be capable of detecting and studying outbursts, benefiting from their large sky coverage. Grindlay (2004) predicted that the Energetic X-ray Imaging Survey Telescope (EXIST) implementation of the BHFP would detect X-ray outbursts out to Mpc at a rate of yr-1, adopting the rates of Wang & Merritt (2004). Such missions will put better constraints on the outburst rate, the fraction of obscured outbursts, and redshift evolution, enhancing our knowledge about the nature of X-ray outbursts.
5 ACKNOWLEDGEMENTS
We thank P. Capak, B. D. Lehmer, A. Marconi and D. Merritt for helpful discussions. We acknowledge financial support from Chandra X-ray Center grants AR6-7021X (BL, WNB, ATS) and G04-5157A (BL, WNB, ATS).
References
- Alexander et al. (2003) Alexander, D. M., et al. 2003, AJ, 126, 539
- (2) Brandt, W. N., Pounds, K. A., & Fink, H. 1995, MNRAS, 273, L47
- Brandt et al. (2001) Brandt, W. N., et al. 2001, AJ, 122, 2810
- (4) Brandt, W. N. 2005, New Ast. Rev., 49, 430
- (5) Brandt, W. N., & Hasinger, G., 2005, ARAA, 43, 827
- Bundy et al. (2004) Bundy, K., Fukugita, M., Ellis, R. S., Kodama, T., & Conselice, C. J. 2004, ApJ, 601, L123
- Capak et al. (2004) Capak, P., et al. 2004, AJ, 127, 180
- Capak et al. (2007) —. 2007, in preparation
- Caldwell et al. (2005) Caldwell, J. A. R., et al. 2005, ApJS, submitted (astro-ph/0510782)
- Coleman et al. (1980) Coleman, G. D., Wu, C.-C., & Weedman, D. W. 1980, ApJS, 43, 393
- Cowie et al. (2004) Cowie, L. L., Barger, A. J., Hu, E. M., Capak, P., & Songaila, A. 2004, AJ, 127, 3137
- (12) Donley, J. L., Brandt, W. N., Eracleous, M., & Boller, Th. 2002, AJ, 124, 1308
- Elmegreen et al. (2007) Elmegreen, D. M., Elmegreen, B. G., Ferguson, T., & Mullan, B. 2007, ApJ, 663, 734
- Esquej et al. (2007) Esquej, P., Saxton, R. D., Freyberg, M. J., Read, A. M., Altieri, B., Sanchez-Portal, M., & Hasinger, G. 2007, A&A, 462, L49
- Ferrarese & Ford (2005) Ferrarese, L., & Ford, H. 2005, Space Sci. Rev., 116, 523
- Frank & Rees (1976) Frank, J., & Rees, M. J. 1976, MNRAS, 176, 633
- Freeman et al. (2002) Freeman, P. E., Kashyap, V., Rosner, R., & Lamb, D. Q. 2002, ApJS, 138, 185
- Gehrels (1986) Gehrels, N. 1986, ApJ, 303, 336
- Gezari et al. (2006) Gezari, S., et al. 2006, ApJ, 653, L25
- Giacconi et al. (2002) Giacconi, R., et al. 2002, ApJS, 139, 369
- Greene & Ho (2004) Greene, J. E., & Ho, L. C. 2004, ApJ, 610, 722
- Groenewegen et al. (2002) Groenewegen, M. A. T., et al. 2002, A&A, 392, 741
- Grindlay (2004) Grindlay, J. E. 2004, in American Institute of Physics Conference Series, Vol. 714, X-ray Timing 2003: Rossi and Beyond, ed. P. Kaaret, F. K. Lamb, & J. H. Swank, 413–422
- (24) Grindlay, J. E. 2005, New Ast. Rev., 49, 436
- (25) Grupe, D., Beuermann, K., Mannheim, K., Bade, N., Thomas, H. C., de Martino, D., Schwope, A. 1995, A&A, 299, L5
- Häussler et al. (2007) Häussler, B., et al. 2007, ApJS, submitted (arXiv:0704.2601v2)
- Kippenhahn & Weigert (1990) Kippenhahn, R., & Weigert, A. 1990, Stellar Structure and Evolution, (Berlin: Springer)
- (28) Kobayashi, S., Laguna, P., Phinney, E. S., & Meszaros, P. 2004, ApJ, 615, 855
- Kochanek (1994) Kochanek, C. S. 1994, ApJ, 422, 508
- Komossa & Bade (1999) Komossa, S., & Bade, N. 1999, A&A, 343, 775
- (31) Komossa, S. 2002, Rev. Mod. Ast., 15, 27
- (32) Komossa, S., Halpern, J., Schartel, N., Hasinger, G., Santos-Lleo, M., Predehl, P. 2004, ApJ, 603, L17
- Kraft et al. (1991) Kraft, R. P., Burrows, D. N., & Nousek, J. A. 1991, ApJ, 374, 344
- Le Fèvre et al. (2004) Le Fèvre, O., et al. 2004, A&A, 428, 1043
- Lehmer et al. (2005) Lehmer, B. D., et al. 2005, ApJS, 161, 21
- Lehmer et al. (2007) —. 2007, in preparation
- (37) Li, L. X., Narayan, R., & Menou, K. 2002, ApJ, 576, 753
- (38) Lockman, F. 2004, Soft X-ray Emission from Clusters of Galaxies and Related Phenomena, ed. R. Lieu & J. Mittaz (Dordrecht: Kluwer), 111
- Magorrian & Tremaine (1999) Magorrian, J., & Tremaine, S. 1999, MNRAS, 309, 447
- Marconi & Hunt (2003) Marconi, A., & Hunt, L. K. 2003, ApJ, 589, L21
- Marconi et al. (2004) Marconi, A., Risaliti, G., Gilli, R., Hunt, L. K., Maiolino, R., & Salvati, M. 2004, MNRAS, 351, 169
- Milosavljević et al. (2006) Milosavljević, M., Merritt, D., & Ho, L. C. 2006, ApJ, 652, 120
- Mobasher et al. (2004) Mobasher, B., et al. 2004, ApJ, 600, L167
- (44) Paolillo, M., Schreier, E. J., Giacconi, R., Koekemoer, A. M., & Grogin, N. A. 2004, ApJ, 611, 93
- Peng et al. (2006) Peng, C. Y., Impey, C. D., Ho, L. C., Barton, E. J., & Rix, H.-W. 2006, ApJ, 640, 114
- Peterson et al. (2005) Peterson, B. M., et al. 2005, ApJ, 632, 799
- Reddy et al. (2006) Reddy, N. A., Steidel, C. C., Erb, D. K., Shapley, A. E., & Pettini, M. 2006, ApJ, 653, 1004
- Rees (1988) Rees, M. J. 1988, Nature, 333, 523
- Rees (1990) —. 1990, Science, 247, 817
- (50) Siemiginowska, A., Czerny, B., & Kostyunin, V. 1996, ApJ, 458, 491
- (51) Stark, A. A., Gammie, C. F., Wilson, R. W., Bally, J., Linke, R. A., Heiles, C., & Hurwitz, M. 1992, ApJS, 79, 77
- Syer & Ulmer (1999) Syer, D., & Ulmer, A. 1999, MNRAS, 306, 35
- (53) Ulmer, A. 1999, ApJ, 514, 180
- Vanzella et al. (2005) Vanzella, E., et al. 2005, A&A, 434, 53
- Vanzella et al. (2006) —. 2006, A&A, 454, 423
- (56) Vaughan, S., Edelson, R., & Warwick, R. S. 2004, MNRAS, 349, L1
- Wang & Merritt (2004) Wang, J., & Merritt, D. 2004, ApJ, 600, 149
- Wirth et al. (2004) Wirth, G. D., et al. 2004, AJ, 127, 3121
- Wolf et al. (2004) Wolf, C., et al. 2004, A&A, 421, 913
- Woo et al. (2006) Woo, J.-H., Treu, T., Malkan, M. A., & Blandford, R. D. 2006, ApJ, 645, 900